Repository navigation
Module 1: Predict TF Binding Sites (TFBS)
- a merged ATAC peak master table containing normalized per-condition signal and overlap matrix (example)
- a corresponding normalized RNA-seq count matrix (example)
- a directory containing per-condition, per-motif footprint scoreand binding overview files generated by TOBIAS (example) or by other footprinting methods and formatted in TOBIAS-compatible style (optional)
- a metadata table mapping samples to conditions
- a
*.yamlfile specifying file paths to input data and other configuration settings (example)
Supported genomes include hg38 and mm10
-
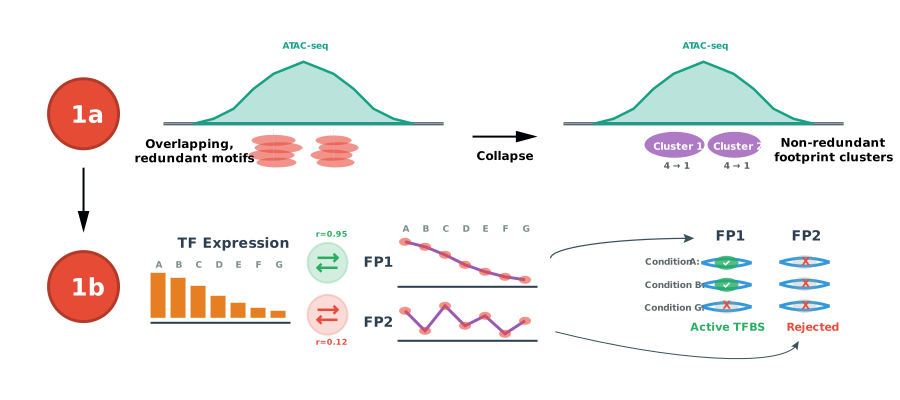
Load, prepare & filter input data to create a multiomic data object ready for downstream analysis using the
load_prep_multiomic_data()function.1.1. Load and combine RNA, ATAC and footprint input data based on paths specified in the
*.yamlconfiguration file.1.2. Collapse overlapping/redundant TF motif footprints into non-redundant, merged footprints and assign TF motifs to consensus TF motif clusters.
1.3. Generate a binary, condition-specific footprint binding flag matrix (bound=1; unbound=0) based on the
threshold_fp_scorecutoff specified in the*.yamlconfiguration file. Because footprint scores are computed from merged ATAC peaks, setFP_binding(FP_peak, condition)flag to 0 if the correspondingATAC_overlap(ATAC_peak, condition) = 0.1.4. Perform cross-condition quantile normalization on collapsed, nonredudant footprints that are flagged as bound in at least one condition.
1.5. Generate a binary, condition-specific gene expression flag matrix based on
threshold_gene_exprcutoff specified in the*.yamlconfiguration file. -
Predict TF binding sites (TFBS) using the
correlate_tf_to_fp()function, which computes pairwise Spearman (rank-based) and Pearson (linear) correlations across all matched conditions between expressed TFs and normalized footprint scores (or peak signals if footprint scores are not provided).
- A combined multi-omic data object containing normalized signal matrices, binary flag matrices, and annotations for downstream analyses (example).
- A collapsed raw footprint score matrix across all conditions, and a PDF containing summary statistic plots of the footprint merging process.
- A collapsed, filtered, and normalized footprint score matrix; the corresponding footprint binding flag matrix; a footprint annotation table across all conditions; and a PDF containing summary statistic plots for normalization and total bound footprints per condition.
- A TF motif cluster assignment table, and a PDF containing summary statistics plots of TF motif clustering.
- A gene expression flag matrix, and a PDF containing summary statistic plots comparing total expressed genes per condition.
- A directory containing binding probability overviews for each TF across all conditions, a summary table of predicted binding site counts per TF per condition, and a PDF containing overall and per-TF correlation statistic plots.
# Combine ATAC, footprint and RNAseq data into one object and prep for downstream analysis
data_object <- load_prep_multiomic_data(
  config = "episcope_grn.yaml",
  genome = "hg38",          # or "mm10"
  gene_symbol_col = "HGNC" # or "Gene_symbol"
)

# Correlate footprints to TF expression across matched conditions
data_object <- correlate_tf_to_fp(
  data_object,
  qc = TRUE
)