Repository navigation
Module 2: Connect TFs to Target Genes
- A combined multi-omic data object containing normalized signal matrices, binary flag matrices, and annotations from Module 1
-
Optional: A 3D chromatin interaction loop file (example)
-
Link TF(s) with target genes using the
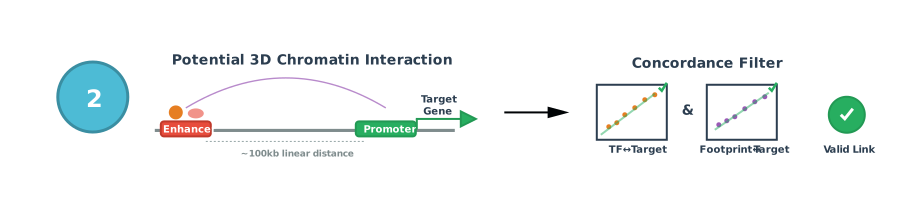
link_tf_targets()function.1.1. Link TF binding sites (TFBS; from Module 1) to candidate target genes using GeneHancer enhancer–gene mappings (default), user-defined genomic distance constraints (e.g., within 30 kb of the TSS), or a user-supplied 3D chromatin interaction loop file. These options are specified in the
*.yamlconfiguration file.1.2. Generate a binary, condition-specific TF->TFBS->target link status matrix. A link is flagged as 1 in a given condition ONLY if (i) both the TF and the target gene pass the expression cutoff specified in the
*.yamlfile, and (ii) the corresponding footprint and peak are both flagged as bound, and (iii) both footprint score and peak signal exceed their respective cutoffs specified in the*.yamlfile .1.3. For TF->target links with
link_status(condition) = 1in at least one condition, compute pairwise Pearson correlations between TF expression and candidate target gene expression across all matched conditions. For TFBS->target links, subsequently compute Spearman (rank-based) followed by Pearson (linear) correlations between normalized footprint scores (or peak signals if footprint scores are not available) and candidate target gene expression across all matched conditions. After each correlation step, links that fail to meet the cutoffs specified in the*.yamlconfiguration file are removed. -
Generate and output per-condition link summary matrices ready for downstream GRN analysis using the
extract_link_info_by_condition()function.
- A TF->TFBS->target link overview table containing condition-specific link status flags and correlation statistics, a summary table of active link counts per TF per condition and a corresponding PDF containing summary statistic plots comparing total active links per condition and active link counts per TF per condition.
- A directory containing per-condition link matrices containing TF and target expression, footprint (if available) and peak signals/binding status, formatted for direct GRN visualization or differential GRN analysis.
# Link and correlate TF and TFBS with potential target genes
links <- link_tf_targets(data_object)

# Output per-condition summary of TF->TFBS->Target links
extract_link_info_by_condition(data_object, links, qc = TRUE)
Key options (YAML)
-
priors_mode: genehancer | tss_window | loop_file -
tss_window_bp: 30000 -
loop_file: path to 3D loop file (if provided)