I'm having trouble debugging the PatternFly examples in Chrome. It's nearly impossible to set a breakpoint, which makes development very difficult -- been using console.log output.
I see the sourceMappingURL at the bottom of each file, but also see React.createElement statements, which suggests that Chrome is not loading the source maps properly.
I see the same result in Chrome and Firefox. However, I'm able to debug the Cost management and RBAC UIs just fine.
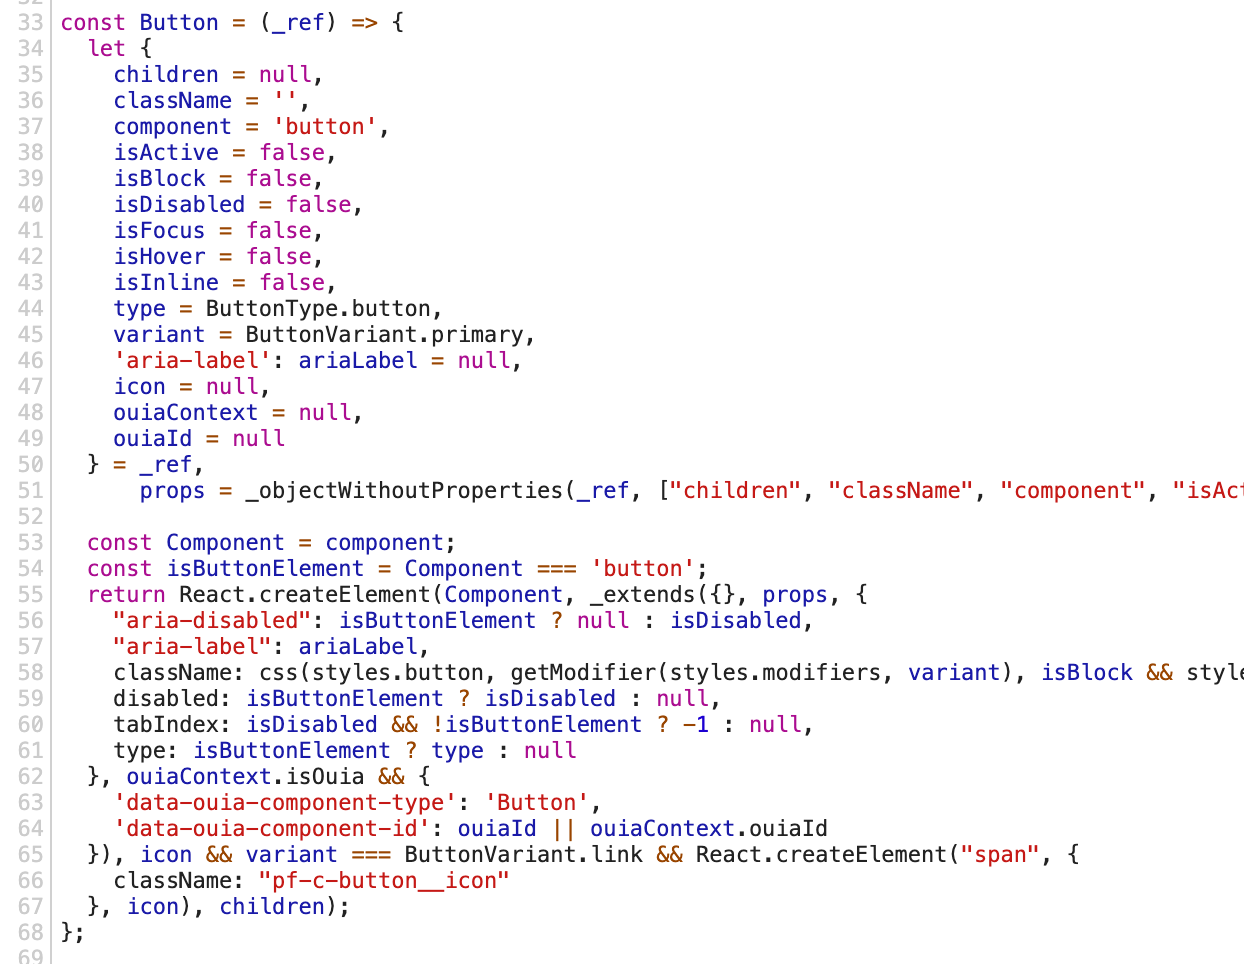
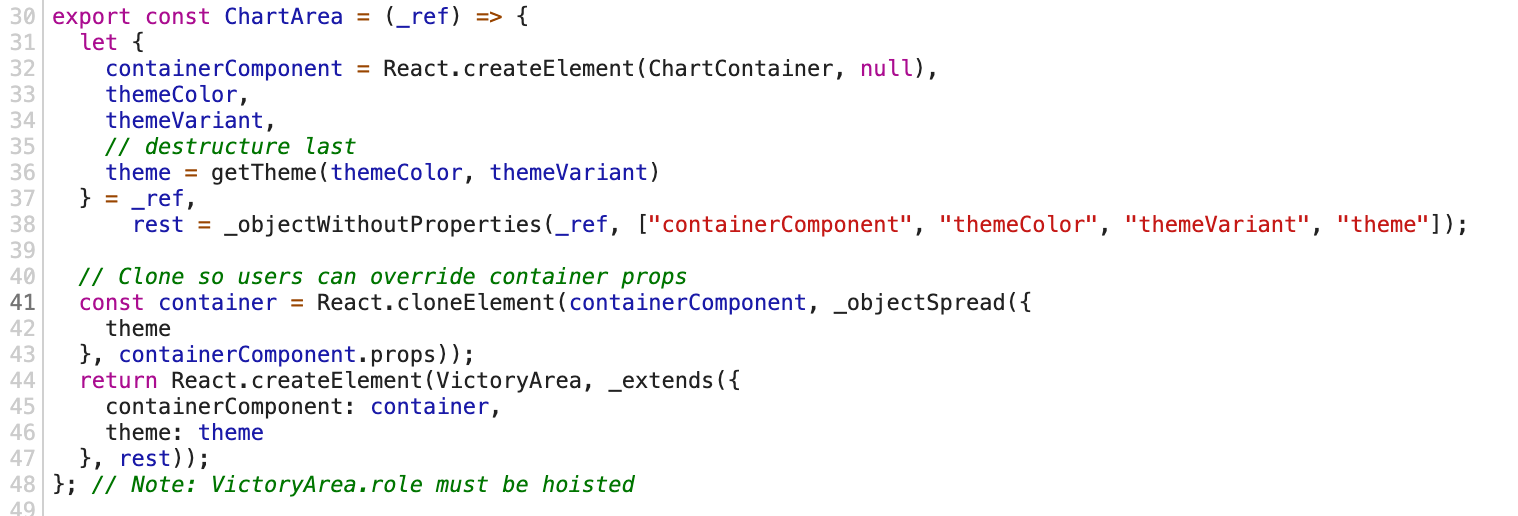
The following files are from .../react-core/dist/esm and .../react-charts/dist/esm respectively.
Button -- no available breakpoints
ChartArea -- random breakpoints available

I'm having trouble debugging the PatternFly examples in Chrome. It's nearly impossible to set a breakpoint, which makes development very difficult -- been using
console.logoutput.I see the
sourceMappingURLat the bottom of each file, but also seeReact.createElementstatements, which suggests that Chrome is not loading the source maps properly.I see the same result in Chrome and Firefox. However, I'm able to debug the Cost management and RBAC UIs just fine.
The following files are from
.../react-core/dist/esmand.../react-charts/dist/esmrespectively.Button -- no available breakpoints

ChartArea -- random breakpoints available
