Fix histogram and errorbar gallery compatibility [mpl compatibility]#247
Fix histogram and errorbar gallery compatibility [mpl compatibility]#247sselvakumaran wants to merge 12 commits into
Conversation


Merging this PR will degrade performance by 23.18%
|
| Benchmark | BASE |
HEAD |
Efficiency | |
|---|---|---|---|---|
| ❌ | test_select_lasso_message_1m |
89.3 ms | 127.3 ms | -29.87% |
| ❌ | test_pyramid_compose |
9.3 ms | 11 ms | -15.84% |
Tip
Investigate this regression by commenting @codspeedbot fix this regression on this PR, or directly use the CodSpeed MCP with your agent.
Comparing agent/gallery-hist-errorbar-compat (fe6ce2b) with main (9b08085)2

Footnotes
-
1 benchmark was skipped, so the baseline result was used instead. If it was deleted from the codebase, click here and archive it to remove it from the performance reports. ↩
-
No successful run was found on
main(bf903bc) during the generation of this report, so 9b08085 was used instead as the comparison base. There might be some changes unrelated to this pull request in this report. ↩

|
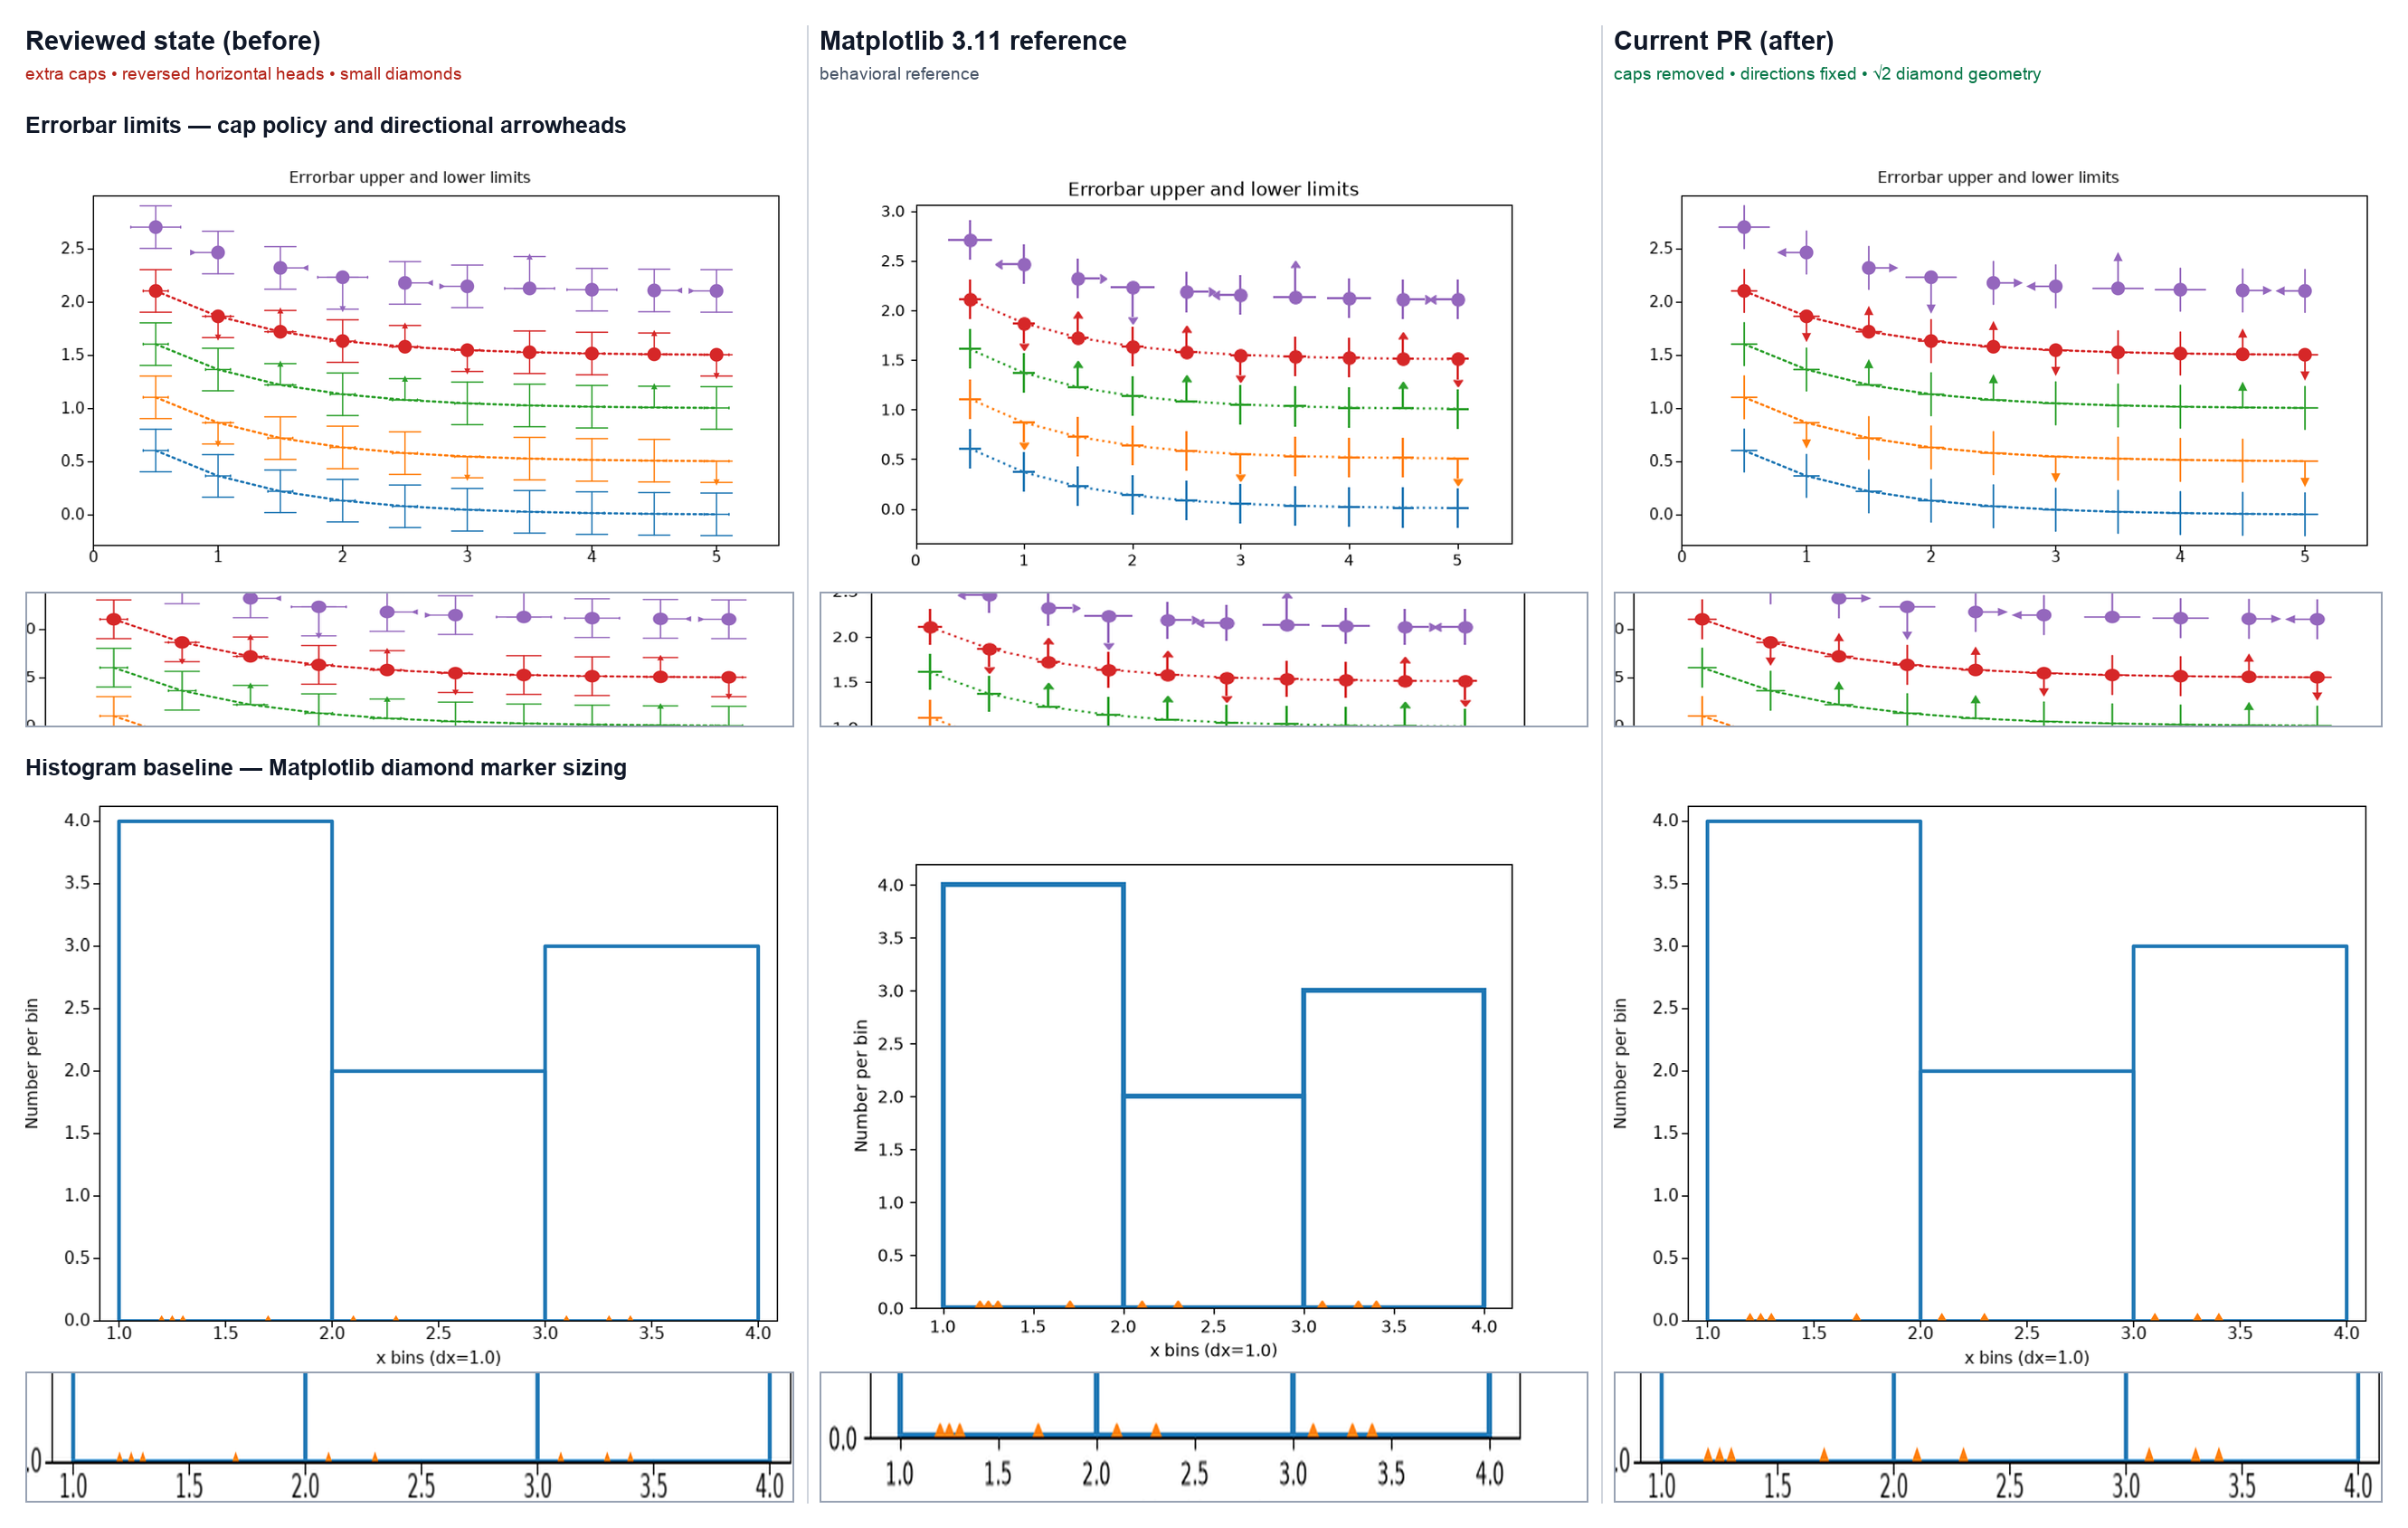
first plot w/ error bar upper and lower limits - the CI errorbars (one vertical and two horizontals, like a capital I shape) should not be visible, just the arrows and the direct lines coming from the point should be visible. you can see this in the image provided. all five lines have this problem, but look at the blue line - the matplotlib one just has crosses with no horizontal bars besides the ones coming out of the point on the line, but the xy one also includes two more horizontals (the CI errorbars). also, some of the arrows do not seem correct - for the purple points the second point has an arrow going left in mol, but the xy version has the arrow’s shaft goes left but the arrowhead points right (both should point left). up and down seems fine. also minor nitpick but the lines seem slightly too long and not thick enough (is this a problem with 2x scale?) in the second plot (bar plot w/ orange diamonds), the diamonds do not seem large enough (is this a problem with 2x scale?) |
 sselvakumaran
changed the title
sselvakumaran
changed the title


|
Addressed the review points in
I reran the exact Matplotlib 3.11 gallery script. In the histogram panel, the visible diamond height at normalized 640x480 is now 6 px in both renders. The marker being half-clipped at y=0 is expected here: Matplotlib does the same because the histogram baseline is sticky. The 2x export scale was not the cause. Before / Matplotlib 3.11 / afterThe left column is the state reviewed above; the center is the exact Matplotlib 3.11 output; the right is a fresh render from
|
|
I rechecked the current-head CodSpeed red separately from the visual review. It is not caused by this PR:
There is therefore no causal performance fix to make in #247. The four human visual findings are covered by |

|
Important Review skippedDraft detected. Please check the settings in the CodeRabbit UI or the ⚙️ Run configurationConfiguration used: defaults Review profile: CHILL Plan: Pro Plus Run ID: You can disable this status message by setting the Use the checkbox below for a quick retry:
✨ Finishing Touches🧪 Generate unit tests (beta)
Comment |
1 participant

What changed
facecolor,fill, and scalar/per-datasetlinewidthstep/stepfilledfill override semanticsmarker,markersize,linestyle, and dashes to the errorbar data line onlylolims,uplims,xlolims, andxuplimsWhy
These gaps prevented two official Matplotlib 3.11 statistics examples from rendering at all. A script-exit-only pass initially exposed a second bug: one-sided error limits were still ordinary capped bars. This PR includes the visual geometry fix as well.
Official references:
Gallery impact
statistics/errorbar_limits.py: newly complete, 1/1 outputstatistics/histogram_normalization.py: newly complete, 9/9 outputshistogram_histtypes.pyadvances to the independentrwidthblockerhistogram_multihist.pyrenders its first three captures, then reaches the independenthatchblockerThis PR does not touch the global margin/tick-spacing work in #240.
Validation
544 passed, 65 skippedacross the full pyplot suitegit diff --check