Skip to content

Fix pyplot autoscale margins and bar extents [mpl compatibility]#240

Draft
sselvakumaran wants to merge 17 commits into
mainfrom
agent/fix-pyplot-autoscale-margins
Draft

Fix pyplot autoscale margins and bar extents [mpl compatibility]#240
sselvakumaran wants to merge 17 commits into
mainfrom
agent/fix-pyplot-autoscale-margins

Conversation

@sselvakumaran

Copy link
Copy Markdown
Contributor

Summary

  • snapshot Matplotlib's default x/y autoscale margins when each axes is created, and apply them consistently to public limits and rendered domains
  • compute bar autoscale extents from the full geometry: category width, zero or explicit baseline, and cumulative stacked endpoints
  • keep bar baselines and contour boundaries sticky while adding Matplotlib-style headroom, including log-coordinate padding
  • add regressions for line/log margins, positive/negative/mixed/stacked/horizontal/categorical bars, and bar-label headroom

Validation

  • pytest -q tests/pyplot — 623 passed, 3 skipped
  • focused autoscale/layout/reference suite — 50 passed
  • ruff check — passed
  • ruff format --check — passed
  • git diff --check — passed

The visual micro-suite also confirms line views now use the expected 5% limits and ordinary/stacked/horizontal bar labels remain inside the rendered view.

@greptile-apps

greptile-apps Bot commented Jul 24, 2026

Copy link
Copy Markdown

Greptile Summary

This PR updates pyplot autoscaling and label geometry to match Matplotlib-style margins. The main changes are:

  • Adds explicit x/y axis margin support in core chart axes and public components.
  • Snapshots pyplot rc autoscale margins when axes are created.
  • Applies consistent margin handling to public limits and rendered domains.
  • Expands bar autoscale extents using full bar geometry, baselines, and stacked endpoints.
  • Adjusts tick-label padding and bar-label alignment across browser, SVG, and raster rendering.
  • Adds tests for line/log margins, bar layouts, twin axes, singleton data, and UI label placement.

Confidence Score: 5/5

This PR appears safe to merge with low risk.

The changes are focused on autoscale range propagation and render geometry, with broad tests for the affected pyplot, core, SVG/raster, and browser paths. No verified correctness or security issues were found in the changed code.

No files require special attention.

T-Rex T-Rex Logs

What T-Rex did

  • Executed the PyTest suite for pyplot-autoscale-bar-layout validation and saved a proof log detailing the command, working directory, pytest output, timestamps, and an exit code of 0.

View all artifacts

T-Rex Ran code and verified through T-Rex

Important Files Changed

Filename Overview
python/xy/pyplot/_axes.py Snapshots rc autoscale margins, delegates render margins to core axes, and expands bar/contour autoscale extents with sticky baselines.
python/xy/_figure.py Adds axis margin support to core autorange, including explicit log-coordinate padding and singleton handling.
python/xy/components.py Exposes validated margin on public x/y axis components and forwards it into figure axis options.
python/xy/pyplot/_plot_types.py Updates bar labels to use point-scaled padding and vertical alignment for positive/negative bar geometry.
python/xy/_svg.py Adds shared tick-label offset calculation and updates SVG tick/annotation text placement.
python/xy/_raster.py Aligns raster tick-label and bottom-aligned annotation placement with SVG/browser geometry.
js/src/50_chartview.ts Adjusts browser tick-label placement to account for tick length, direction, and label padding.
tests/pyplot/test_autoscale_margin_bar_regressions.py Adds focused tests for pyplot margins, log scaling, twin axes, singleton data, bars, and bar labels.

Reviews (7): Last reviewed commit: "Remove visual comparison asset" | Re-trigger Greptile

@codspeed-hq

codspeed-hq Bot commented Jul 24, 2026

Copy link
Copy Markdown

Merging this PR will not alter performance

✅ 102 untouched benchmarks
⏩ 2 skipped benchmarks1


Comparing agent/fix-pyplot-autoscale-margins (5c7418e) with main (119a1ce)

Open in CodSpeed

Footnotes

  1. 2 benchmarks were skipped, so the baseline results were used instead. If they were deleted from the codebase, click here and archive them to remove them from the performance reports.

Comment thread python/xy/pyplot/_axes.py
@sselvakumaran

Copy link
Copy Markdown
Contributor Author

Before / after renderings

These are the same pyplot gallery cases at the same normalized 640×480 output size. Before is the pre-PR behavior; after is this PR.

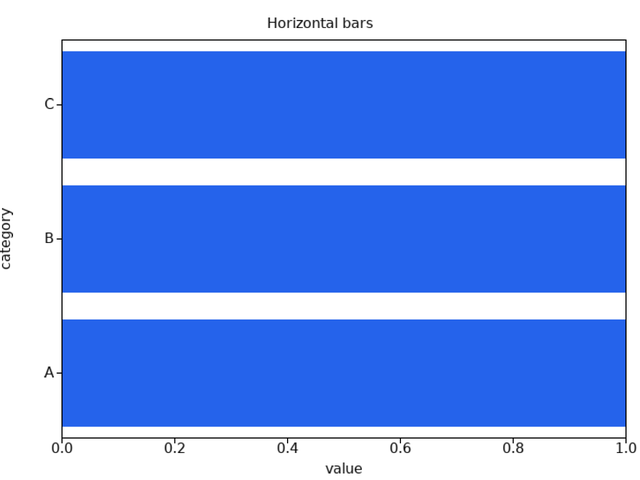
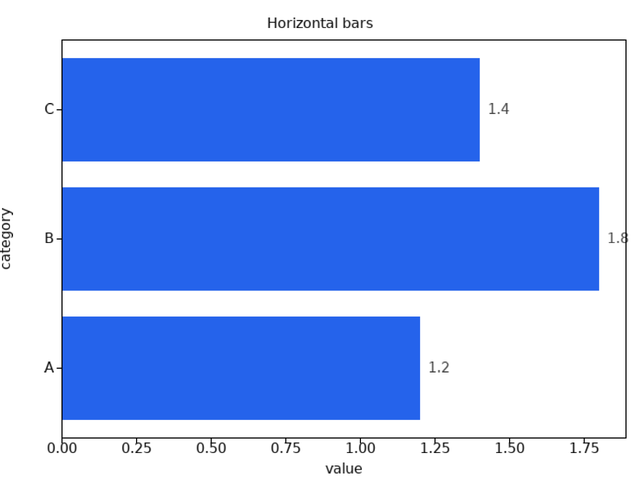
Horizontal bars — full value/category extents

Before, every bar is clipped to the fallback 0..1 x-domain. After, the data extent, category width, and label headroom are included.

Before After
Horizontal bars before Horizontal bars after

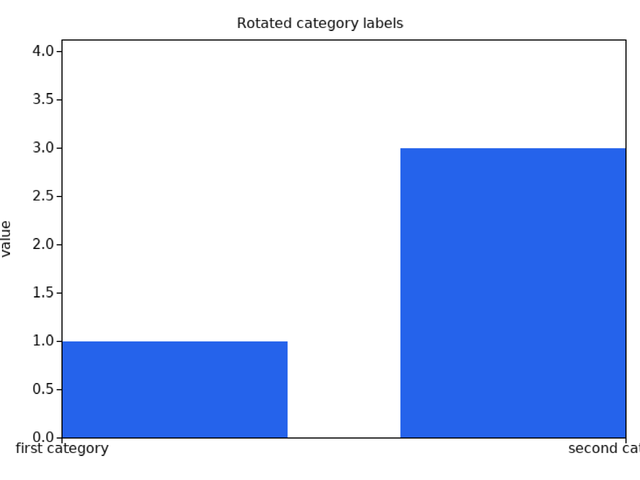
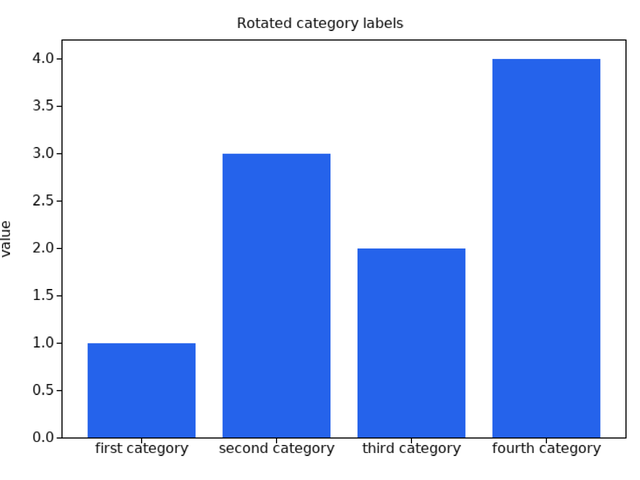
Rotated categorical bars — all categories remain in view

Before, the fallback category domain shows only two of four bars. After, all four categories and the outer half-bar widths fit.

Before After
Rotated categorical bars before Rotated categorical bars after

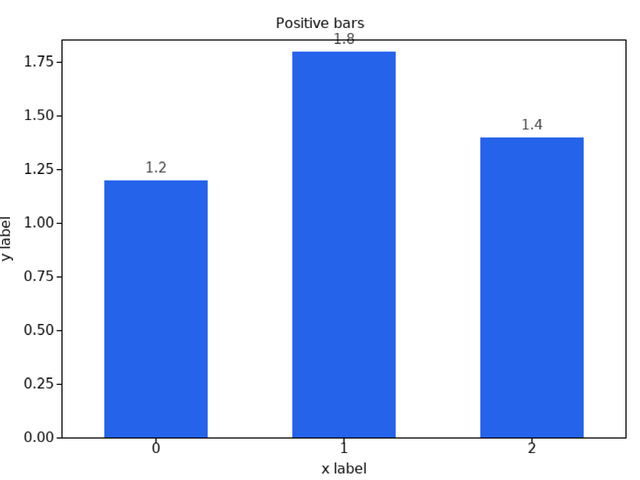
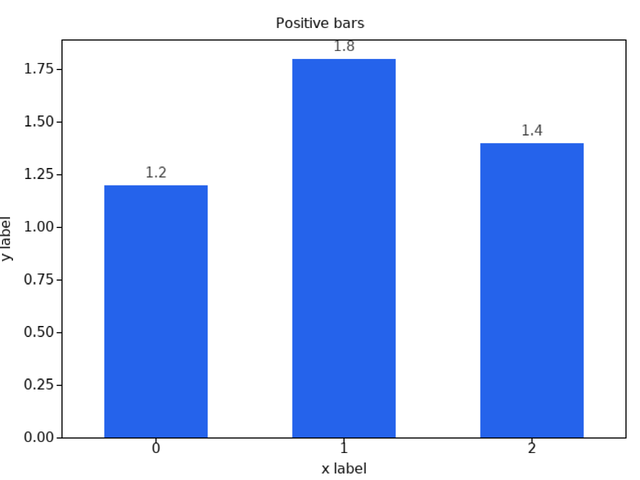
Positive bar labels — Matplotlib-style headroom

Before, the tallest value label crosses the top spine. After, the 5% autoscale margin keeps it inside the axes.

Before After
Positive bar labels before Positive bar labels after

The largest changes are in the plot limits and bar visibility. This PR does not fix the separate tick-label-to-tick spacing/chrome issue; that remains visible in both sets.

sselvakumaran commented Jul 24, 2026

Copy link
Copy Markdown
Contributor Author

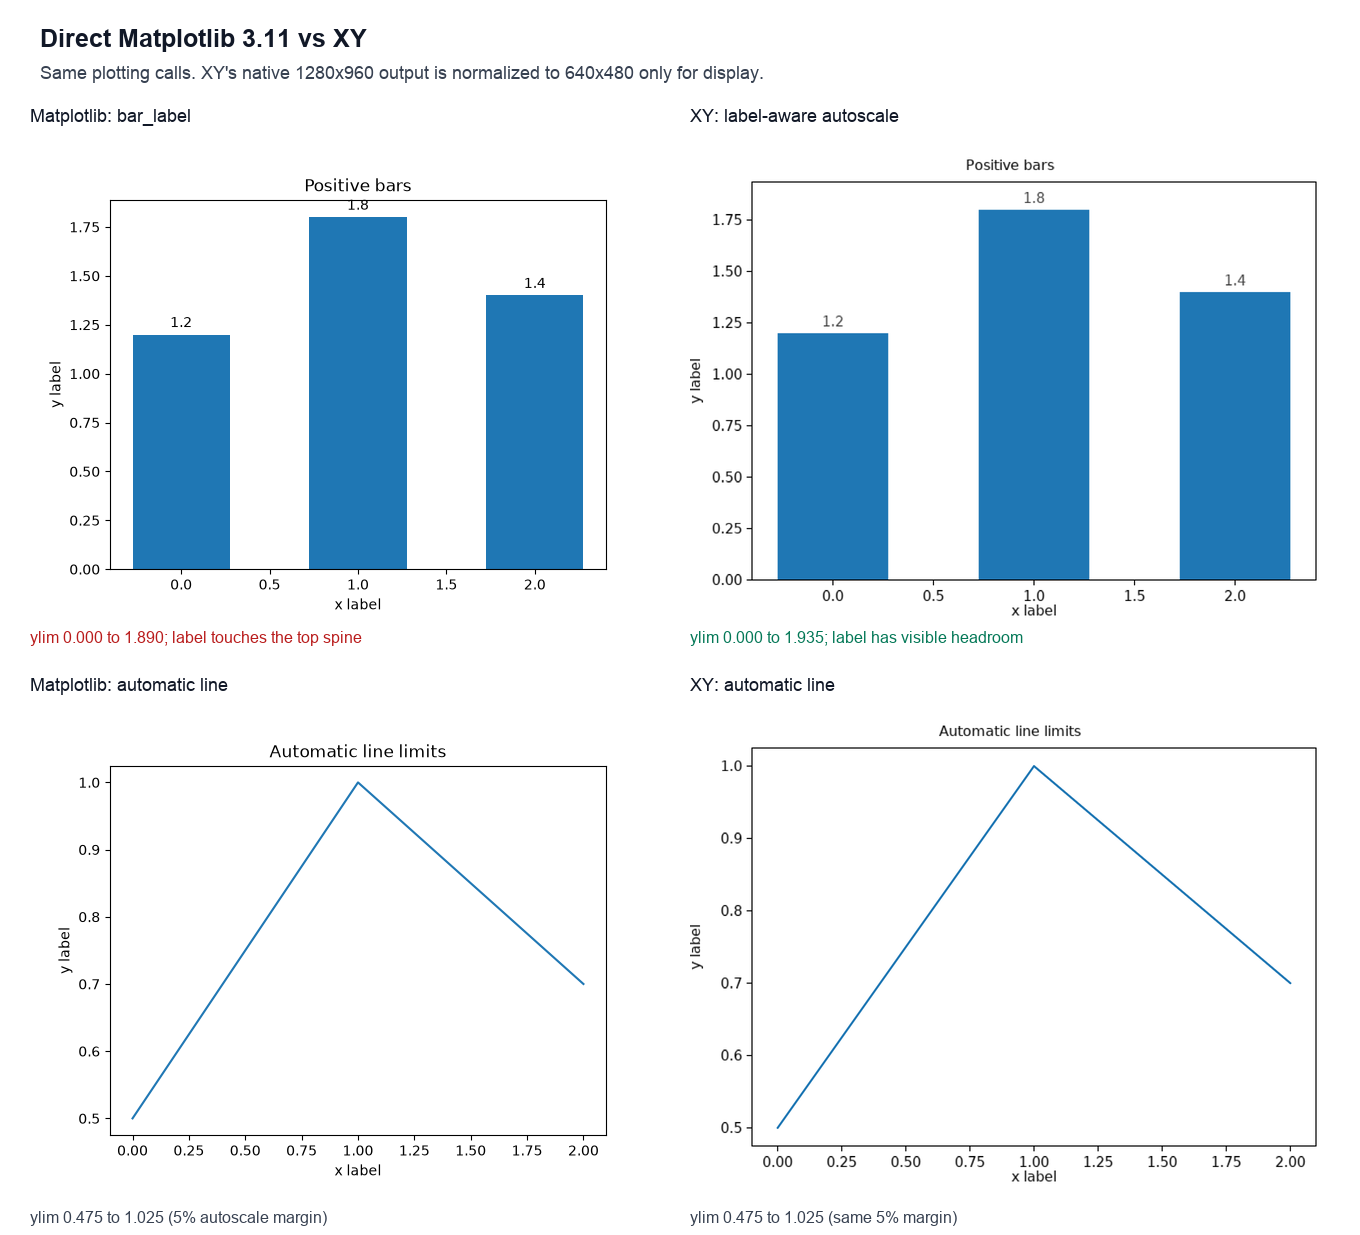
Correction to the earlier visual: that panel compared two XY revisions, not Matplotlib directly. This one renders the same calls in Matplotlib 3.11 and XY:

Direct Matplotlib 3.11 versus XY comparison

What the Matplotlib source and direct measurements show:

  • General autoscaling is a transformed data-span margin (delta = span * margin), with the default axes.xmargin / axes.ymargin set to 0.05. The automatic line example therefore has the same 0.475..1.025 limits in both implementations.
  • bar_label creates an Annotation in offset points; its text bbox does not enter dataLim. In the exact Matplotlib reference above, the 1.8 bbox reaches about 0.46 px past the top spine.
  • XY now keeps Matplotlib's general 5% autoscale behavior, but raises the automatic value-axis reservation to 7.5% when an edge bar_label is present. That gives the label visible headroom on vertical and horizontal bars. Explicit set_xlim / set_ylim and explicit margins() still take precedence.
  • The default XY PNG is intentionally high-DPI (1280x960 for this 640x480 figure). The image above normalizes it to 640x480 only for same-size viewing; the 2x scale multiplies marks, text, and gaps uniformly and is not the source of the relative margin.

The separate tick-label fix is also included: padding starts after the outward end of the tick, and the browser geometry test measures the requested 5 px gap after a 6 px tick. Validation: 710 passed, 3 skipped, plus the focused browser geometry test.

@greptile-apps greptile-apps Bot left a comment

Copy link
Copy Markdown

Choose a reason for hiding this comment

The reason will be displayed to describe this comment to others. Learn more.

This repository has used its 100 free open-source review credits for this billing period. An organization admin can enable additional billed reviews, or reviews resume next period.

The shared tick-label offset helper derived the spine-to-label gap from tick
geometry unconditionally. Core's default `tick_length` is 0 and there is no
default `tick_label_pad`, so every chart that authored no tick styling had its
tick labels pulled toward the spine — a layout change core users did not ask
for. Pyplot was unaffected because it always supplies mpl's tick size and pad
from rcParams.

Gate the derived geometry on whether the axis actually authored
`tick_length`/`tick_label_pad`, and give each renderer its own per-side
unauthored default, chosen so an unstyled chart reproduces the previous
placement exactly: 16/7/8 px (bottom/top/y) plus a flat 4 px y baseline nudge in
the SVG exporter, 15/7/8 plus 4 in the native raster, and 6/18/8 in the browser
client. Those gaps were already asymmetric per side, so per-side defaults are
the existing contract rather than an approximation. Whole-file SVG strings and
whole rasterized RGBA frames now match the pre-`tick_label_pad` output byte for
byte for unstyled charts, including top/right sides, non-default tick fonts, and
staggered label rows. The authored path is untouched, so pyplot spacing is
unchanged.

Pin the geometry in tests on both exporters (real coordinates, not tolerances)
and pin the browser client's per-side defaults at the source, since this suite
has no browser. Document `tick_label_pad` and the two placement regimes in
spec/api/styling.md, and the new `margin` axis option alongside `domain`/`bounds`
in spec/design/pan-and-zoom-configuration.md.
@coderabbitai

coderabbitai Bot commented Jul 24, 2026

Copy link
Copy Markdown

Important

Review skipped

Draft detected.

Please check the settings in the CodeRabbit UI or the .coderabbit.yaml file in this repository. To trigger a single review, invoke the @coderabbitai review command.

⚙️ Run configuration

Configuration used: defaults

Review profile: CHILL

Plan: Pro Plus

Run ID: 49ce66aa-eac9-49e3-8a9d-de5da1aeed2b

You can disable this status message by setting the reviews.review_status to false in the CodeRabbit configuration file.

Use the checkbox below for a quick retry:

  • 🔍 Trigger review
✨ Finishing Touches
🧪 Generate unit tests (beta)
  • Create PR with unit tests
  • Commit unit tests in branch agent/fix-pyplot-autoscale-margins

Comment @coderabbitai help to get the list of available commands.

Sign up for free to join this conversation on GitHub. Already have an account? Sign in to comment

Labels

Projects

None yet

Development

Successfully merging this pull request may close these issues.

1 participant