-
Notifications
You must be signed in to change notification settings - Fork 3
Markers Clustering
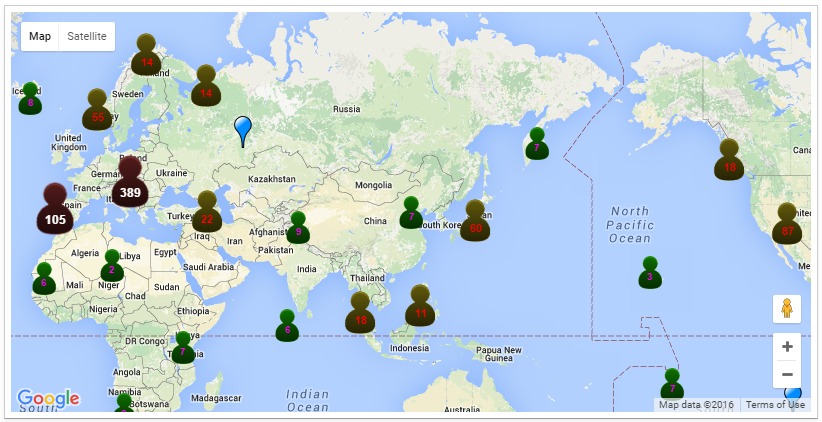
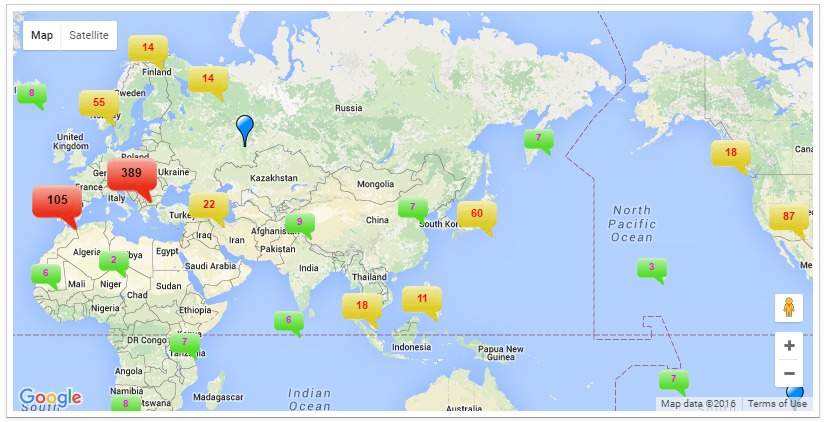
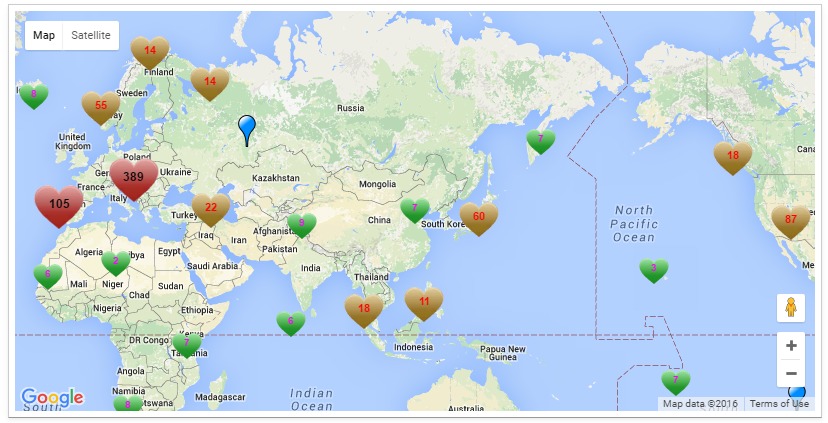
Sometimes you need to display a large number of locations or markers. Naively plotting thousands of markers on a map can quickly lead to a degraded user experience. Too many markers on the map cause both visual overload and sluggish interaction with the map. To overcome this poor performance, clustering simplifies your data visualization by consolidating data that are nearby each other on the map in an aggregate form. A cluster is displayed by an icon with a number of items inside the cluster.
This mode mimics standard behavior of the original Map widget. You don't have any control of the clustering here. The result will look as follow:
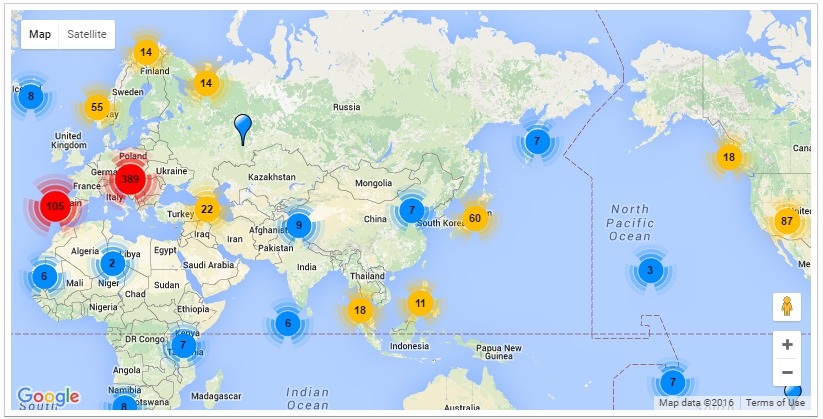
This mode provides a full control of clustering. We use a grid-based clustering algorithm. It's possible to define the grid size, max zoom level and minimum number of markers that are allowed to form a cluster. The screenshot is below:
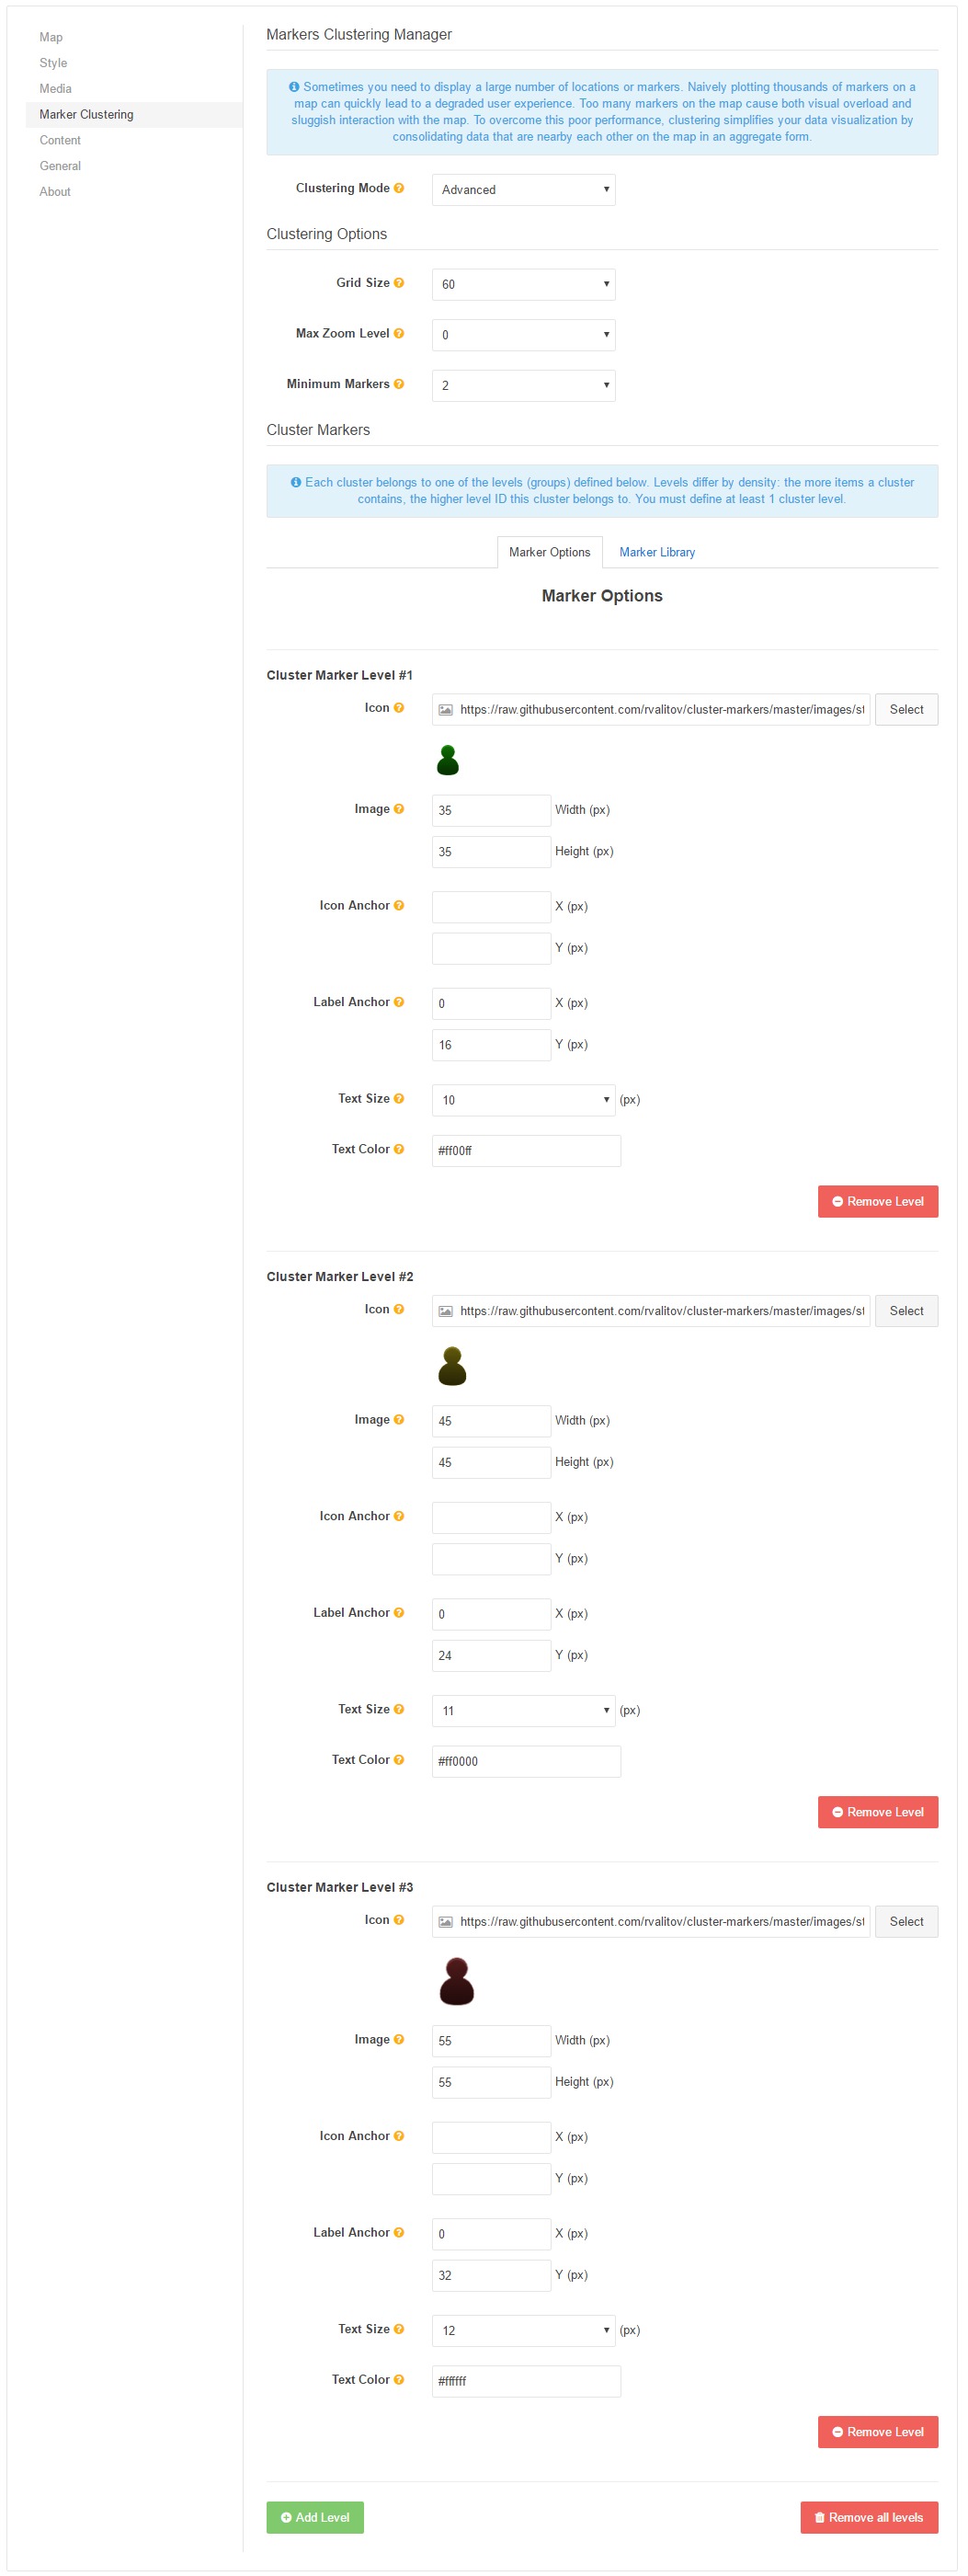
Marker options define cluster levels (groups) that differ from each other by density: a cluster with more items inside of it has a higher level ID. And every cluster belongs to a definite cluster level. For example, in case of 3 cluster levels the algorithm works as follows for every cluster:
- if a cluster has a few items, then it uses settings for Cluster Level #1.
- if a cluster has a medium number of items, then it uses settings for Cluster Level #2.
- if a cluster has many items, then it uses settings for Cluster Level #2.
You can specify any number (minimum 1) of cluster levels, each cluster level can have unique settings:
- Icon
- Image's anchor (hotspot location)
- Anchor of the label
- Text size in pixels
- Text color
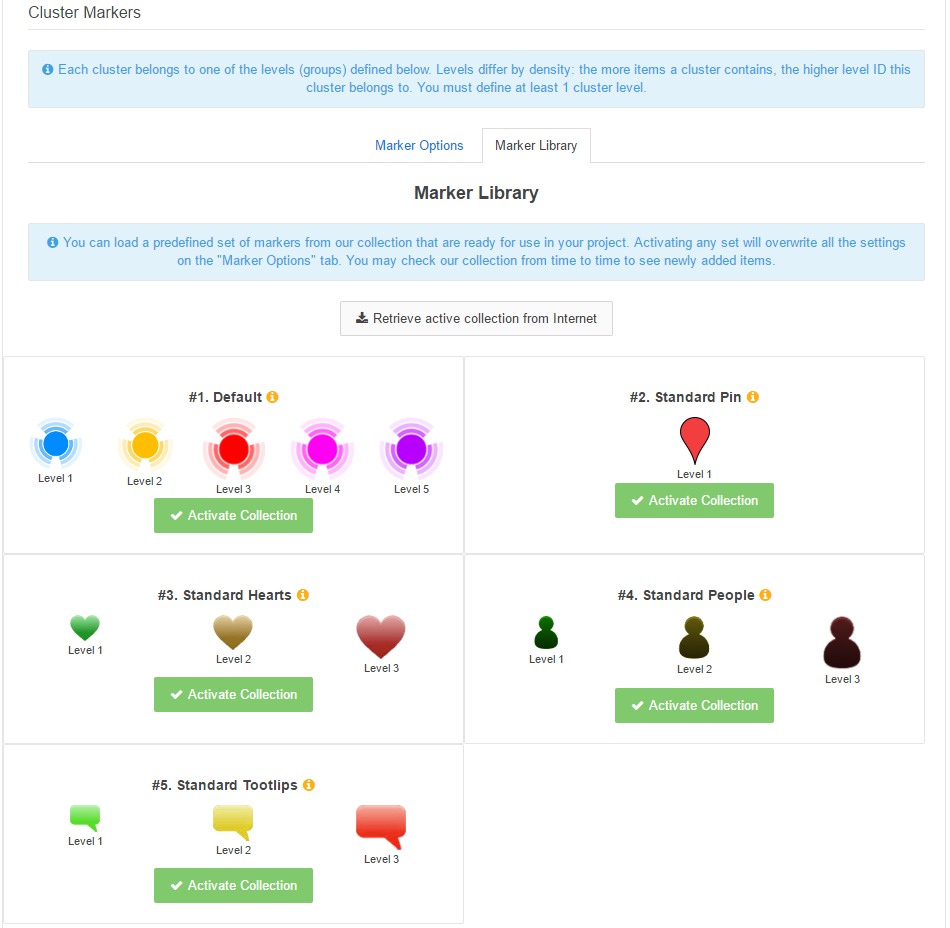
The MapEx widget grants you access to the Marker Library - it's a collection of ready to use icons and related settings for clustering. This is online library that was created as a child project for MapEx, and it is also open-source and publicly available on GitHub, so you may contribute and add your own content if you like. Every time you access the library via the MapEx widget, it updates the information from the server, always providing you with up-to-date set of markers. Such approach allows you to see and use the new markers as soon as they appear in the library. The screenshot of the Marker Library:
Below are some examples of using different markers for clustering.
