@fidelram
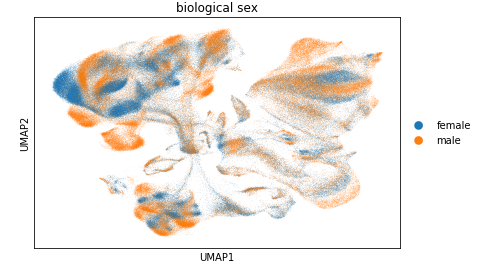
It looks like the automatic point size selection for scatter plots has changed. Personally, I found the previous method more useful as I'm now getting more overplotting issues. For example, here are two plots made with the command sc.pl.umap(bm, color="biological_sex"), in different versions of scanpy:
Old result (at or before 1ec7af2):
Current result (at 94c3dc5):
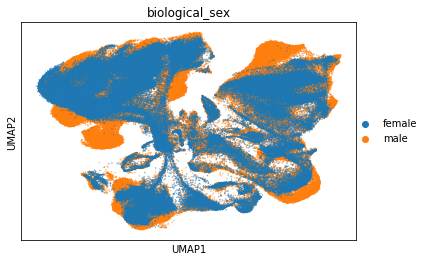
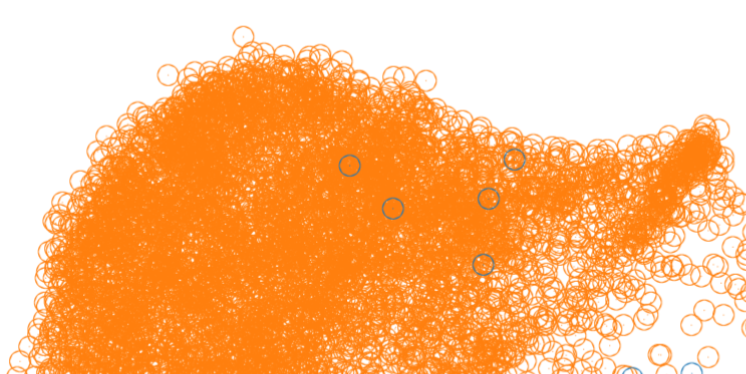
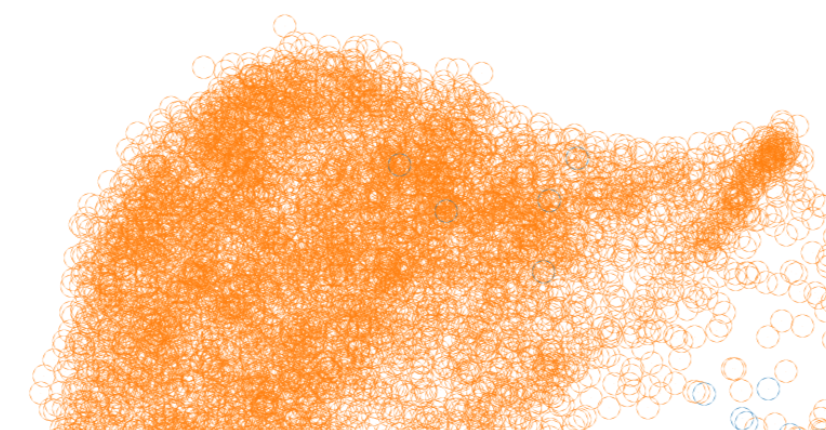
I suspect difference in marker used is related to this. While scatter points were previously points, it seems like they are circles now. Setting the size just seems to make the width of line for each circle decrease. For example, here's a close up of a plot from the current version with size=0.01 and size=0.001 respectively:

@fidelram
It looks like the automatic point size selection for scatter plots has changed. Personally, I found the previous method more useful as I'm now getting more overplotting issues. For example, here are two plots made with the command
sc.pl.umap(bm, color="biological_sex"), in different versions of scanpy:Old result (at or before 1ec7af2):
Current result (at 94c3dc5):
I suspect difference in marker used is related to this. While scatter points were previously points, it seems like they are circles now. Setting the size just seems to make the width of line for each circle decrease. For example, here's a close up of a plot from the current version with
size=0.01andsize=0.001respectively: