Repository navigation
Style Area
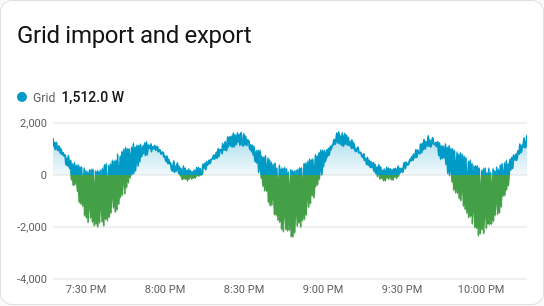
A line chart filled underneath, so an amount reads at a glance: solar through the day, the house's power use, or grid import and export either side of zero. It is a history chart like Line, and shares its period, calendar spans, previous and next buttons, grouping, statistics, axes, hover readout and compact layout.
Power and energy, where the area under the line is the point: solar, consumption, import and export, or several sources stacked into a total.
type: custom:chartdeck-card
style: area
title: Grid
period:
  calendar: day
entities:
  - entity: sensor.grid_power
    name: Grid
    negative_color: green
To use this style, set style: area (or pick Area under History charts in the editor's Style section). The chart options are in the editor's Chart section; the per-entity options are in each entity's options.
The fill is a soft gradient, strongest at the top of the plot and fading towards the zero line. Below zero it fades the other way. An entity's negative_color (a palette name or any CSS colour) colours the part below zero, fill and outline both. That suits export in green under import in blue. Without it, the area keeps one colour on both sides.
An area whose readings come down near zero stands on zero, rather than on a rounded step below it. Readings far from zero, like a room at 18–22 °C, keep an axis fitted to them. y_min and y_max always win.
Readings are placed by time, so sensors that update irregularly are fine. A stretch where a sensor was unavailable leaves a gap in the fill and the outline.
stack: normal # none (default), normal or percent-
nonedraws each series from zero, overlapping. -
normalpiles the series up, so the top edge is their total. -
percentscales every moment to 100 %, so each layer shows its share.
When stacked, the series are compared at every moment any of them changed (a value holds until its next reading). Positive values stack up from zero and negative ones down from it, so export never cancels import. The hover readout puts each dot on its own layer and adds a Total row; in percent mode it also shows each share.
-
curve:smooth(the default),straightorstep, on the card or per entity. -
line_width: the outline's width in px (2 by default), on the card or per entity. -
dots: trueputs a dot at each reading. - Per entity:
color,dashandon_topwork as on the line chart.
The period, calendar spans, grouping, source, axes, gridlines, hover and compact layout are the same as on the line chart. See Line for each one.
Layout: one chart for the whole card. Every shared option is described on the Options page.
Previous: Line · Next: Column · All styles