Repository navigation
Style Column
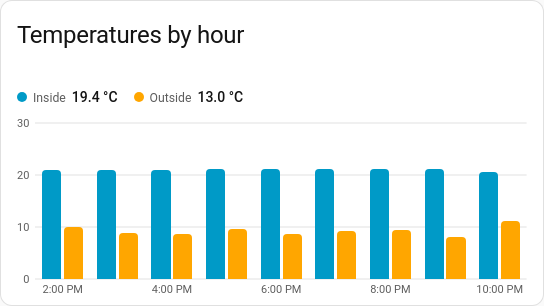
Vertical columns over time: energy used per day, rain per hour, hours of heating per day. It is a history chart like Line, and shares its period, calendar spans, previous and next buttons, statistics, axes, hover readout and compact layout.
Totals and averages per hour, day, week or month, especially from meters that count up (energy, water, gas, rain).
type: custom:chartdeck-card
style: column
title: Energy per day
entities:
  - sensor.house_energy
That's all it needs. With no options the chart shows the last 7 days, one column per day, each showing how much the meter rose that day.
To use this style, set style: column (or pick Column under History charts in the editor's Style section). The chart options are in the editor's Chart section.
-
Period: the last 7 days when
periodisn't set. -
Grouping (
group_by: auto, the default) picks a size for the span: hours up to two days, days up to two months, then weeks, then months. Today is grouped by hour, a week or a month by day, and a year by month. Setgroup_bytohour,day,weekormonthto choose it yourself, ornonefor one column per reading. -
Combining (
aggregate: auto, the default): when every entity is a meter (state_classoftotalortotal_increasing) each column shows how much it rose (change); otherwise it shows the average. Anyaggregatefrom grouping can be set instead.
stack: normal     # none (default), normal or percent
labels: true      # the value on top of each column
rounded: true     # rounded outer ends (default)
range: false      # each column from the group's lowest to its highest
color_by: series # series (default) or bands- Several entities sit side by side in each group, unless they are stacked.
-
stack: normalpiles the entities up into one column;stack: percentscales each column to 100 %. Positive values stack up from zero and negative ones down from it. -
Negative values hang below zero, and the value axis always includes zero (with
range, it fits the spread instead). -
labels: trueputs each column's value on top (a stack's total). Labels are left off when the columns are too narrow for them, or when there are more than 60. -
roundedrounds each column's outer end. The columns are drawn over the plot rather than inside its stretched drawing, so corners stay round at any width. -
range: truedraws each column from the group's lowest reading to its highest, with the average marked across it: a day's temperature spread, for instance. From statistics it asks the recorder for the min and max; from history it takes the spread of the values held in each group. -
color_by: bandscolours each column by the colour band its value falls in. - An entity's
target(from the Limits section) is drawn as a line across each of its columns. - Per entity,
colorsets the column colour.
When grouped, the time axis puts one label under each group (Mon, Tue… or 26 Oct, or Oct, Nov), every second or third when they wouldn't all fit. The hover readout names the whole group ("26 Oct – 1 Nov") and highlights it.
The period, calendar spans, source, axes, gridlines, hover and compact layout are the same as on the line chart. See Line for each one.
Layout: one chart for the whole card. Every shared option is described on the Options page.
Previous: Area · Next: Combined · All styles