Repository navigation
Style Combined
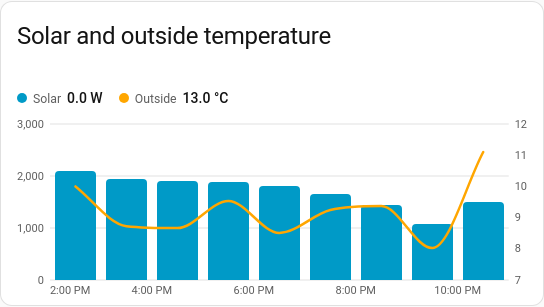
Lines, columns and areas on one time axis, with a second value axis on the right when the units differ: daily energy as columns with the day's average temperature as a line, or power as an area with the electricity price as a line. It is a history chart like Line, and shares its period, calendar spans, previous and next buttons, statistics, axes, hover readout and compact layout.
Two related measurements in different units that only make sense together: energy and temperature, power and price, rain and soil moisture.
type: custom:chartdeck-card
style: combined
title: Energy and temperature
period:
  last: 14
  unit: day
entities:
  - entity: sensor.house_energy
    type: column
  - entity: sensor.outside_temperature
    type: line
To use this style, set style: combined (or pick Combined under History charts in the editor's Style section). The chart options are in the editor's Chart section; type, y_axis and the rest are in each entity's options.
entities:
  - entity: sensor.solar_power
    type: area            # line (default), column or area
    y_axis: left          # left or right; leave out to choose automatically
    aggregate: mean       # how this entity is combined when grouped
negative_color: green # areas: colour below zero-
typedraws the entity as aline(the default),columnorarea(Draw as in the editor). -
y_axisputs it on theleftorrightvalue axis (Value axis). Left out, the first entity's unit goes on the left and any other unit on the right. If nothing ends up on the left, everything moves there. -
aggregatesets how this entity is combined when the chart is grouped (Combine with), so a meter's change can sit next to a temperature's average. Left out, a meter shows its change and anything else its average. -
color,curve,line_width,dashandnegative_colorwork as on the line and area charts.
- Areas are drawn at the back, then columns, then lines on top. Areas and columns stand on zero.
- The right axis has its own round steps; gridlines follow the left axis.
y_minandy_maxfix the left axis only. - With any columns and no
group_by, readings are grouped to suit the span, as on the column chart. Every series is then drawn at the middle of its group, so a line runs across the centres of the columns. - With
source: statistics, all series are loaded from one statistics column, so the card'saggregateapplies to every entity. - The hover readout lists every series, with the dots on lines and areas placed on their own axis, and names the whole group when grouped.
curve, line_width and dots set the defaults for lines and areas; rounded (on by default) rounds the columns' tops. The period, calendar spans, grouping, axes, gridlines, hover and compact layout are the same as on the line chart. See Line for each one.
Layout: one chart for the whole card. Every shared option is described on the Options page.
Previous: Column · All styles