Repository navigation
Style Line
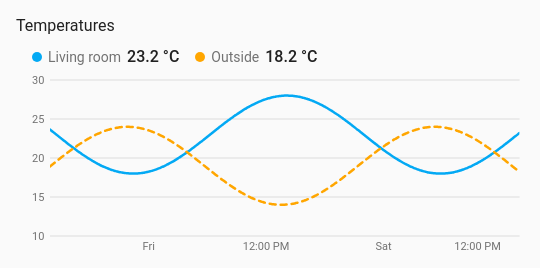
The first history chart. It draws how one or more sensors changed over a period, from the recorder's history or its long-term statistics. Above the chart sits a row with each entity's colour, name and current value; tapping a name opens the entity, as on the other styles. Hovering over the chart, or dragging a finger across it, shows every series' value at that moment.
Temperatures, humidity, power, prices: anything where the shape over the last hours or days matters more than the number right now.
type: custom:chartdeck-card
style: line
title: Temperatures
period:
  last: 2
  unit: day
entities:
  - entity: sensor.living_room_temperature
    name: Living room
  - entity: sensor.outside_temperature
    name: Outside
    dash: true
    line_width: 4
    on_top: true
To use this style, set style: line (or pick Line under History charts in the editor's Style section). Everything below is in the editor's Chart section; the per-entity options are in each entity's options.
How far back the chart looks: last (a whole number, 1 or more) and unit (hour, day, week or month). The default is the last 24 hours (the column chart's is the last 7 days). The chart keeps moving: new states are added as they arrive, without polling, and loading pauses while the card is off screen.
period:
  last: 7
  unit: day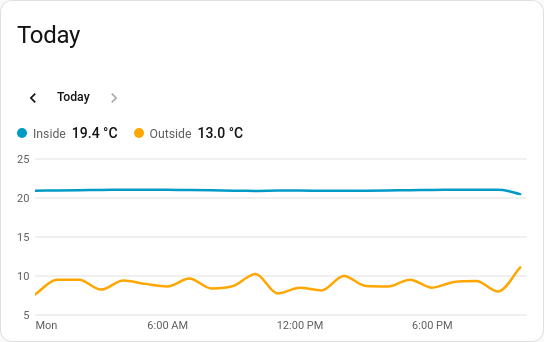
Instead of a rolling span, a chart can show a calendar span: today, this week, this month or this year. It can also show an earlier one, and put previous and next buttons on the card.
period:
  calendar: week   # day, week, month or year
  offset: 1        # the same span this many spans ago: last week
  until: now       # current span only: draw to now (default) or to its end
navigate: true # previous / next buttons, and one back to the current span-
calendarisday,week,monthoryear. With it set,lastandunitare ignored. A day runs midnight to midnight, so a day with a clock change is 23 or 25 hours long. -
offset(a whole number, 0 by default) steps back that many spans:calendar: daywithoffset: 1is yesterday. It works on a rolling span too: the last 24 hours withoffset: 1is the 24 hours before those. -
untilonly matters for the current calendar span.now(the default) ends the chart at the present moment;enddraws the whole span, leaving the part still to come empty. Earlier spans always run to their end. -
navigate: trueadds ‹ and › buttons and a third button named after the card's own span (Today, This week…) to return to it. Next stops at the present. The position isn't saved to the card's config: reloading the dashboard, or editing the period, returns to the configured span.
Days, weeks, months and years follow the time zone setting in your Home Assistant profile: the server's zone when the profile says so, otherwise the browser's. Weeks start on the first weekday set in the profile, or the language's, or Monday.
A span that is wholly in the past is loaded once and stays as it is. The current span keeps moving as new states arrive.
In the editor: Chart section, Period (The last…, Today, This week, This month, This year), then either Show the last and Unit, or Draw up to; then Periods back and Show previous and next buttons.
A chart can combine its readings into one value per hour, day, week or month before drawing, so a line shows the daily average or each day's energy instead of every change.
group_by: day       # hour, day, week or month
aggregate: change # mean (default), sum, min, max, first, last or change-
mean: the average, weighted by how long each value held. History records changes rather than regular samples, so a burst of changes doesn't outweigh a long steady stretch. Home Assistant's own statistics average the same way. -
minandmax: the lowest and highest values in the group, including the one carried in from before it. -
firstandlast: the value at the group's start and the last one in it. -
sum: the readings taken in the group, added up. -
change: how much a meter that counts up rose during the group (energy per day, rain per hour). A drop of more than a tenth counts as a reset, and counting starts again from the new reading; smaller drops are treated as noise.
Groups follow the calendar in your Home Assistant time zone, as calendar periods do, and the chart starts where its first group starts: the last 7 days grouped by day begin at midnight. A group with no readings, or one that hasn't started yet, is left as a gap, never drawn as zero. The current group counts up to now.
With source: statistics, the card asks the recorder for the column it needs (change for sum and change, state for first and last, otherwise mean, min or max). When the server's calendar matches the card's (same time zone, weeks from Monday) it asks for rows a whole group long. Otherwise it asks for hourly rows and groups them itself, so a browser in another time zone still gets its own days.
In the editor: Chart section, Group readings by, and Combine with once a grouping is chosen.
history (the default) reads the recorder's state history, every change. statistics reads the long-term statistics, which reach back further than the recorder keeps history but only exist for sensors with a state_class. The statistics period (5 minutes, hourly, daily or monthly) is picked to suit the span.
Gaps where a sensor was unavailable are left as gaps. Long histories are thinned so a wall tablet stays quick.
smooth (the default, never overshooting a reading), straight or step. Set on the card for every line, or on an entity for just that one.
line_width is the line's width in px, from 0.5 to 12 (2.5 by default). dots: true puts a dot at each reading. Both are set on the card and can be overridden per entity. Dots mark real readings only, and are left off a series with more than 200 readings, where they would merge into a thick line.
-
coloris a palette name or any CSS colour. -
dash: truedraws the line dashed. -
on_top: truedraws the line above the others where they overlap. Lines are otherwise drawn in the listed order, so the last is on top. The header and tooltip keep the listed order.
series (the default) gives each line its own colour. bands colours the line by the colour bands, so it changes colour where it crosses a threshold.
labels: true prints the value at each point. A series with more than 40 points gets no labels, since they would overlap.
axis_labels: outside
gridlines:
  horizontal: true
  vertical: false
y_min: 0
y_max: 30- Value labels go up the side in round steps (1, 2 or 5 times a power of ten), with a little headroom above and below the readings.
- Time labels land on round wall-clock times that suit the span: hours (with the day's name at midnight), day names for a week, day and month for longer, months with the year at January. They follow the language, 12/24-hour clock and time zone in your Home Assistant profile, and how many fit follows the card's width.
-
axis_labels:outside(the default) puts the labels beside the plot;insideputs them over its edges. -
x_axis: falsehides the time labels;y_axis: falsehides the value labels. -
gridlines.horizontal(on by default) andgridlines.vertical(off by default) switch the lines across and down the plot. -
y_minandy_maxfix either end of the value scale. A reading past a fixed end is cut off at the plot's edge.y_minmust be belowy_max.
On by default. Moving the pointer over the chart, or dragging a finger across it, shows a guide line with a dot on each series and a box listing the time and every series' value, with the entity's own decimals and unit. An entity with no reading at that moment shows a dash. On touch, sideways drags read the chart while up and down still scrolls the page, and the box stays up for three seconds after the finger lifts.
tooltip: false turns it off (Show values on hover or touch in the editor).
compact: true
header: over-
compact: truecuts the card's padding, tightens the names row, shortens the plot from 180 to 110 px and uses smaller axis text. -
headerplaces the row of names and current values:above(the default),overthe chart's top-left corner on a light wash of the card's background, orhidden. Names over the chart still open their entity on tap. A hidden header leaves nothing to tap, so the entities' tap actions don't apply.
Layout: one chart for the whole card. Every shared option is described on the Options page.
Previous: Arc · Next: Area · All styles