nano‐bench
nano-bench benchmarks and compares multiple functions with bootstrap confidence intervals
and significance testing.
$ npx nano-bench --help
Usage: nano-bench [options] <file> [methods...]

Benchmark and compare code.

Arguments:
  file                               File to benchmark.
                                     If "self", returns its file name to stdout
                                     and exits
  methods                            function names to benchmark; omit to run
                                     all (one name = baseline, no significance
                                     test)

Options:
  -V, --version                      output the version number
  -m, --ms <ms>                      measurement time in milliseconds (default:
                                     50)
  -i, --iterations <iterations>      measurement iterations (overrides --ms)
  --min-iterations <min-iterations>  minimum number of iterations (default: 1)
  -e, --export <name>                name of the export (default: "default")
  -a, --alpha <alpha>                significance level (default: 0.05)
  --correction <method>              post-hoc multiple-comparison correction
                                     (choices: "none", "holm", "bonferroni",
                                     default: "holm")
  -s, --samples <samples>            number of samples (default: 100)
  -p, --parallel                     collect samples in parallel
  -b, --bootstrap <bootstrap>        number of bootstrap samples (default: 1000)
  --seed <seed>                      bootstrap RNG seed (32-bit integer;
                                     default: random)
  --json <file>                      write results to a JSON file
  --label <label>                    free-form run label recorded in the JSON
  -H, --host                         record os.hostname() in the JSON
  --host-name <name>                 record a custom machine name in the JSON
                                     (overrides --host)
  -o, --observe                      emit User Timing marks at phase boundaries
                                     (PerformanceObserver/DevTools)
  -v, --verbose                      show significance test statistics and
                                     critical values
  --histogram                        show a distribution histogram per function
  --chart <type>                     histogram orientation (choices: "columns",
                                     "bars", default: "columns")
  --bins <bins>                      histogram bin count (default: auto, scaled
                                     to samples and terminal size)
  --no-emoji                         use ASCII fastest/slowest markers (F/S)
                                     instead of emoji
  --smoke                            run each function once to verify the
                                     module, then exit (non-zero on failure)
  --self                             print the file name to stdout and exit
  -h, --help                         display help for command
Name one or more functions after the file (the [methods...] argument) to
benchmark just those; omit them to run every function in the export. A single
name runs as a baseline — reported with no significance test.
Pass --smoke to validate a module before a long run: each selected function
is called once (n = 1) and reported ok/failed with a rough duration. The exit
code is non-zero if any function throws or rejects, and the tool exits promptly
even if the module holds live handles (servers, watchers). Measurement and
statistics options are ignored.
Measurement:
-
--samples— number of measurements. Default:100. -
--bootstrap— bootstrap resamples (usually larger than--samples). Default:1000. - Iterations per sample:
-
--ms— measurement time in milliseconds. Default:50.- The tool runs trials to find an iteration count exceeding this time.
- Note: 100 samples at 50ms each takes at least 5 seconds.
-
--min-iterations— minimum iterations per sample. Default:1.
-
--iterations— fixed iteration count, overriding--ms(skips calibration).
-
-
--parallel— collect samples in parallel. Useful for async benchmarks.
Statistics (see Concepts):
-
--alpha— significance level for the confidence interval and tests. Default:0.05(95% CI). -
--seed— pin the bootstrap RNG seed (32-bit integer). If omitted, a seed is generated and recorded in the JSON, so a saved run stays reproducible. -
--correction— post-hoc multiple-comparison correction:none,holm(default), orbonferroni. See Significance and correction below. -
--verbose(-v) — show the test statistic, critical value, and per-comparison α.
Output:
-
--json— write results to a JSON file (see Saving and comparing results). -
--label— free-form run label recorded in the JSON. -
--host/--host-name— record the machine name in the JSON (opt-in). -
--histogram/--chart/--bins— per-function distribution chart (see Distribution histograms). -
--no-emoji— ASCII fastest/slowest markers (F/S) for terminals with shaky emoji widths. -
--observe— emit User Timing marks at calibration and sampling phase boundaries (see User Timing API integration below). Default: off.
Misc:
-
--smoke— run each selected function once to verify the module, then exit (non-zero on failure). -
--export— name of the export to use. Default:default. -
--self— print the script path and exit (for Deno, Bun, etc.).
The file exports an object of functions to benchmark and compare.
By default the default export is used; use --export to select a named export.
Each function takes n, the iteration count (see Concepts for details).
Example — what is the fastest way to concatenate two strings:
export default {
  strings: n => {
    const a = 'a',
      b = 'b';
    for (let i = 0; i < n; ++i) {
      const x = a + '-' + b;
    }
  },
  backticks: n => {
    const a = 'a',
      b = 'b';
    for (let i = 0; i < n; ++i) {
      const x = `${a}-${b}`;
    }
  },
  join: n => {
    const a = 'a',
      b = 'b';
    for (let i = 0; i < n; ++i) {
      const x = [a, b].join('-');
    }
  }
};
n is set by --iterations or determined automatically via --ms.
Shows the effective options followed by the results table.
The run ends with an explicit process.exit(0) once reporting (and the
--json write) completes, so a module holding live handles (servers,
watchers) can't keep a finished run alive — piped output can't stall on a
process that never exits.
Example:
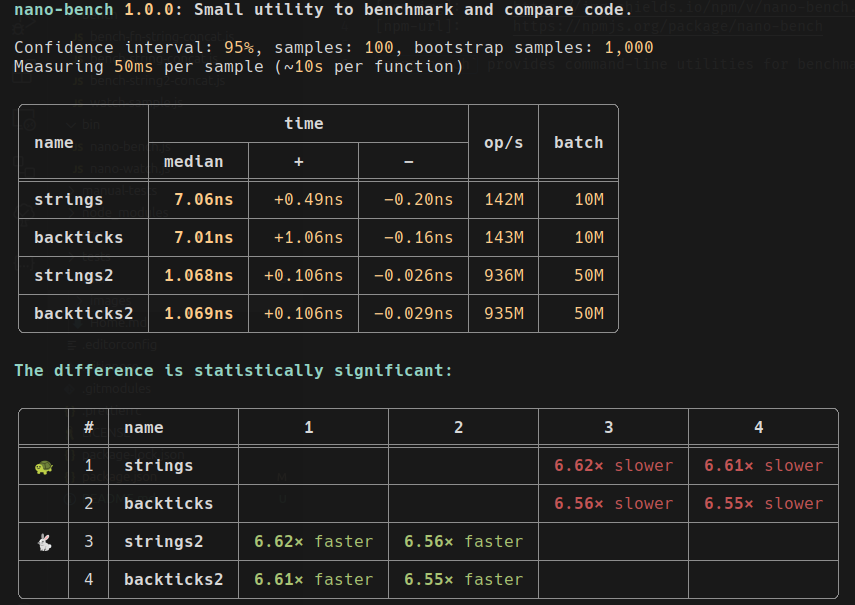
The main table shows measurements and confidence intervals:
-
name— the name of the function. -
median— the median time in milliseconds. -
+and-— the confidence interval in milliseconds. -
op/s— the number of operations per second as an alternative representation ofmedian. -
batch— the number of iterations per sample.
When two or more functions are measured, a Significance: line names the test
(Mann-Whitney U for two functions, Kruskal-Wallis H for three or more), the
α, and the post-hoc method and correction. If the difference is
significant, a matrix follows:
-
#— the 1-based index of the function. -
name— the name of the function.
The N×N matrix shows which pairs differ significantly, with the percentage or ratio difference; the fastest function is marked 🐇 and the slowest 🐢.
For two functions, nano-bench runs the
Mann-Whitney U test
(two-sided, tie-corrected), and reports the effect size next to the verdict:
Cliff's δ
with a magnitude label (negligible / small / medium / large, Romano et al.
thresholds) and its probability-of-superiority reading — how often the
faster function wins a random pair of runs (Vargha-Delaney A₁₂,
derived from the same rank sums, ties half-counted). Significance says a
difference exists; the effect size says whether it is big enough to care. For three or more, it runs the
Kruskal-Wallis H test
omnibus and, if that is significant, a Conover-Iman pairwise post-hoc to find
which pairs differ.
Running many pairwise comparisons inflates the chance of a false "significant".
--correction controls this family-wise error rate over the post-hoc pairs:
-
holm(default) — the Holm step-down procedure; uniformly more powerful than Bonferroni, so it is the default. -
bonferroni— the classic single-step correction; more conservative, kept for familiarity. -
none— uncorrected post-hoc.
The correction touches only the significance test, never the confidence
interval's α. Add --verbose to print the statistic, critical value, and
per-comparison α. See Concepts → Statistics for the
rationale.
A median and confidence interval cannot show multimodality, skew, or outlier
tails (GC pauses, JIT warmup). --histogram draws each function's sample
distribution inline, on a shared range and bin set so the shapes are
comparable:
$ npx nano-bench bench.js --histogram               # vertical columns (default)
$ npx nano-bench bench.js --histogram --chart bars  # horizontal, side by side
$ npx nano-bench bench.js --histogram --bins 24 # override the bin count-
--chart columns(default) stacks per-function histograms as a ridgeline;--chart barslays them out horizontally side by side on a shared vertical axis. -
--bins Noverrides the automatic bin count (which scales with the sample count and is capped to the terminal size). - Each chart marks the median (▾) and mean (▿); a mean sitting where few samples landed prompts a "may be multimodal" nudge. Clamped outliers are reported as a note, not silently dropped.
-
--no-emojiswaps the nudge glyph for terminals with shaky emoji widths.
--json <file> writes the run — raw samples, summaries, parameters, and
environment — to a JSON file. nano-bench-compare
then views or compares saved runs, recomputing significance from the raw
samples (no re-measuring):
$ npx nano-bench bench.js --json before.json --label before
# ...change the code...
$ npx nano-bench bench.js --json after.json --label after

$ npx nano-bench-compare before.json after.json # before/after, paired by name-
--label <text>annotates the run (used as its display name when comparing). -
--hostrecordsos.hostname();--host-name <name>records a custom name. Both are opt-in (the JSON is shareable). -
--seed <n>pins the bootstrap RNG seed; otherwise a seed is generated and recorded, so every saved run reproduces exactly on recompute.
See the nano-bench-compare page for the full comparison workflow (paired vs. pooled, the environment-diff banner).
The --observe flag emits performance.mark and performance.measure entries
at calibration and sampling phase boundaries. Marks are written to the standard
performance timeline and are observable via PerformanceObserver or visible in
DevTools / node --inspect traces — useful for correlating benchmark
variability with GC pauses, V8 optimization events, etc.
Mark and measure names follow the convention nano-bench/<label>/<phase>,
where <label> is the function's exported name and <phase> is one of:
-
find-level— calibration (auto-discovery of batch size). -
series— sequential sample collection (default). -
series-par— parallel sample collection (when--parallelis set).
Each phase produces a start mark nano-bench/<label>/<phase>:start and a
measure nano-bench/<label>/<phase> with the duration.
import {PerformanceObserver} from 'node:perf_hooks';

const obs = new PerformanceObserver(list => {
  for (const e of list.getEntries()) {
    console.log(`${e.name}: ${e.duration.toFixed(2)} ms`);
  }
});
obs.observe({entryTypes: ['measure']});Marks have a small fixed cost per phase (no per-sample overhead), so leaving
--observe on does not affect measurement accuracy. The default is off purely
to keep the perf timeline buffer empty for users who don't need the
integration.
The runner functions exported from nano-benchmark/bench/runner.js
(findLevel, benchmarkSeries, benchmarkSeriesPar, measure, measurePar)
all accept an observe option (boolean | string):
-
false/undefined— no instrumentation (default). -
true— emit marks with the default label"default". - string — emit marks with the given label.
import {measure} from 'nano-benchmark/bench/runner.js';

const fn = n => {
  let s = 0;
  for (let i = 0; i < n; ++i) s += i;
};
const stats = await measure(fn, {nSeries: 50, observe: 'sum-loop'});
measure / measurePar thread the option through to their inner findLevel
and benchmarkSeries(Par) calls, so a single observe argument produces both
calibration and sample-collection entries.
Use --self to get the script path for running with alternative interpreters:
$ npx nano-bench benchmark.js
$ bun `npx nano-bench --self` benchmark.js
$ deno run --allow-read --allow-hrtime `npx nano-bench --self` benchmark.js
$ deno run -A `npx nano-bench --self` benchmark.js
$ node `npx nano-bench --self` benchmark.js