nano‐watch
nano-watch continuously benchmarks a single function, showing live statistics and memory usage.
$ npx nano-watch --help
Usage: nano-watch [options] <file> [method]

Continuously benchmark code.

Arguments:
  file                       File to benchmark.
                             If "self", prints its file name to stdout and exits
  method                     Method name to benchmark

Options:
  -V, --version              output the version number
  -m, --ms <ms>              measurement time in milliseconds (default: 500)
  -i, --iterations <number>  number of iterations (default: Infinity)
  -e, --export <name>        name of the export (default: "default")
  --self                     print the file name to stdout and exit
-h, --help display help for command-
--ms— measurement time in milliseconds. Default:500. -
--iterations— number of samples. Default:Infinity.- The table updates after each iteration.
- Stop with Ctrl + C.
-
--export— name of the export to use. Default:default. -
--self— print the script path and exit (for Deno, Bun, etc.).
The optional method argument selects a function from an object export
(see nano-bench file format).
nano-watch accepts the same file format as nano-bench.
Without method, the export must be a function:
export default n => {
  const a = 'a',
    b = 'b';
  for (let i = 0; i < n; ++i) {
    const x = a + '-' + b;
  }
};Prints a live-updating table, refreshed after each measurement (≥ --ms milliseconds).
A bounded run (--iterations) ends with an explicit process.exit(0), so a
module holding live handles (servers, watchers) can't keep a finished run
alive.
Example:
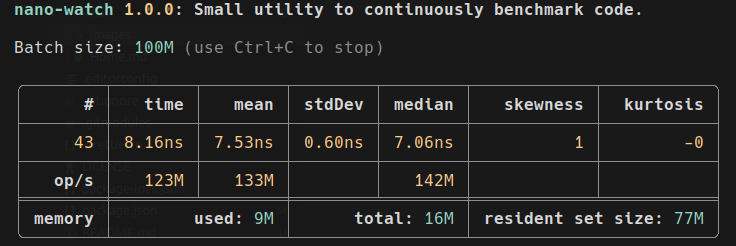
After calibrating the batch size (iterations per call), it displays:
-
#— the iteration number. -
time— the time in milliseconds of the last iteration. - Running statistics:
-
mean— the mean value. -
stdDev— the standard deviation. -
median— the median value. -
skewness— the skewness. -
kurtosis— the kurtosis.- The excess kurtosis is used.
-
-
op/s— the number of operations per second as an alternative representation of time values (time,mean,median). - Memory-related data obtained with process.memoryUsage():
- Used memory in bytes (
heapUsed). - Total memory in bytes (
heapTotal). - Resident set size in bytes (
rss) — total physical memory used by the process.
- Used memory in bytes (
Live updates require a TTY output.
If redirected to a file, only the final table is printed; use --iterations to limit the run.
Use --self to get the script path for running with alternative interpreters:
$ npx nano-watch benchmark.js concat
$ bun `npx nano-watch --self` benchmark.js concat
$ deno run --allow-read --allow-hrtime `npx nano-watch --self` benchmark.js concat
$ deno run -A `npx nano-watch --self` benchmark.js concat
$ node `npx nano-watch --self` benchmark.js concat