Repository navigation
Panel Walkthrough
A quick tour of the WashData panel (sidebar > WashData). The device bar at the top switches appliances; + Add device adds one. Settings are explained on Settings-Visual-Guide.
Tabs: Overview, Cycles, Profiles, Settings, Playground, Store, Advanced. Read-only users see the first three. The gear icon opens Preferences; admins also get Logs (the last 500 WashData log lines).
- Status card: state, power, progress, time remaining and the program's phases. "Paused (Stalled)" means the machine halted on its standby draw, for example on an unbalanced load.
- Program: Auto-detect, or pick the right one (picked while off, it applies to the next cycle). While unsure, WashData shows e.g. "Uncertain: Cotton 40 or Synthetics 30 · ~45% sure".
- Pause / Resume / Force Stop for the running cycle, and a Live Power chart with the program's expected curve in orange.
- Attention cards lead to cycles to review, suggestions, setting conflicts, or a standby draw above the Stop Threshold.
- Device Setup card: the next step for a new device. Manual Recording: press Start just before a program starts and Stop when it ends, to save a clean reference cycle.
Every cycle with program, status, date, duration, energy, cost and confidence. Sort by column, filter by program or status (Completed, Interrupted, Force stopped, Unlabelled, Needs review, Imported). Hover the Flags icons for detail; a cost with a dotted underline is time-weighted.
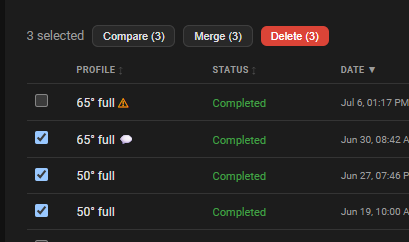
Auto-label cycles names unlabelled cycles that clearly match. Select enables Compare, Merge, Relabel and Delete.
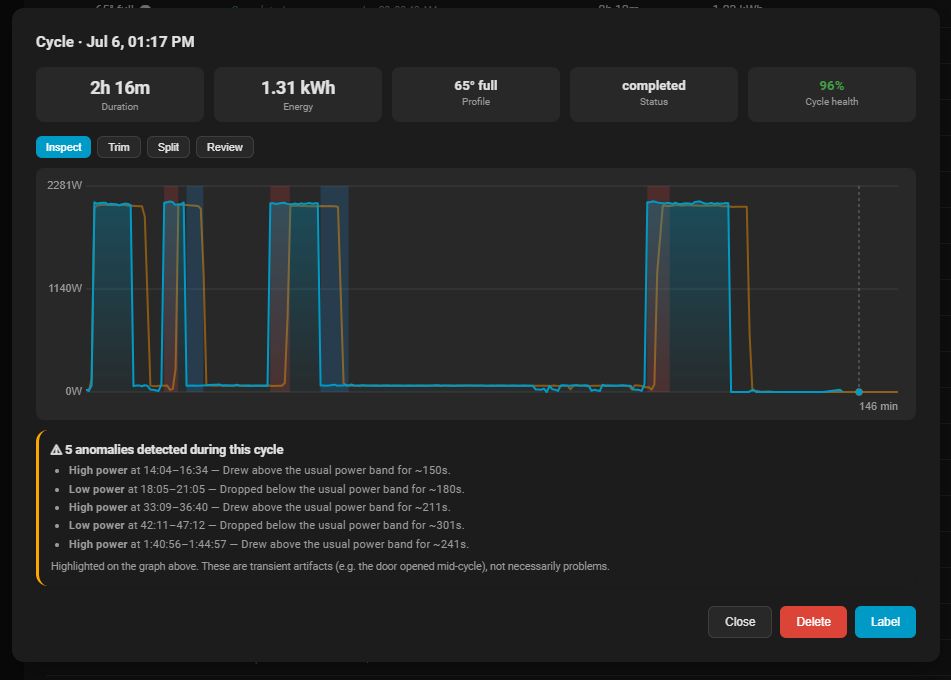
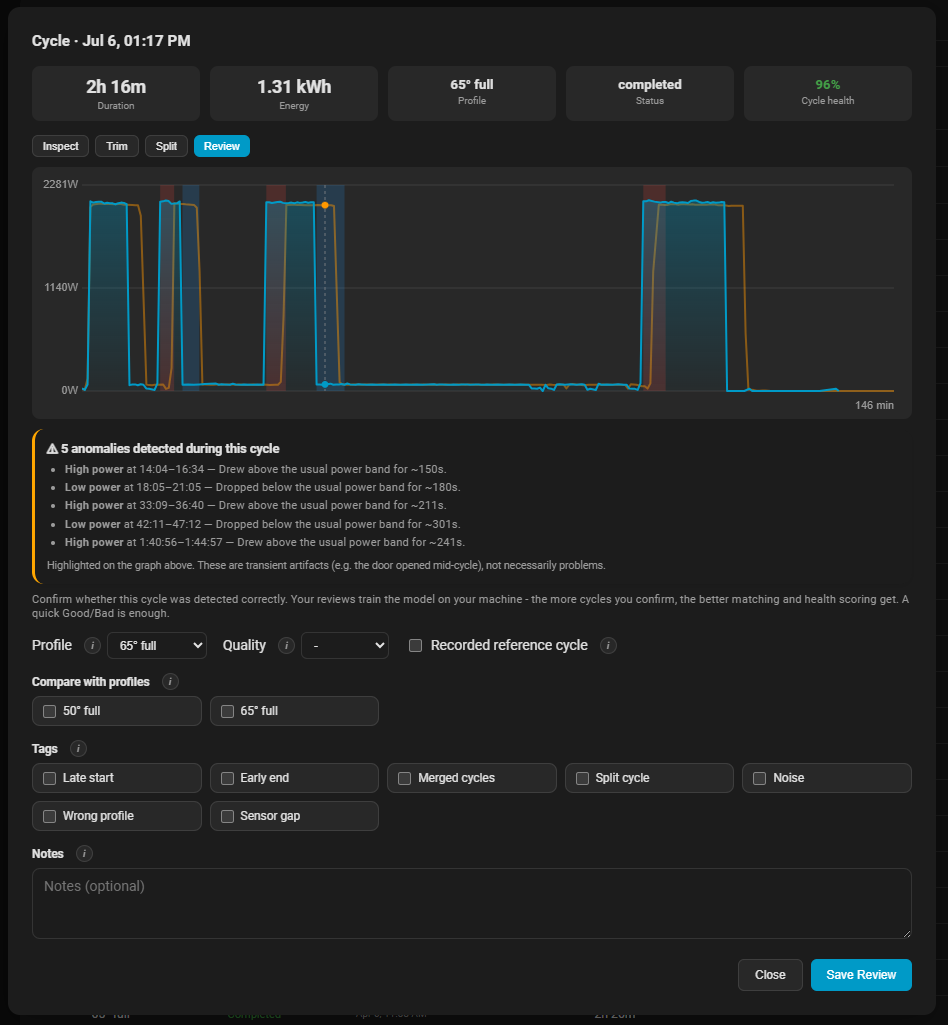
- Inspect: the trace over the program's expected curve, with anomalies (door opened, spikes, dips) and restart gaps shaded and listed. For a cycle waiting for your confirmation it also draws the "(suspected)" program and the "(runner-up)".
- Recorder history around the cycle (Off / 5 / 10 / 30 / 60 min, default 10, per device): the power sensor's own history before and after the cycle, in grey, so you see the idle draw before the start. Display only (duration, energy and matching do not change); it needs the recorder to still hold the data (10 days by default). Curve Pre-roll (Settings > Detection) instead stores pre-start readings in the cycle and changes its duration.
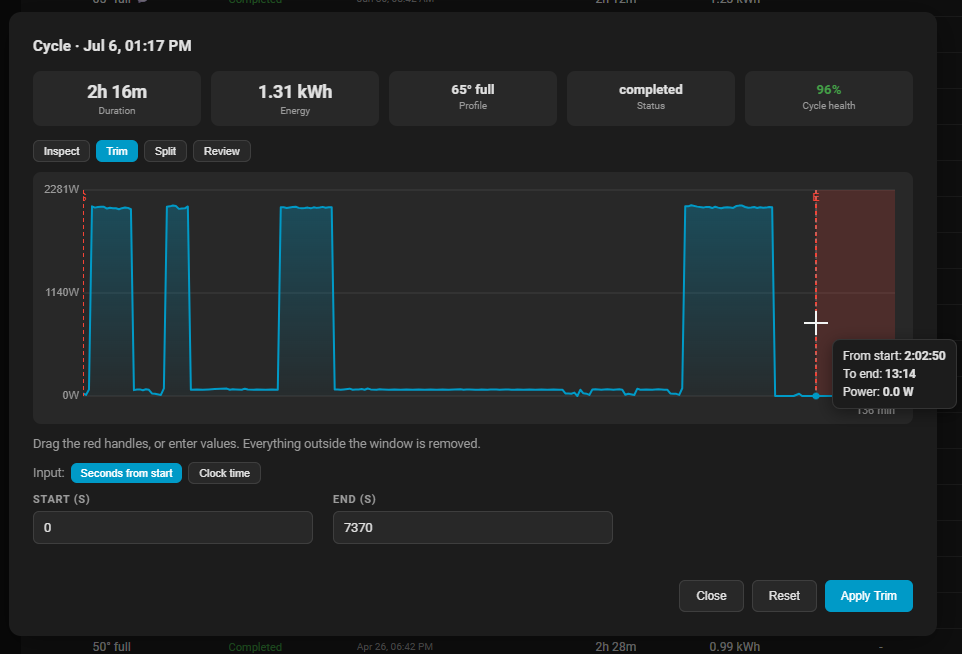
- Trim: drag the red handles or type offsets to cut a late start or a long tail.
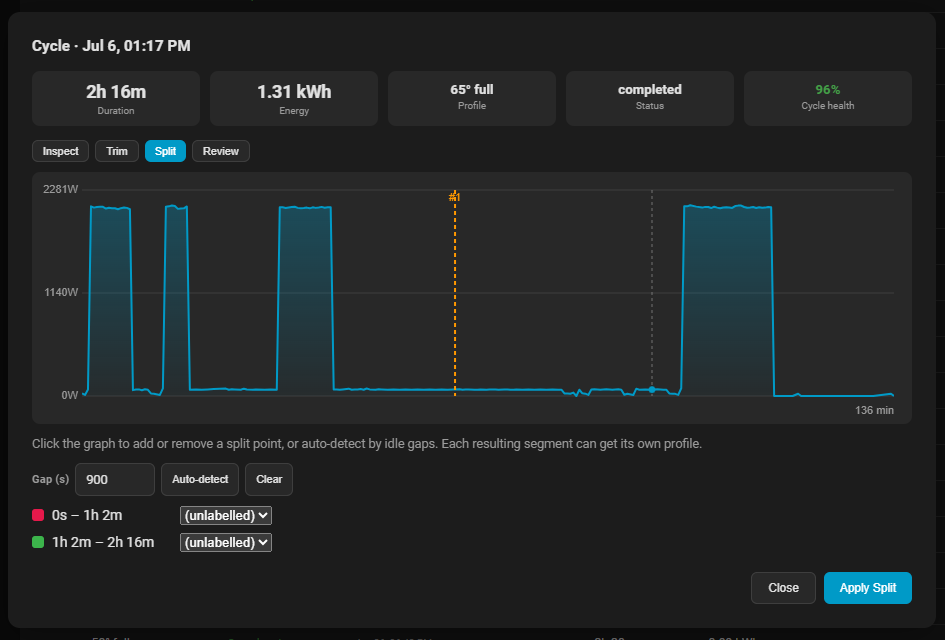
- Split: click to place split points or Auto-detect idle gaps; each part gets its own program.
- Review: correct the program, rate quality (Good / Bad / Unusable), add tags and notes, mark it as a reference cycle, overlay other programs. A correct label is what teaches matching. A cycle waiting for feedback offers Confirm, Correct… or Ignore.
Log servicing and get reminded every N cycles; add your own tasks (every N cycles and/or N days) and log them done in one click. The Maintenance due binary sensor is on while a task is due. The cycle total only goes up; correct it here if needed.
- Cards show cycles, average duration and energy, and badges (poor fit, trending longer or using more energy, still learning, and for store programs how many of your cycles they matched).
- Programs you have not created yet: when recent unlabelled cycles look like one program, a banner offers Create profile with one of them preselected.
- + New Profile, + New Group (near-identical programs, e.g. same wash at another temperature, so matching can tell them apart), Rebuild Envelopes. A device with no programs gets Browse community setups.
- Phase Catalog subtab: the named phases; add your own or reset an edited built-in.
Open a profile:
- Overview: stats, fit, trend, Share to store.
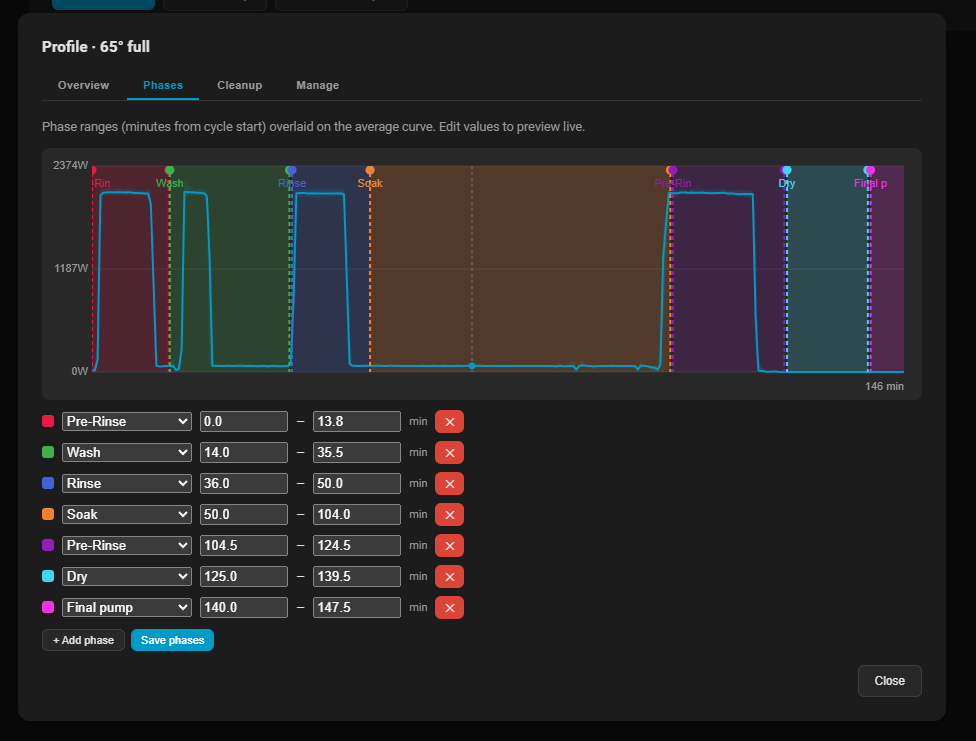
- Phases: map phases to minute ranges. The live phase uses them; outside them it is unknown.
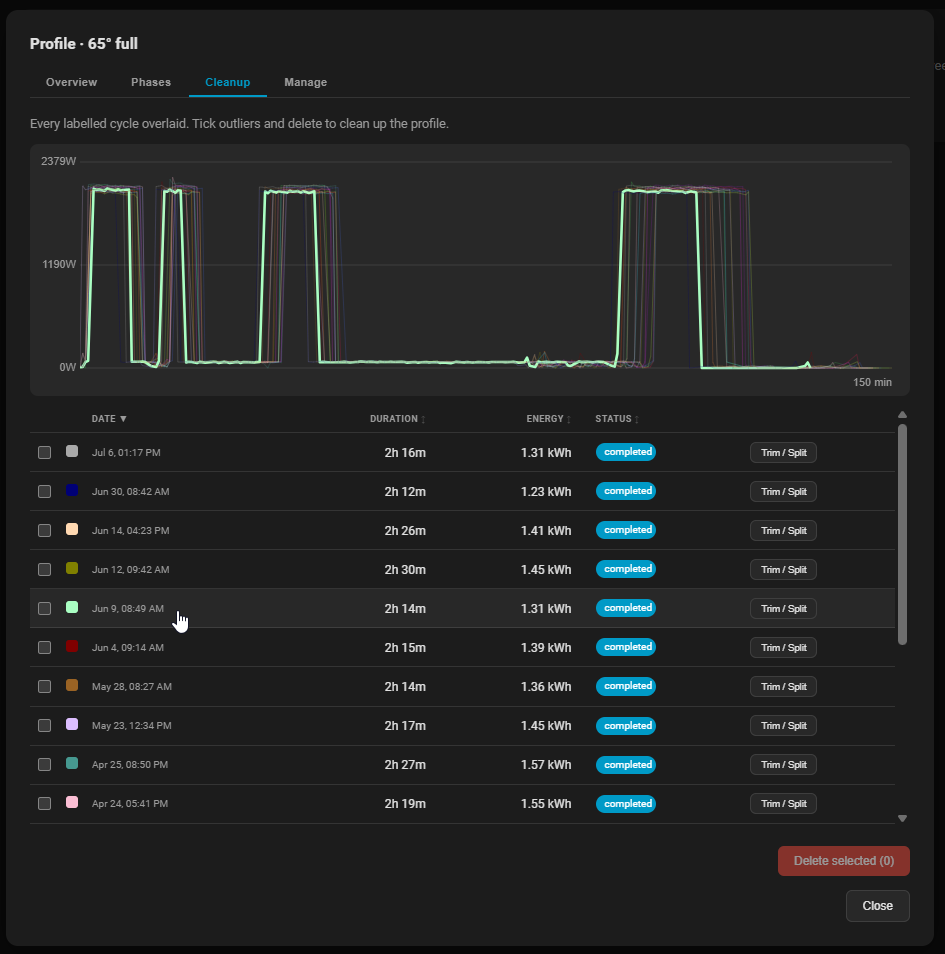
- Cleanup: all labelled cycles overlaid; tick outliers, then Unlabel (kept in history) or Delete.
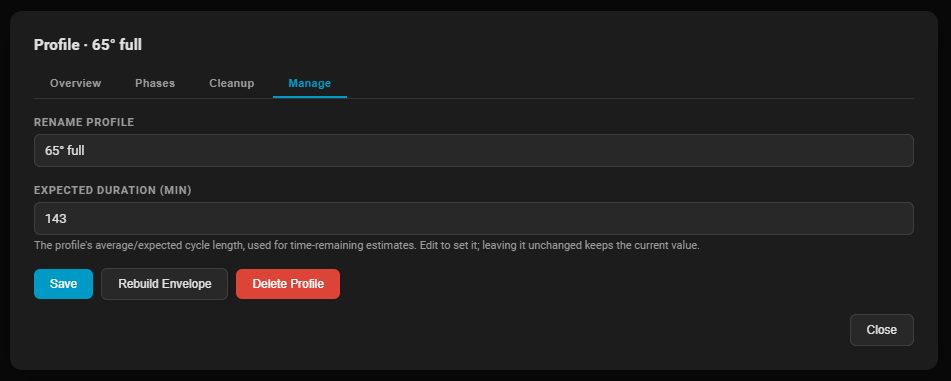
- Manage: rename, expected duration, rebuild envelope, delete.
- Basic / Advanced: Basic shows the essentials (name, type, power sensor, Minimum Power, Off Delay, energy price, notifications, quiet hours); Advanced shows everything.
- Show internal settings (Advanced) reveals low-level tuning such as sampling, watchdog and match cadence. One with its own value, a conflict or a suggestion shows anyway; search always finds it.
- Suggestions: a pill on the field shows the value and what it changes. Use stages it, or stop suggesting it. The banner has Show only, Apply all (previews every change, old to new, before saving) and Dismiss.
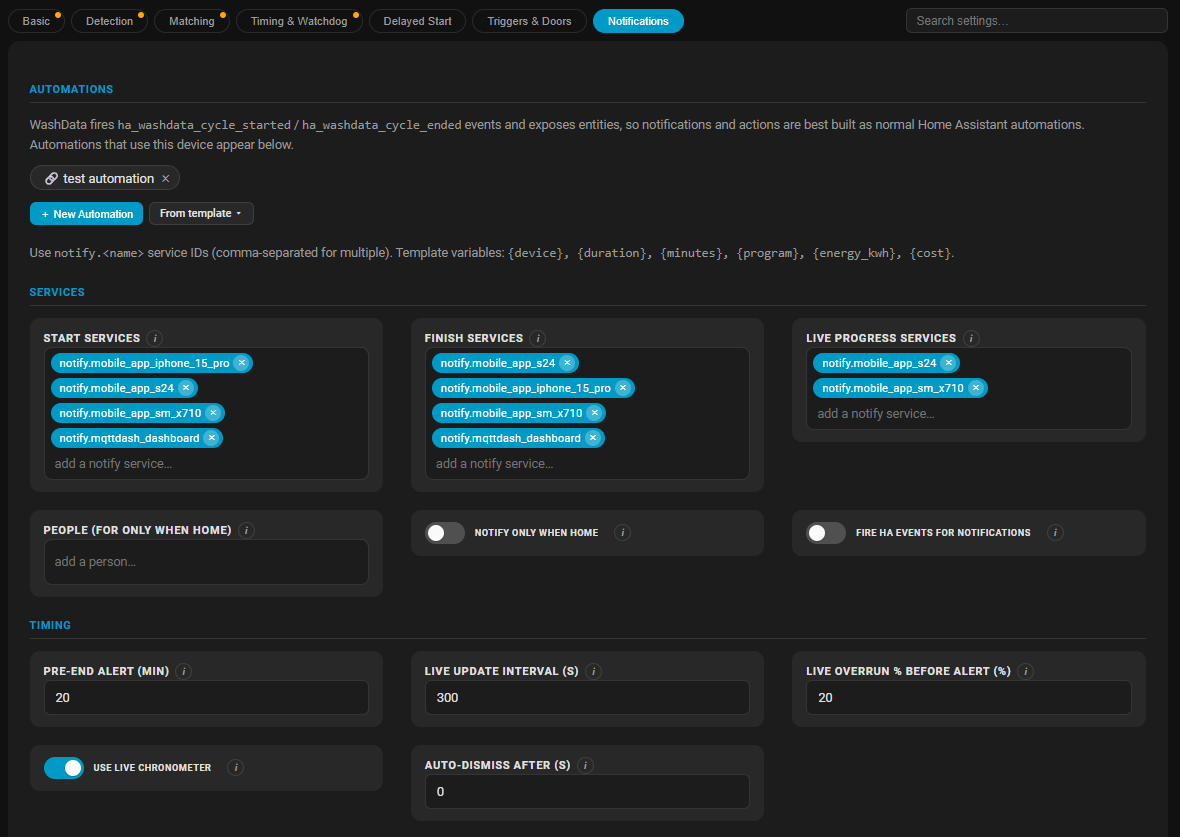
- Energy price and Time-Weighted Cost are under Basic. Notifications: see Notifications-and-Events.
- Save Settings reloads the integration. Revert changes restores the previous save; Settings history lists every change. Leaving with unsaved changes asks first.
Try settings on your own cycles; nothing changes on the device until you publish.
- Simulate: pick a cycle and press Run. The integration's own detector and matcher replay it and show where it ends, the program, whether it would be auto-labelled, and notification markers. Change a setting (or drag its line), then Update simulation; Publish saves a value.
- Test on history: replay your newest cycles (up to 50); see how many were detected and matched correctly. Click a row to load it.
- Optimize: pick a setting and a goal (match accuracy, end delay, early ends, splits, ...). It never recommends a value that ends more cycles early, splits more or misses cycles, and says "keep the current value" when nothing is better. Apply best stages the winner.
Results are a little optimistic: these cycles also built the programs.
Shown when online features are on (Preferences > Online & Community). Search appliances, import shared reference cycles, or Download this setup for your model. See Community-Store.
- Diagnostics: storage stats, Process History (re-run matching, refresh suggestions, recost cycles), Clear Debug Traces, Wipe All Data.
- Export / Import: export everything or chosen data; import picks what to take. Undo last import (admins) restores what the last import replaced. See Export-and-Import.
- Import power history: recover cycles from before WashData, from a file or the recorder.
- ML Training: status, the two switches, schedule, Train now, Reset to built-in models. It trains only the projected-energy model. See ML-Subsystem.
- My Preferences (your account): default tab, date format, language, font size, chart overlays, Live Match Debug card.
- Panel Settings (admins): default tab and tabs hidden from non-admins.
- Access Control (admins): None / Read / Edit / Full per user and device. Off by default.
- Online & Community (admins): online features, GitHub connection, store preferences.
- Settings-Visual-Guide: what each setting does
- Notifications-and-Events: notifications, events, automations
- Export-and-Import: backing up and moving a device
- Community-Store: adopting and sharing setups