UWC User Manual
[TOC]
This manual explains the correct equipment usage procedures for users of the GL controller; it is primarily intended for trained engineers and technicians. Please carefully read this manual to ensure satisfactory and safe usage of the GL controller software and test chamber.
The test chamber should be operated by experienced engineers or persons who have received training in proper usage from an experienced engineer.
Definition of an experienced engineer: A person who understands the purpose of chamber operations and controls; who has received training in the operation method, daily maintenance and inspections, etc.; who can foresee and prevent risks associated with common sources of hazards, such as electricity, etc.
The following safety indications are used throughout this manual. The following table lists different signs that represent the degrees of danger to users.
| DANGER | Means that extremely dangerous consequences may arise, with the risk of death or serious injury to the user, if the chamber is handled improperly. |
| WARNING | Means that extremely dangerous consequences may arise, with the risk of death or serious injury to the user, if the chamber is handled improperly. |
| CAUTION | Means that extremely dangerous consequences may arise, with the risk of death or serious injury to the user, if the chamber is handled improperly. |
The following labels instruct users to take note and to avoid danger.
| PROHIBIT | Means that extremely dangerous consequences may arise, with the risk of death or serious injury to the user, if the chamber is handled improperly. |
| Imperative Action Required | Means that extremely dangerous consequences may arise, with the risk of death or serious injury to the user, if the chamber is handled improperly. |
The following labels indicate information on physical damage and environmental contamination.
| Notice | This mark means dangerous consequences may arise, with the possibility of damage to equipment and facilities or environmental pollution, if the equipment is handled incorrectly. |
The following keywords are used throughout this manual.
| Note | Provides information necessary for gaining full performance from the GL controller system or to prevent damage to the equipment. |
| Procedure | Explains how to operate the GL controller system on a step-by-step basis. |
| Reference | Offers additional information |
| CAUTION |
|---|
|
This equipment is capable of being operated remotely. When operating this equipment in or around the test area, ensure that it is not being remotely operated by LAN or transmitted communication. If there is any chance it is being operated remotely, take necessary precautions to coordinate awareness from all operators locally and remotely. There is a risk of testing starting suddenly during operation and causing injury to the operator. Ensure the equipment clearly displays that it is being operated remotely; and also properly notify the operator. |
This manual was written based on the GL controller with temperature and humidity. Display screens will differ slightly for a model without humidity options. In particular, a model without humidity does not display items related to humidity.
The following figure depicts the standard display of the GL controller with temperature and humidity. The display is provided by the touchscreen monitor (HMI) mounted on the front of the chamber.

The user's manual package that came with the chamber contains the following reference materials. Refer to the appropriate manual according to the required information.
| Manual | Content |
|---|---|
| GL Chamber Manual | Explains the operation and features of the GL test chamber |
| GL Controller Manual | Explains the operation and features of the GL controller system and test chamber (this manual you are reading) |
| GL Controller Communications Manual | Explains the operation and features of the GL controller command instructions and communication interface options |
| GL Chamber Options Manual | Explains optional features of GL test chamber |
This chapter provides an overview of the functions of the GL controller. It covers the specifications and methodologies of the GL controller instrumentation.
The GL controller can operate as a standalone system or both as a standalone and networked system. The following table outlines some notable advantages between these two options. Refer to Chapter 8 for further details.
| Standalone System | Networked System |
|---|---|
| No network connection is required. | GL controller can join DHCP, static or private network. |
| System can operate in complete isolation. | Only authorized users on the network can remotely access and operate the GL controller. |
| The HMI provides complete control and operation of the GL controller and the chamber. | Any web-based device on the network can access the GL controller and its user interface for control and operation. |
| Update or upgrade is provided via USB external port. | Update on the GL controller is provided via Mender IO cloud service, if the GL system has access to the Internet. |
By default, the GL controller operates as a standalone system. Complete control and operation of the instrumentation are achieved via the dedicated HMI on the chamber, as depicted in the following diagram.

When the GL controller is connected to a network, you can use a Web browser to access the GL controller user interface (UI) to control and operate the chamber. The GL controller utilizes a standard Web browser to provide (i.e., host) its UI for control and operation of the instrumentation. Thanks to the ability of a Web browser to operate on any computer (or device) on the network, GL controller operations can be performed remotely by authorized users on the network.
Refer to Section 2.10 on how to enable the GL controller system to allow remote access via a Web Browser on the local network.
Details of the network description, accessibility and configuration are discussed in Chapter 8.
The following figure depicts the GL controller UI on Google Chrome Web browser, accessed via its IP address.

In the GL controller system, there are many ways to accomplish the same task. This feature was purposely designed to provide the operator an alternative or shortcut approach to get to the next task or a different task without having to go through a procedural step. The organization of the instrumentation screen and user interface is outlined as follows.
| Menu | Description |
|---|---|
| Home Page | Display main overview page, menu buttons and operation status |
| Operation Mode | Constant Run: Start, Stop Program Run: Start, Pause, Step, Stop |
| Monitor | Temp/Humi Details Program External Output Trend Graph |
| Set Mode | Constant Setup (No. 1, 2, 3): Equipment Control Options, Refrigeration, Time Signals, Others Program Setup: New PRGM, Import, Export, Copy, Move/Swap, Rename, Edit, Preview, Delete |
| Setup | Set Timers, Set Sampling, Set Protection, Set Defrost, Set Time Meters, Data Download, Firmware History, Alarm/Operation History, ROM/Firmware Information, Configuration, Set Back Trace, Accessory |
Configuration under Setup has its own submenu with extensive options as listed below. Details of these features are discussed in Chapter 7 (Configuration Menu).
| Submenu | Description |
|---|---|
| Configuration | Set Communication, Operation Process, Control Attainment Range, Time Signal Names, Display Setup, Set Language, Set Sound, Macros, Set Date/Time, Users (Register User Password), Sensor Offset (Calibration), Set Chamber Details, Set Option, Email, Service |
Note: The Macros submenu (under Configuration) is not operational on the HMI. It can only be operated remotely and is grayed out on the HMI display. Refer to Section 7.15 for details.
The operating panel is the 10-inch touchscreen HMI that provides the UI for control and operation of the GL controller instrumentation.
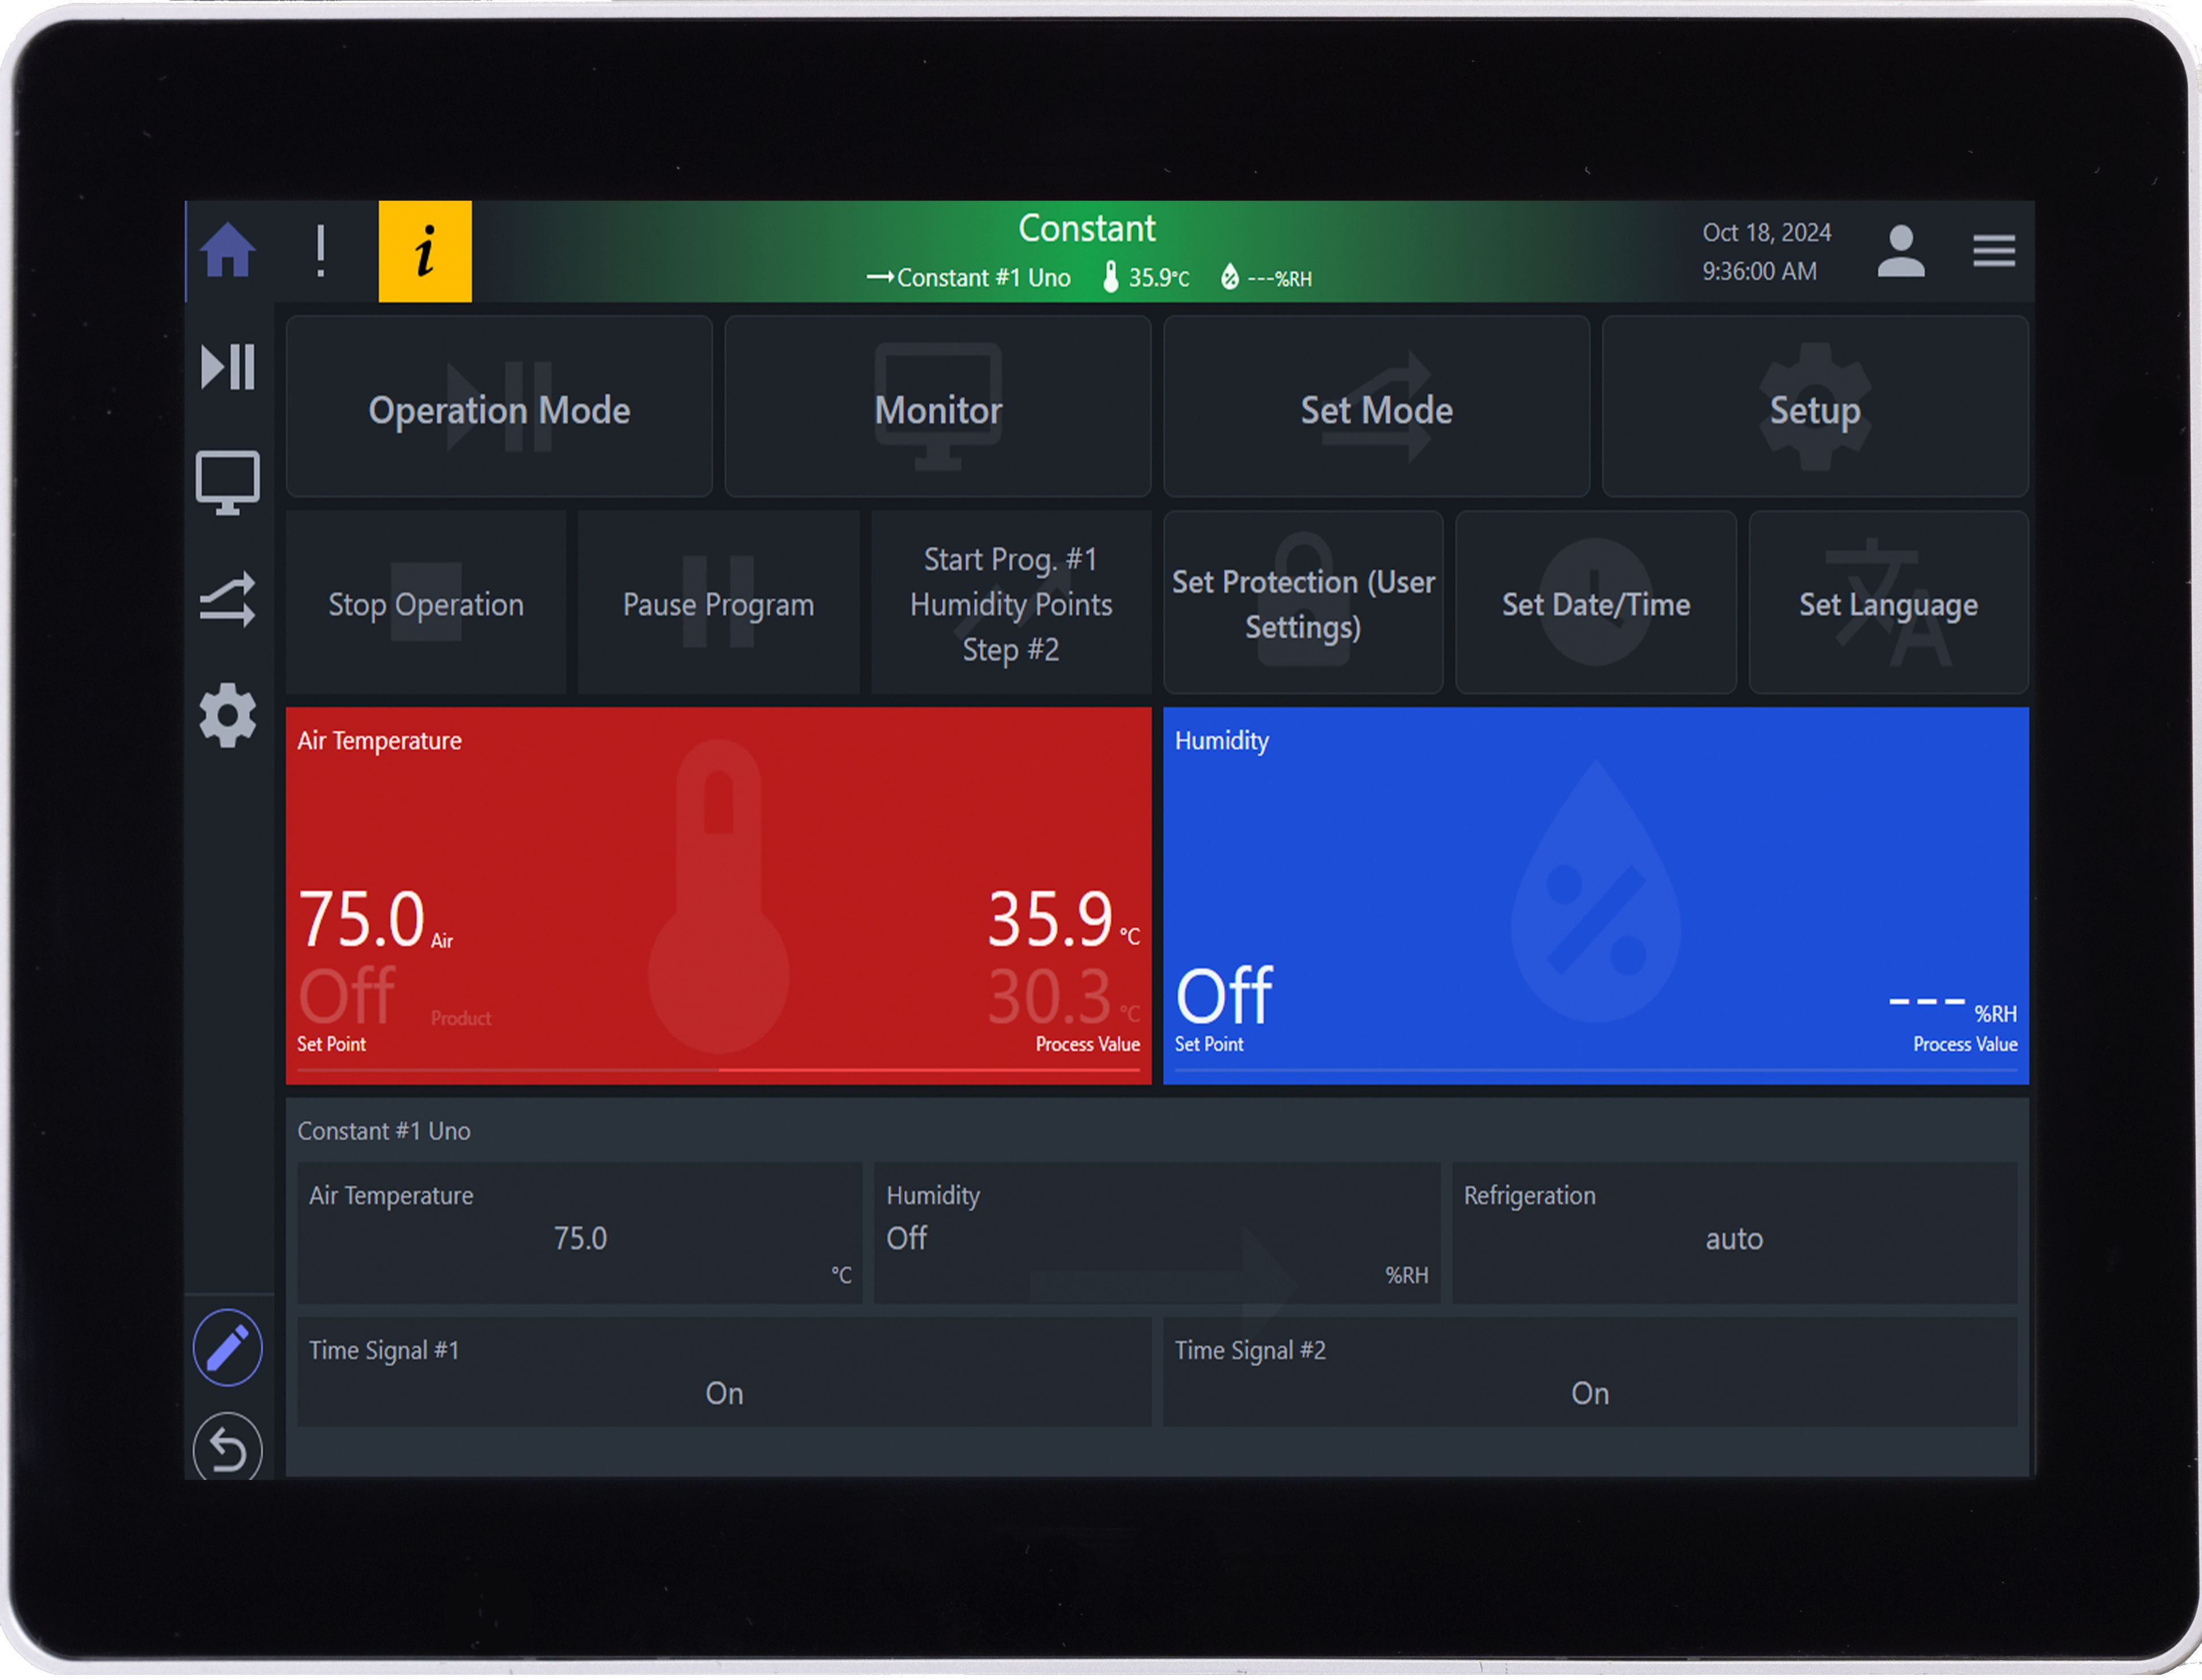
The UI consists of three major components: (1) Menu bar, (2) Status bar, and (3) Standard Display area. The Operation Mode page (depicted in the figure below) illustrates these components. The touchscreen is operated by gently pressing the screen elements provided by these components.

| No. | Name | Description |
|---|---|---|
| 1 | Menu Bar | Displays common operation menus of the system |
| 2 | Status Bar | Displays common system statuses: information, alarm, operating mode, date/time, user login, and system menus and accessories |
| 3 | Standard Display | Displays and sets detailed items and content for the selected menu |
The layout of the UI consists of the menu bar on the left and the status bar on the top; both of which remain fixed throughout the operation. The touch operation is interactive. Whenever text or numeral input is required, the floating keyboard or keypad is automatically laid over the bottom portion of the screen to receive the input.
Note: Press on the touchscreen only with your fingers. Hard or sharp-pointed objects should never be used on the touchscreen; doing so will damage the screen.
The home page of the GL controller is the first display to appear on the HMI after the system has started and is ready for operation. By default, the localhost user is automatically logged in to operate the chamber.
Note: If the GL controller was accessed remotely on a network via a Web browser, the user must log in to operate the chamber. The localhost user is only available on the HMI operation.

| No. | Name | Description |
|---|---|---|
| 1 | Menu Bar | Displays common operation menus of the GL controller system |
| 2 | Status Bar | Displays common system statuses that include information, alarm, operating mode, date/time, user login, system menu and accessories (such as, screenshot, set timers and network monitor page) |
| 3 | Menu Buttons | Displays and provides access to common operation menus as buttons (available in main home page only) |
| 4 | Operation Buttons | Displays control buttons for start, stop of selected constant mode or start, stop, pause of select program mode |
| 5 | Set Buttons | Displays quick setting buttons for user's login protection, date/time adjustment and language selection |
| 6 | Secondary Buttons | Displays secondary buttons for the selected menu. The edit button (pen icon) allows the user to edit the layout; e.g., the four menu buttons can be replaced with other menus or button selected from a different menu for quick access and operation. |
| 7 | Standard Display | Displays and sets the main menu screens |
The Operation Mode page has four groups of components in the display area. The function of these components are listed in the table that follows.

| No. | Name | Description |
|---|---|---|
| 1 | Operation Button | Start, stop, pause buttons for operating Constant or Program mode |
| 2 | Constant Run | Constant 1, 2 or 3 can be selected for constant mode operation. |
| 3 | Program Run | A profile in the program list can be selected to run. |
| 4 | Paging Button | Pages through program list; the paging button can page through the program list up or down the page per row, per page or to the last page |
The Monitor page consists of six separate submenus to allow separate displays, controls and operations. They include three Monitor pages (1, 2 and 3), Details, Program and Trend Graph. Refer to Section 4.9 for details on constant operation monitoring, for example.

| No. | Name | Description |
|---|---|---|
| 1 | Monitor Submenu | Displays separate submenus for display, control and operation. |
| 2 | Display Area | Displays set point and process values of temperature and humidity. When the equipment control is stopped or set to OFF, "OFF" is displayed. If the temperature (humidity) process value is abnormal or the humidity control is set to OFF, "---" is displayed. |
The Set Mode page allows the operator to set and configure constant mode options and to manage programming profiles. Refer to Chapter 4 and 5 for further details.

| No. | Name | Description |
|---|---|---|
| 1 | Constant Set Mode | Displays available constant mode options; Constant 1, 2 or 3 can be selected for configuration. |
| 2 | Program Set Mode | Displays available profiles on the program list; import, export, edit, copy, move/relocate, view, rename and delete are the available features to manage profiles. |
| 3 | Paging Buttons | Pages through program list; the button can page through the program list up or down the page per row, per page or to the last page |
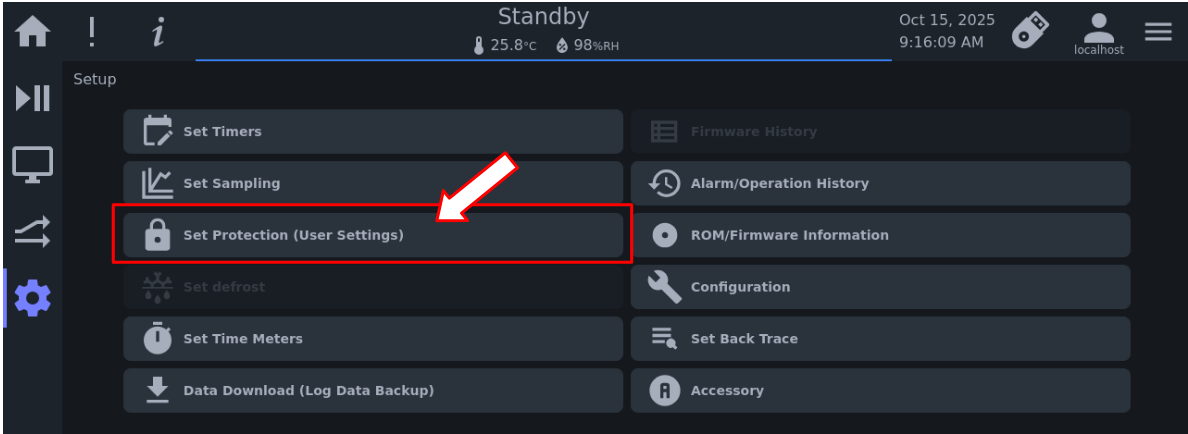
The Setup page provides many options for the operator to perform a system-wide setting or configuration. Twelve submenus are available to provide further controls of the GL controller system and the chamber. The owner (or administrator) who manages this chamber should take the necessary precautions to limit or allow users with certain privileges to access and control this Setup menu and its submenus. Details of user policy and access privileges are discussed in Chapter 6.
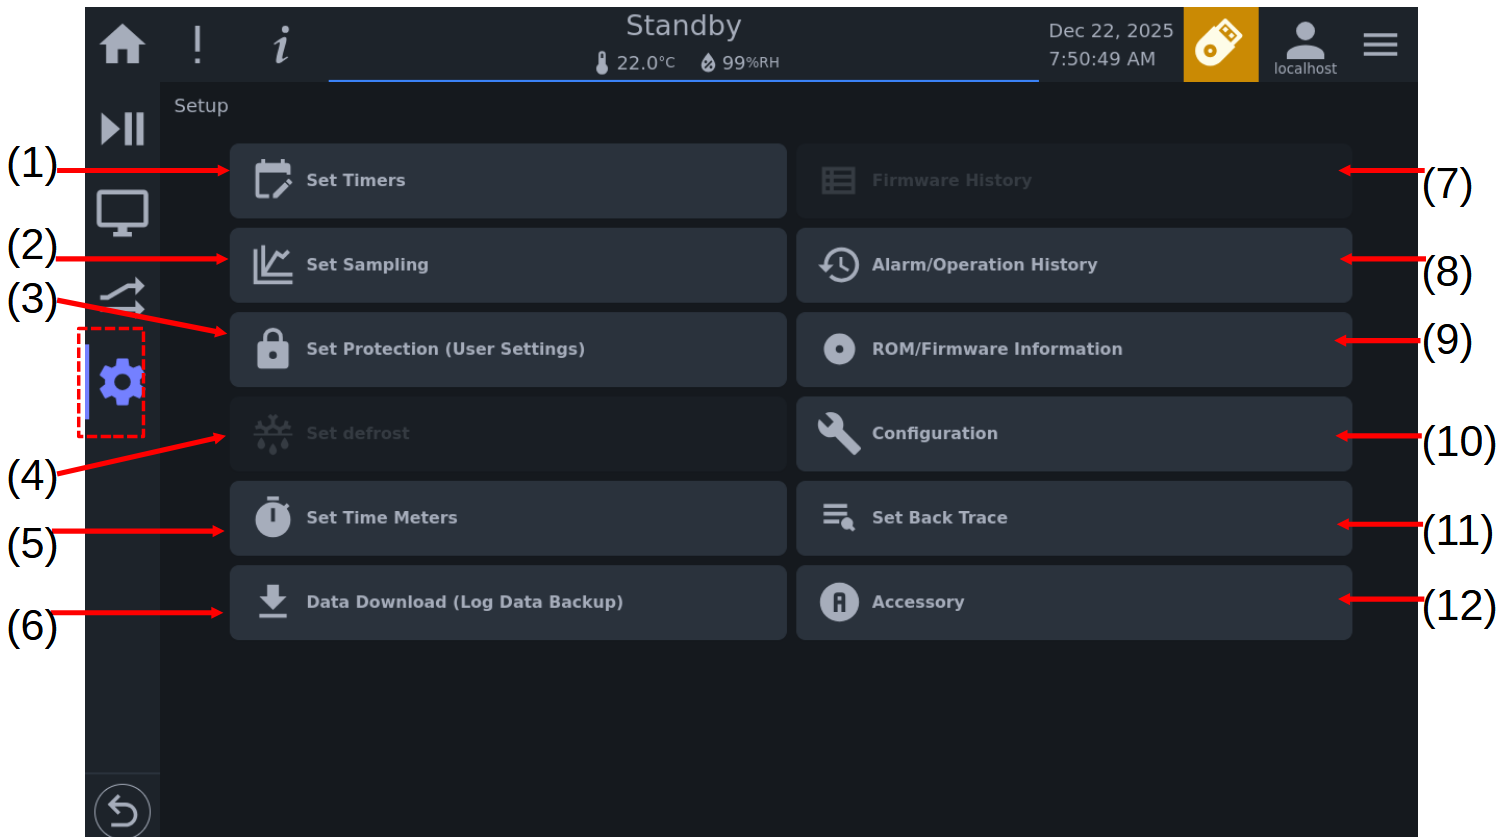
| No. | Name | Description |
|---|---|---|
| 1 | Set Timers | Provides an option to schedule a start (or stop) of an operation |
| 2 | Set Sampling | Provides an option to configure sampling and data logging details |
| 3 | Set Protection | Provides On/Off options for users to set HMI automatic login protection |
| 4 | Set Defrost | Option currently unavailable with this model |
| 5 | Set Time Meters | Provides a list of the operating condition (odometer) of the hardware components or devices installed inside the chamber |
| 6 | Data Download | Backup data logging using Samba for remote storage |
| 7 | Firmware | Provides a list of the firmware history of the system |
| 8 | Alarm/Operation | Provides a list of Alarm and Operation history of the system |
| 9 | ROM/Firmware Info | Provides a list of the current firmware information |
| 10 | Configuration | Provides a list of system-wide configuration |
| 11 | Set Back Trace | Provides a list of alarm conditions available for download for analysis |
| 12 | Accessory | Provides access to system runtime, HMI screensaver, and controller power options (with reboot and service restart options) |
An alternate way to directly access the Setup menu and its submenus altogether is via the Hamburger menu (or button) in the status bar, as depicted below.
Procedure:
-
Press the Hamburger button (1) in the status bar to access the system menu. Check to confirm the floating keyboard is enabled. A diagonal bar over the keyboard indicates it is disabled.
-
Press the keyboard (2) to enable it.
-
Press Setup (3) to access the Setup submenu list.

Note: The system menu via the Hamburger button lists Configuration and User as separate menus for their quick access. This option provides a shortcut to administer the system, such as adding new user accounts or performing a system-wide configuration.
The overall control features and operations of the GL controller system are accessible via the menus in the menu bar, menu buttons in the home page and the system menus in the status bar. Here are the detailed descriptions of the operation buttons and components of the control system in the menu bar, menu and setting buttons.

- Menu Bar: Displays system menus and control settings. Home Main window is the home page of the GL controller UI; it is the overview page indicating the system is ready for operation. Operation Mode provides access to control the chamber with options to start or stop Constant mode or Program mode. Monitor provides access to display details of chamber operating condition. Set Mode provides access to modify constant mode, create or edit a profile. Setup provides access to perform a system-wide configuration or settings of the GL controller.
- Menu Buttons: Available only in the home page as a quick access, these buttons are identical to the four menus in the menu bar.
- Secondary Buttons: These buttons operate in conjunction with the primary buttons; they serve as negative actions (e.g., Cancel or Back) or additional actions (e.g. Create, Import, Edit). The Edit button is useful for customizing the UI and its components in the Home page and Monitor, Page 1 and Page 2.
- Start/Stop Buttons: These start, stop and pause buttons are the operation buttons in the Operation Mode. They are placed here as quick-access buttons to start/stop a constant operating mode, start/stop or pause a profile in program mode.
- Setting Buttons: Three commonly used features (date/time, language and user settings) from the Setup menu are made available as setting buttons for quick access to their operation.
The status bar consists of multiple elements and components to provide status notifications (such as alarm, information, operating mode, date/time and user login) and quick access to the GL controller operation (such as operation mode, screenshot action, date/time adjustment, set timers operation, network monitor display and system menu). There is a subtle difference in the status bar between the HMI display and the Web display (see figure below). In the figure, the top status bar represents the HMI display, identifiable by date/time and localhost log-in status. The bottom status bar represents the Web display (via a remote network access), identifiable by the GL controller hostname and username.

| No. | Name | Description |
|---|---|---|
| 1 | Home | Displays home page of GL controller operating system |
| 2 | Alarm | Displays alarm notifications and a list of alarm issues |
| 3 | Information | Displays information of chamber operation history |
| 4 | Operating Mode | Displays current operating mode; On HMI: (1) press and hold for 2 seconds to take screenshot of the current display (USB device plug-in required), (2) press to quickly access the Operation Mode; On Web display page: click this area to quickly access the Operation Mode. |
| 5 | Date/Time | Displays current date/time; press and hold to access Set Timers |
| 6 | Login Status | Displays login status; the diagonal bar over the person icon indicates no user has logged in; Section 4.5 explains how to log in to the system. |
| 7 | Hamburger Menu | Displays a complete list of menus and submenus for system operations |
| 8 | Hostname | Displays GL controller hostname; click to launch Network Monitor page |
Contents associated with each menu in the menu bar are displayed in the standard display area. The selected menu is highlighted and marked by the left vertical bar to indicate its active status. Each menu has different display contents associated with their features and control options. Two menus (Home and Monitor) are selected for illustration as follows.
Home page and Standard Display:

Refer to Section 2.3.1 for details on the separate elements in the standard display area of the Home page.
Monitor page and Standard Display:

Refer to Section 2.3.3 for details on the separate elements in the standard display area of the Monitor page.
The floating keyboard is a multifunctional input device for an operator to log in to the system, create or edit a profile, set or perform a system-wide configuration. It has an enable and disable option under the Hamburger menu on the status bar. If it is disabled, a user cannot log in to operate the chamber. When the system (chamber) is powered on, the keyboard is disabled. To control the chamber, the user must enable the keyboard (and its keypad).

| No. | Name | Description |
|---|---|---|
| 1 | Input Field | Use this input field to enter alpha-numeric values |
| 2 | Apply Button | Apply input values |
| 3 | Close Button | Close keyboard after submission or cancel input |
| 4 | Backspace | Deletes one character to its left each time the key is pressed |
| 5 | CLR | Clears all characters in the input field |
The following procedure illustrates how to enable (or disable) the floating keyboard, which in turn also enables (or disables) the keypad for chamber operation.
Procedure:
-
Press the Hamburger menu (1) in the status bar. Check to confirm the floating keyboard is enabled under the system menu. A diagonal bar over the keyboard indicates it is disabled. Press the keyboard (2) to enable it. Press the right angle (3) to close the system menu.

The floating keypad is a numerical input device for input parameters. It is enabled or disabled under the keyboard enable/disable options (see Section 2.4.4). If the keyboard is disabled, the keypad is also disabled. In order to use the keypad, the keyboard must be enabled.

| No. | Name | Description |
|---|---|---|
| 1 | Input Field | Use this input field to enter numerical values for the input parameter |
| 2 | Value Range | Displays available and permissible range of input values |
| 3 | Apply Button | Apply input values |
| 4 | Close Button | Close keypad after submission or cancel input |
| 5 | Backspace | Deletes one character to its left each time the key is pressed |
| 6 | CLR | Clears all numerical values in the input field |
The GL controller software consists of the PLC and embedded computer system powered by GNU/Linux that communicates with each other to provide the user interface for the GL controller, collectively called the GL controller system. The GL controller system and the test chamber are connected to the same main power switch.
Turn on the GL controller system and chamber by performing the following procedure.
Procedure:
-
Turn on the circuit breaker of the instrumentation by setting the main power breaker in the ON position.
-
The GL controller system starts. Within in a minute, the HMI display comes on. The GL controller system automatically logs the default user in for operation.
-
The system is ready for operation.

Turning off the GL controller system and chamber requires the opposite procedure of the previous section, namely by setting the main power breaker (on the back of the chamber) in the OFF position.
When the main power breaker is set in the ON position, within a minute, the display on the HMI will come on. The system automatically logs the default user, called localhost, in to operate the chamber. The localhost is a special user account that the system grants access to control the GL controller on the HMI. The system status bar (see figure below) indicates the GL controller system is ready for operation. The operator must enable the floating keyboard/keypad, accessible via the system menu (indicated by the arrow), to allow the system to receive any input parameter during operation.

If the GL controller is accessed remotely via a Web browser, the user must log in to operate the chamber, as depicted in the figure. The optional floating keyboard/keypad can be enabled for on-screen operation to receive any input parameter during operation. However, the mouse and keyboard of the PC that launched the Web browser can be used to control and operate the chamber.

The system menu provides full access to the system operation and configuration menus. The floating keyboard/keypad can be enabled under this menu to provide login and input support on the system when operating on the HMI.

| No. | Name | Description |
|---|---|---|
| 1 | Show/Hide Button | Press this right angle to hide (close) the Hamburger Menu |
| 2 | Keyboard | Keyboard is disabled when the diagonal bar is over it; the system cannot receive input without the keyboard when operating on the HMI; press on the keyboard to enable it. |
| 3 | Home | Displays home page of the GL operating system; the highlighted menu indicates its active status in the standard display. |
| 4 | Notification | Displays system notification and information, e.g. alarm, system error and information |
| 5 | Main menu | Displays system main menu, identical to the menu bar |
| 6 | Configuration | Configuration is the Setup submenu that contains common and most used configuration operations; provided here as a quick-access button. |
| 7 | User | User login prompt; similar to the user icon in the status bar |
Note: The system menu may appear differently depending on when or where it was accessed from. The above figure shows the system menu being accessed from within the main home page. The following figures depict the system menu being accessed from within the Monitor menu and the Settings menu, respectively.
System menu accessed from within the Monitor page

System menu accessed from within the Settings page

When an operator logs out of the GL controller system (via HMI or Web browser), all vital operating controls in the UI are locked out, while the chamber continues in its current operating mode. For example, if the user initiates Constant 2 and then logs out, the chamber continues in its Constant 2 mode, as depicted in the figure below. If the user initiates Profile 1 and then logs out, the chamber remains in the program mode until the program completes all the instructions, while all operating controls in the UI are locked out. The status bar displays the diagonal bar over the user icon to indicate the user has logged out.

| No. | Name | Description |
|---|---|---|
| 1 | Login Status | Diagonal bar over user icon indicates the GL controller system has been logged out; no user is logged in on this UI. |
| 2 | Home | Home page of GL controller. If any menu button is pressed/clicked, the login dialog appears for the user to log in. |
| 3 | Operation Mode | If a user is not logged in, operation buttons for Constant or Program are locked and grayed out. |
| 4 | Monitor | This menu displays the current status of the GL controller. |
| 5 | Set Mode | If a user is not logged in, contents of Constant Setup or Program Setup are viewable in read-only mode; they cannot be modified. |
| 6 | Setup | If a user is not logged in, only few submenus are accessible; the rest are locked out. |
| 7 | Operation/Set | These buttons are grayed out when no user is logged in |
Only authorized users can log in to the system to operate the chamber. Two users, localhost and admin, are available by default when the chamber is shipped from the manufacturer. The credentials of these two accounts are listed in the following table. Refer to Section 7.4 on how to administer the GL controller system with different user accounts with different privileges.
| User Name | Password | Description |
|---|---|---|
| localhost | GL system grants access to GL controller under localhost user | |
| admin | admin | An account which has specific roles and privileges to manage and control the GL controller system operation, settings and configurations |
Note: To protect the GL controller and chamber from unauthorized users and to keep the GL controller system secure, the admin password must be changed to something much more secure.
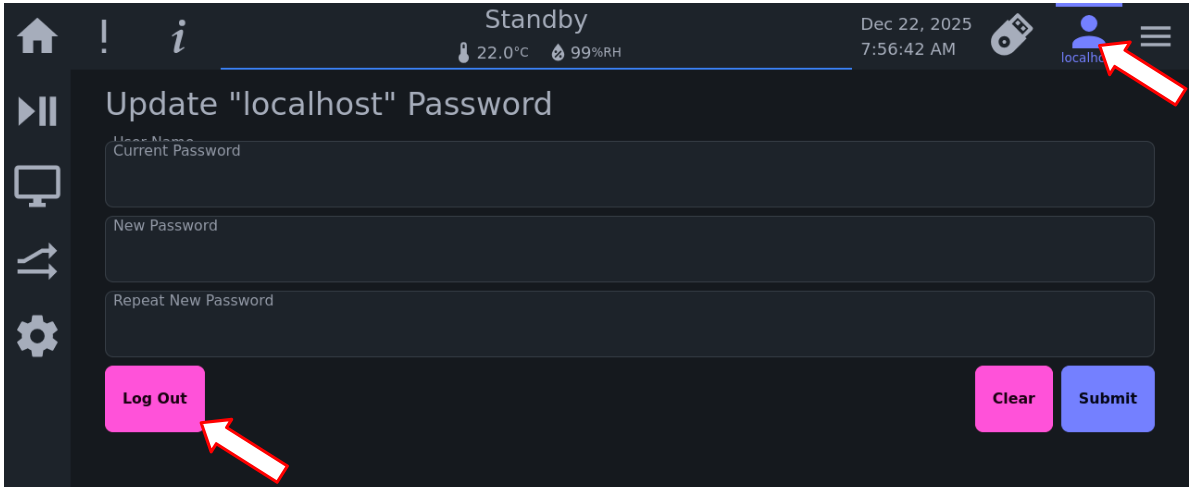
The password for the localhost user is stored internally in the system, and only the system can log in using this account; hence, there is no password for this account listed in the table (above). If you logged out of the localhost account by accident or on purpose, you have two options to log back in.
- Press the Auto login button underneath the login prompt to log back in to the localhost account.
- Log in to admin or your own user account. Refer to Section 2.6.3 for details.
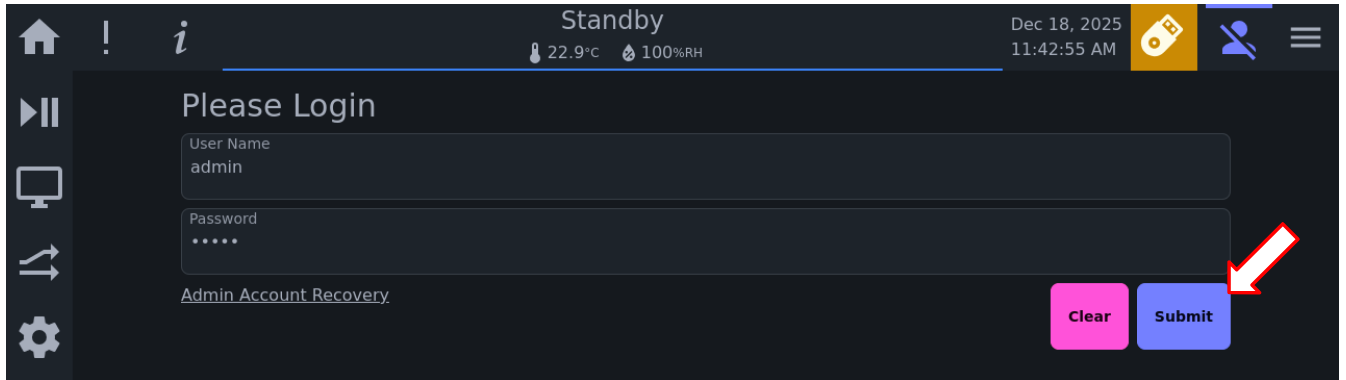
The following procedure illustrates how to log in to the GL controller system using the admin account via HMI after logging out of the localhost. The admin login credentials are listed in the above table.
Procedure:
-
Press the hamburger menu in the status bar.
-
Check to make sure the keyboard has been enabled. If a diagonal bar is over the keyboard icon, press the keyboard to enable it (see arrow), then press User to log in (see arrow).
-
Press the User Name field under the Please Login prompt (see arrow), the keyboard will appear at the bottom; enter admin in the User Name field on the keyboard (see arrow) and press the check button (see arrow). Repeat the process for the password. _Note: To cancel login, press X anytime during user name or password input.
-
Press the Submit button to log in.
-
The system is now ready for operation under the admin user account.


Note: The above procedure can be used to log in to any user account on the system (except the localhost), provided that account exists. Refer to Section 7.4 for details on how to manage user accounts.
The following procedure illustrates how to log in to the admin account on the GL controller system via a Web browser. The admin login credentials are listed in the table in Section 2.6.3.
Note: Logging in via a Web browser (for remote access), the keyboard and mouse of the PC on which the browser was launched can be used to enter the admin credentials. No need to enable the on-screen keyboard.
Procedure:
-
Click the user icon on the status bar (see arrow).
-
Click the User Name field and enter admin (see arrow). Click the Password field and enter the password for admin (see arrow), then press Enter or click the Submit button to log in (see arrow).
-
The system is now ready for operation under the admin user account.


The GL software system was designed and implemented to be robust, providing the UI with multiple ways to accomplish the same task. This flexibility allows users--novice and expert alike--the ability to access system menus to complete their task effectively and efficiently. As depicted in the following figure, there are three known ways to access the system menu to control and operate the chamber. We outline these three approaches as follows.

The following figure depicts the system menu via the menu bar. The menu bar remains fixed throughout the operation in any operating mode. In addition to the four GL controller menus, this menu bar allows the user to return to the main home page using the home button.

The following figure depicts the GL controller main home page consisting of four menu buttons for a quick access. These menu buttons are available within the main home page only. Whenever the chamber is powered on from a cold start (i.e., when the main power breaker is set in the ON position), the GL controller system will display the main home page when it is ready for operation.

The following figure depicts the system menu via the hamburger button in the status bar. As indicated by the arrows, each system menu displays different contents depending on how (i.e., from within what menu page) it was accessed. The system menu on the left was accessed from within the main home page, while the second one on the right was accessed from within the Setup page; hence, the highlight menu name.

The system menu also contains (and displays) additional information about the GL controller system that includes end-user license and agreement, user support page for online operation manual, specific version of the GL software system, the embedded operation manual and more.
The following procedure outlines the steps to manage the beep volume in the event of an alarm or a warning. Refer to Section 7.13 for detail.
Procedure:
-
From the main home page, press the hamburger button (1) in the status bar to access the system menu. Press Configuration (2), followed by Set Sound submenu (3).
-
By default, the Alarm volume and Warning volume are at maximum setting, as indicated by the volume slider bar.
-
To adjust the beep volume, change the volume level on the slider bar.
-
To turn off the beep volume, either press the speaker icon (1) or set the volume level on the slider bar to its minimum setting (2).
-
Press the Save button (3) to save the setting. To cancel the setting, press the Back button (4) and press Yes to confirm the cancel.


| CAUTION |
|---|
|
It is strongly advised to keep the beep on whenever possible to prevent any delay in the detection of an alarm or warning. If the beep is turned off, alarm and warning are not notified with sound and are indicated only with red blinking of the operation lamp and on warning occurrence screen. Set the beep volume in accordance with the ambient environment. |
The GL controller and chamber are configured with correct date/time based on the local time zone of the manufacturer using Eastern Standard Time (EST, New York) with UTC (Coordinated Universal Time) as a point of reference to ensure the correct conversion to local time for any time zone. If your local time zone is EST, then there is no need to perform date/time configuration. If your local time zone is not EST, refer to Section 7.2 for detailed configuration of the GL controller date/time and its operation.
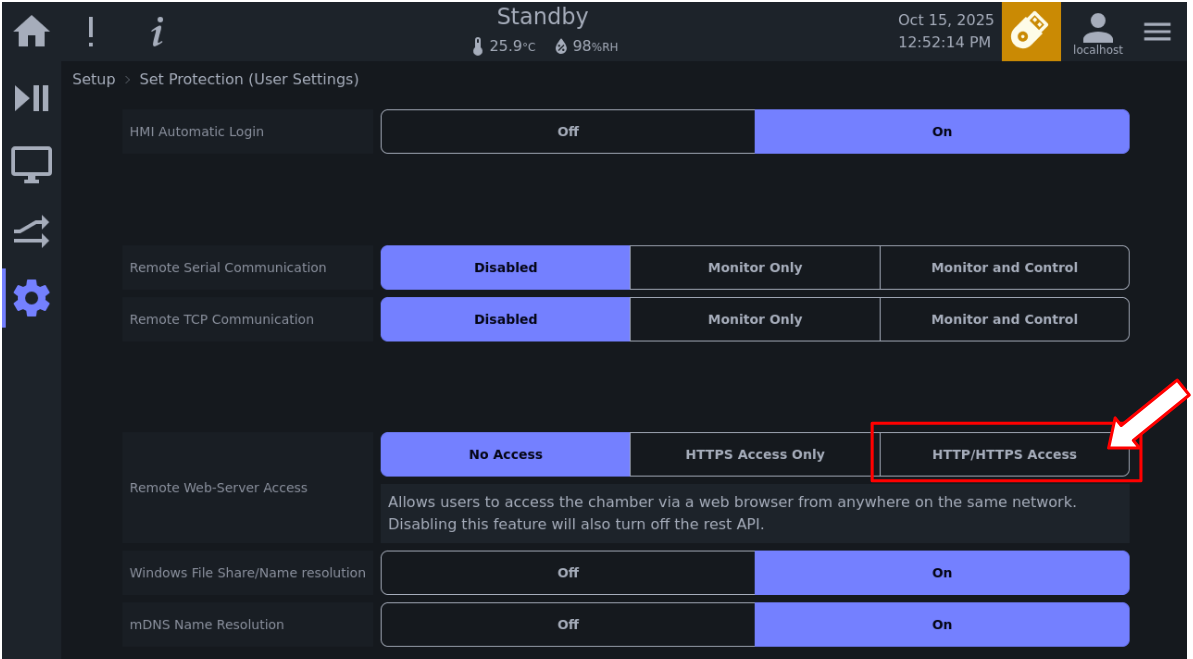
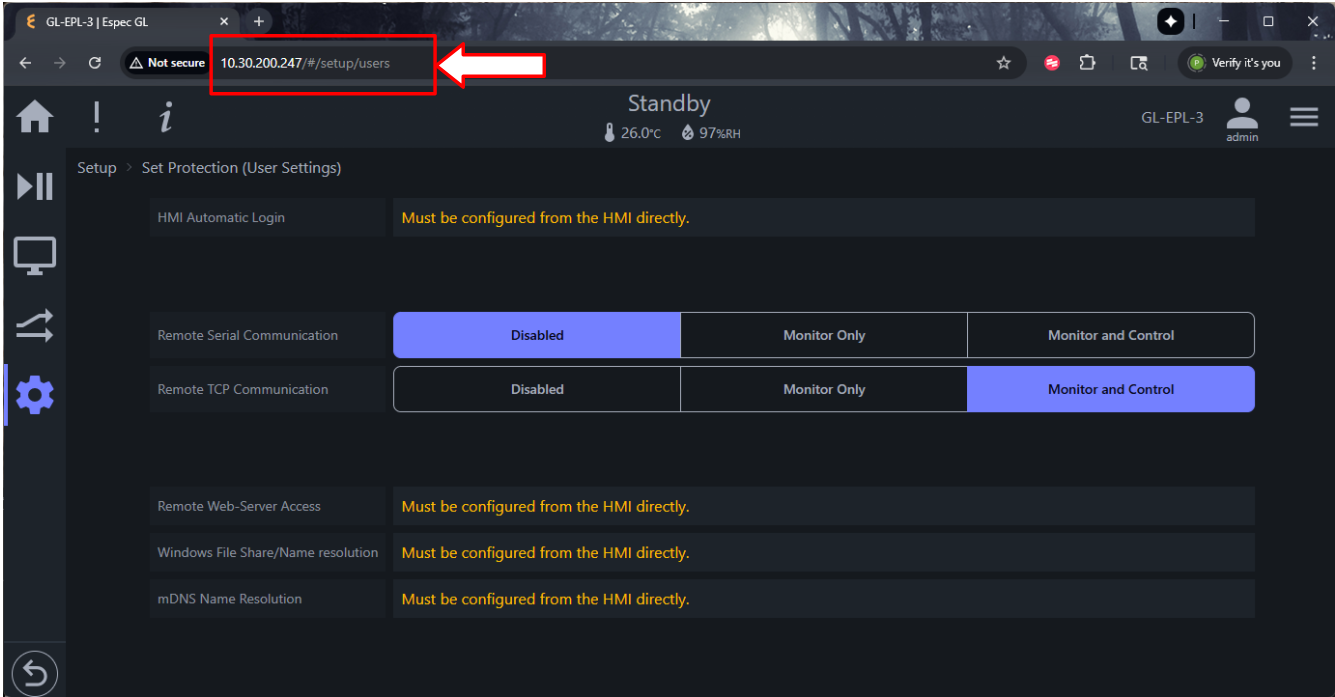
The Set Protection page allows the operator to enable/disable the HMI autologin to protect the system against unauthorized users. It also offers two remote-operation options when the GL controller system is part of the local network, namely, (1) remote access via a Web browser on a PC or other web-based device on that local network, and (2) remote access via direct communication with GL native text commands through TCP/IP (Transmission Control Protocol that uses Internet Protocol) or serial interface.
These two options are configurable on the HMI display as depicted in the following figure.
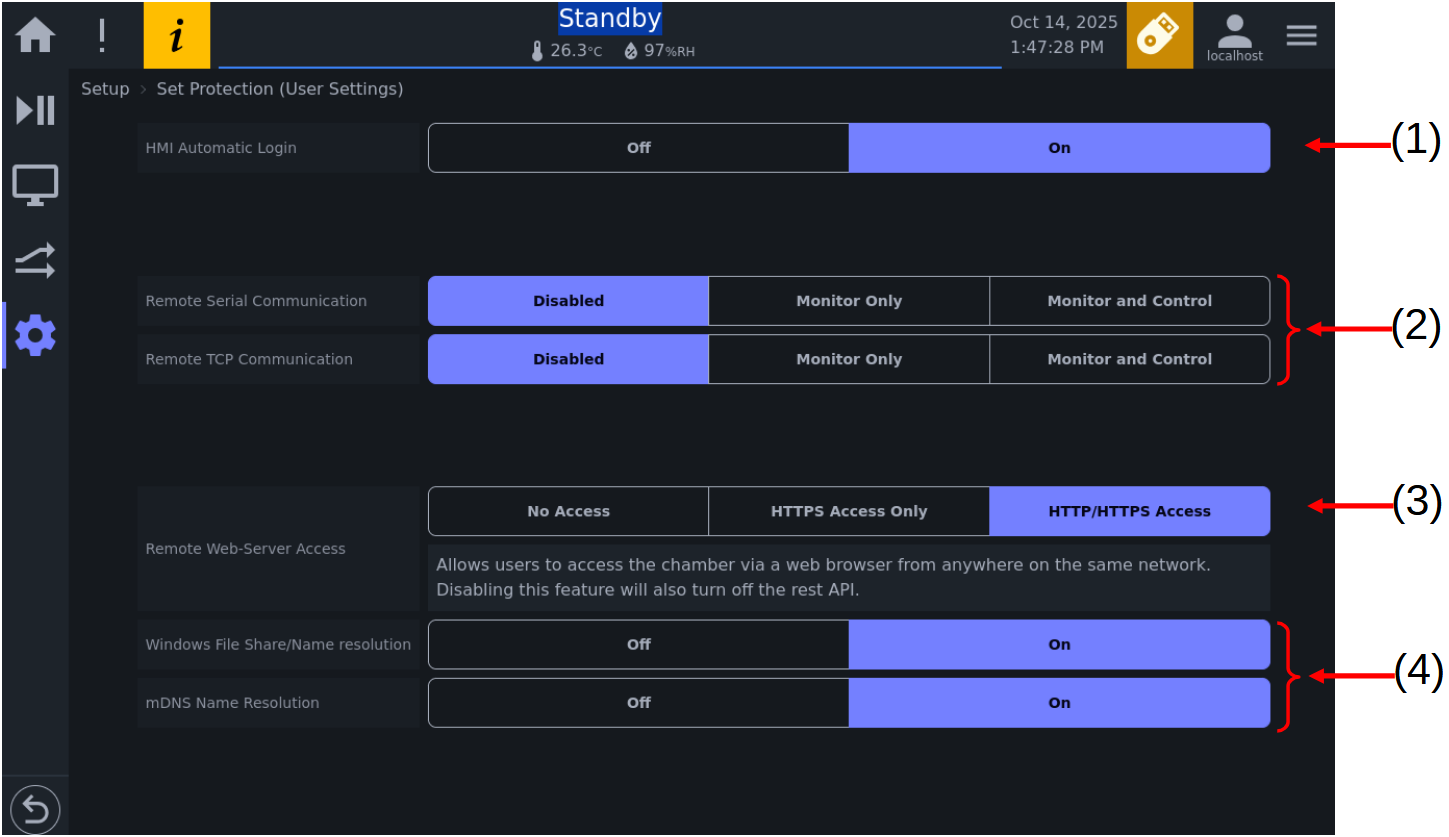
| No. | Description |
|---|---|
| 1 | HMI autologin; User has option to enable or disable HMI auto login as an extra protection. |
| 2 | Remote communication via TCP/IP or serial interface can be controlled with Disabled, Monitor Only, and Monitor and Control options. When disabled, remote communication is blocked; when set to Monitor Only, monitor commands can be issued; when set to Monitor and Control, both monitor and set commands can be issued. |
| 3 | Remote access to the GL controller system with full control and operation via a Web-based device; e.g., access via a Web browser running on PC or handheld device on the local network. |
| 4 | Configuration options for Multicast DNS (mDNS) name resolution on the local network |
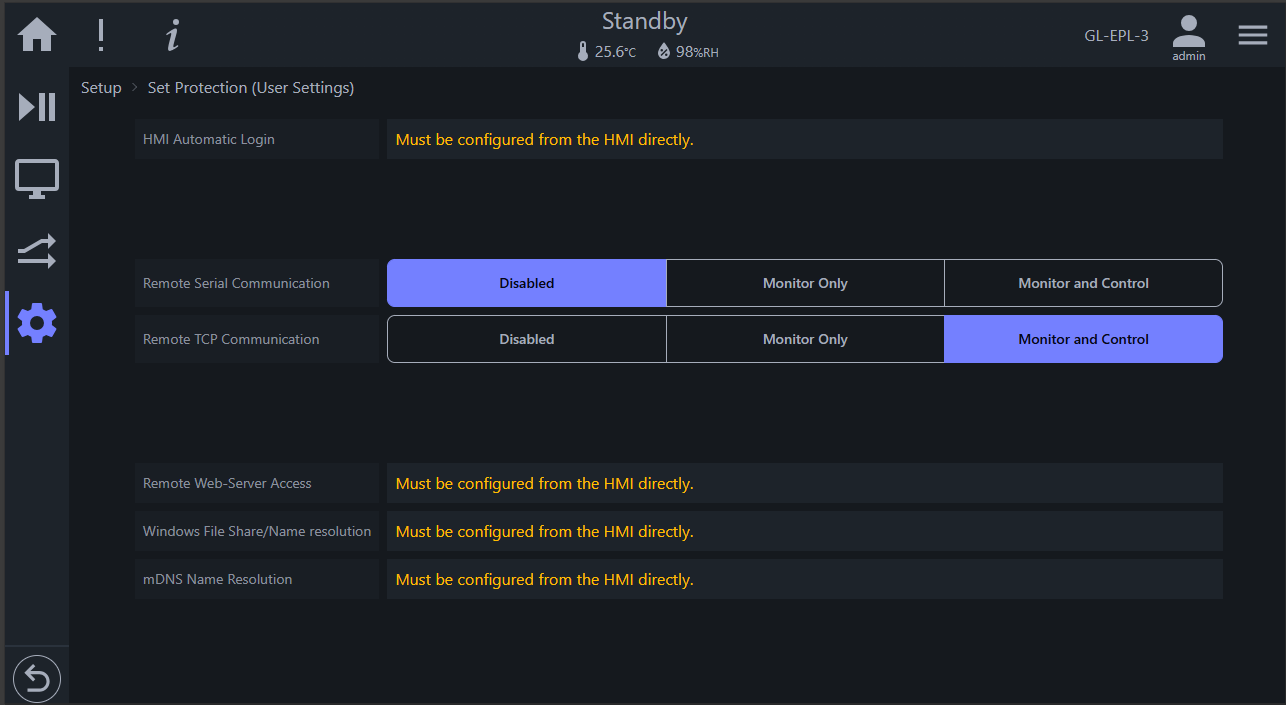
Note: Configuration options No. 1, 3 and 4 must be performed directly on the HMI. The following figure depicts the Set Protection page when accessed via a Web browser.
The following sections provide a quick way to enable (or disable) the remote communication (via TCP/IP or serial) and remote access via a Web browser running on a PC or a handheld device on the local network. For complete operation of the Set Protection page, refer to Section 6.5.
TCP/IP is the default communication protocol used by the GL controller. It offers both speed and convenience over its serial counterpart. The following procedure provides steps to enable TCP/IP communication for Monitor and Control. If remote serial communication is required, this procedure also applies with appropriate button selected. Refer to Section 7.1.6 for details on remote communication via an SSH terminal emulator, called PuTTY.
Procedure:
-
Log in as user with administrative privilege; the localhost user that the system uses is a viable option.
-
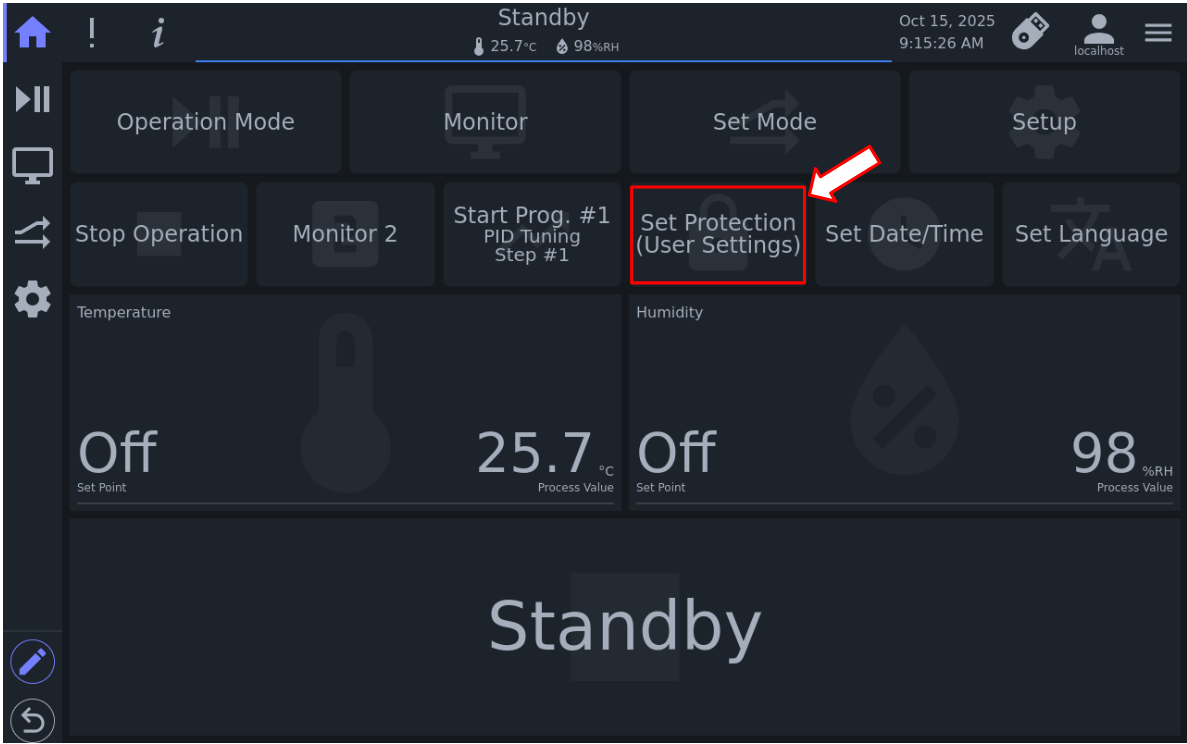
Access the Home page and press Set Protection (User Settings) (see arrow).
Note: If this button is not available, select Setup (in the menu bar), then press the Set Protection (User Settings) button (see arrow).
-
Press the Monitor and Control button in the Remote TCP/IP Communication field (see arrow)
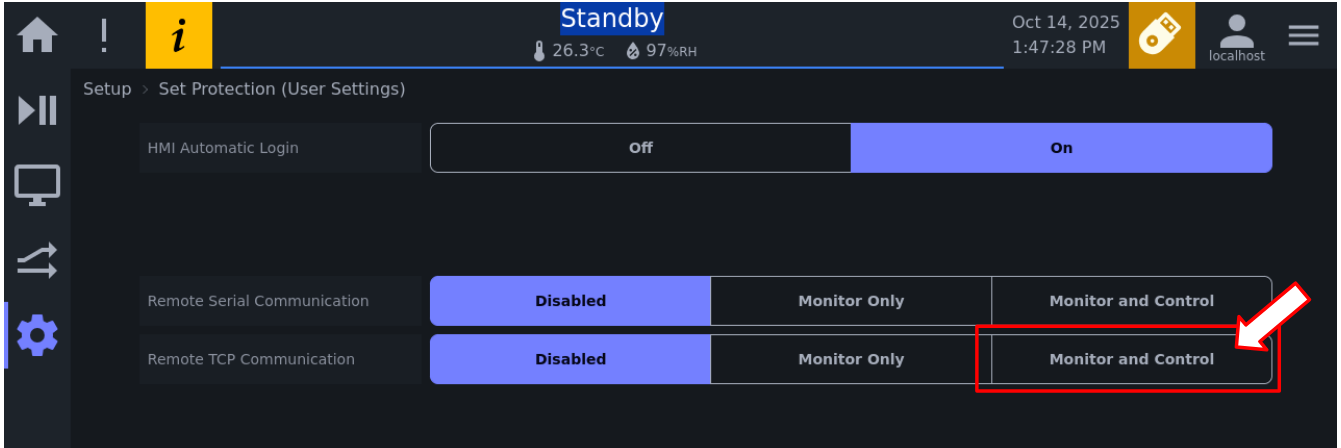
Refer to Section 7.1.6 on how to use remote TCP/IP communication via an SSH terminal emulator, called PuTTY.
Note: Remote TCP/IP communication protocol operation is unaffected by the setting of network remote access for a Web browser (discussed next). Therefore, remote TCP/IP communication can be enabled and used independently of the Web-browser remote access setting.
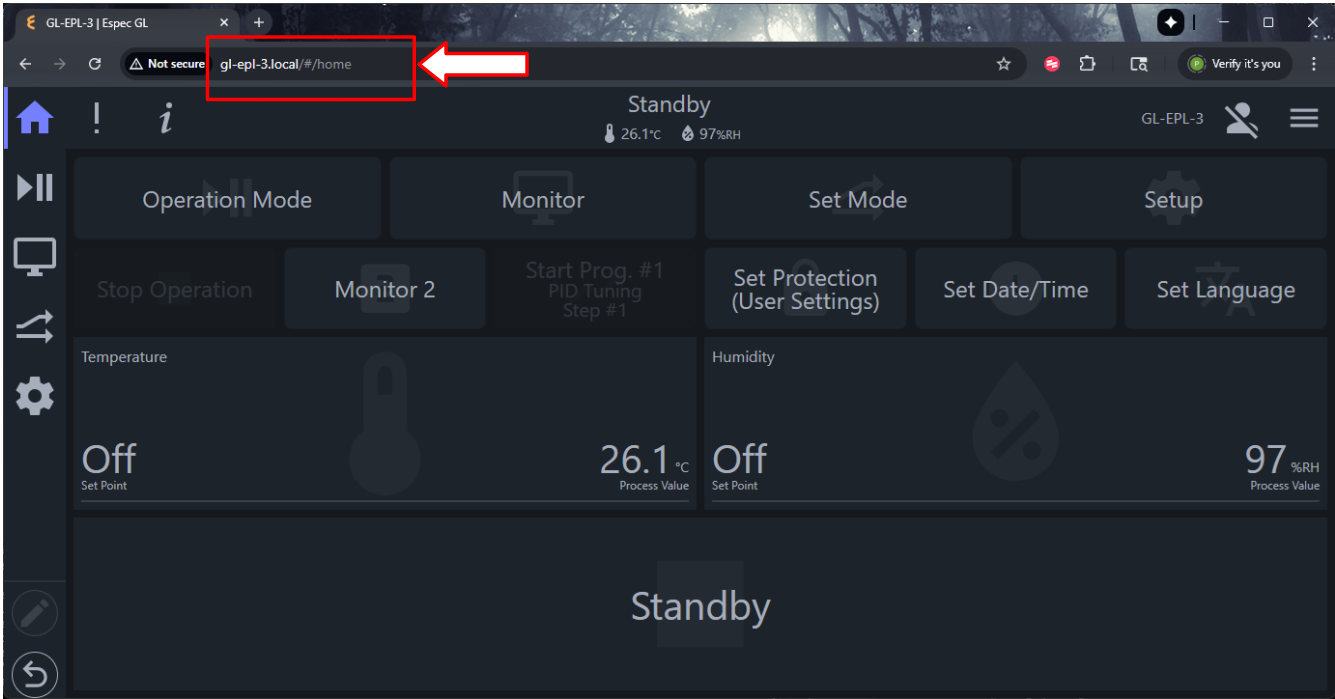
The following procedure provides steps to enable local network remote access such that the GL controller to be accessed and controlled remotely via a Web browser running on a PC or a web-based device on the local network.
Procedure:
-
Log in as user with administrative privilege; the localhost user that the system uses is a viable option.
-
Access the Home page and press the Set Protection (User Settings) (see arrow).
Note: If this button is not available, select Setup (in the menu bar), then press the Set Protection (User Settings) button (see arrow).
-
Press the HTTP/HTTPS Access button (see arrow), followed by Yes to confirm the action.
-
The GL controller system will reboot to apply the setting.
-
To confirm the setting following the reboot, repeat Step 2.
-
To find out what IP address or hostname the GL controller system is using, refer to Section 7.1.4 for details.
-
To access the GL controller system from a PC on the local network, launch a Web browser (e.g., Chromium, MS Edge, Firefox, Google Chrome), then in the URL field, enter:
or
where IP-address or hostname was obtained in Step 6 (above).
Here are two examples of GL controller UI on Google Chrome accessed via its IP address and its hostname, respectively.
GL Controller System accessed and displayed via its IP address:
GL Controller System accessed and displayed via its Hostname:
The administrator's account (username admin) and password play an important role in managing the GL system security and operation. With multiple accounts and users on the system, the admin account must be kept secure so that no unauthorized users have access to it. If the account is compromised or its password is forgotten, a password recovery option can help reset the admin account.
This section outlines steps to set up an e-mail account recovery.
Procedure:
Note: The following procedure outlines steps starting from a cold start of the GL chamber. If the GL system is already turned On, proceed to Step 2.
-
Turn on the circuit breaker of the instrumentation by setting the main power breaker in the ON position (see Section 2.5.1).
-
Log out of localhost by pressing the user localhost icon (see arrow) followed by the Log Out button (see arrow).
-
Enable the floating keyboard; see Section 2.4.4.
-
Log in to the admin account using admin credentials, followed by the Submit button (see arrow). Refer to Section 2.6.3 for details.
-
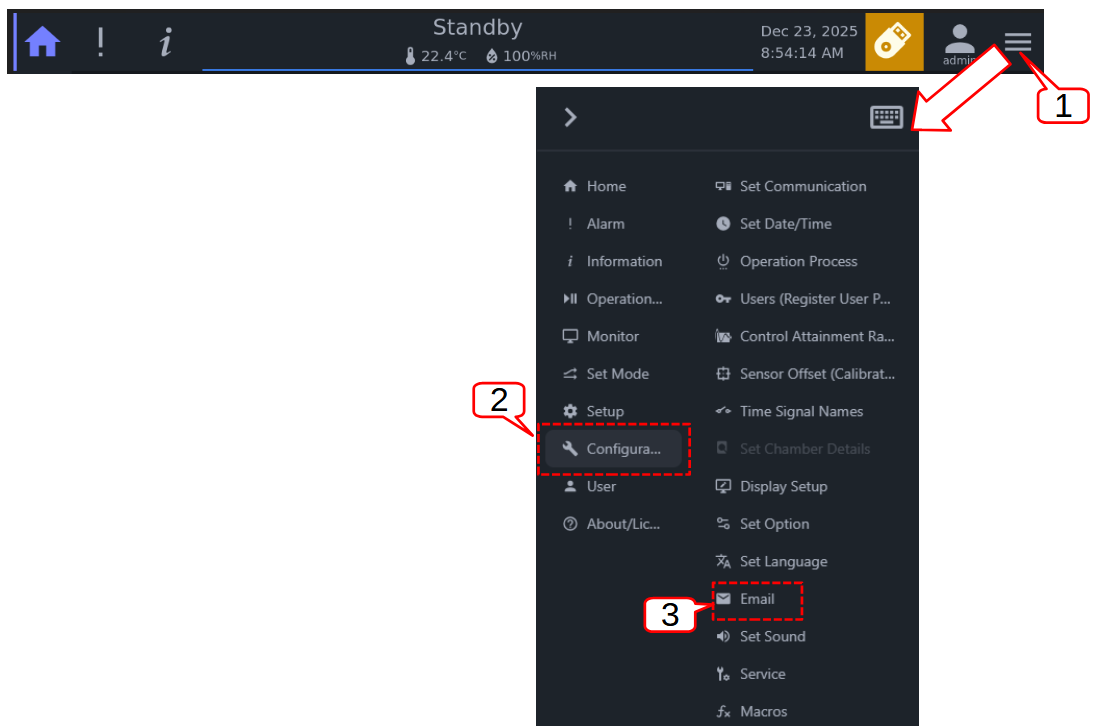
Access the hamburger button in the status bar (see callout 1), select Configuration (see callout 2), followed by Email (see callout 3). Note: Another way to access Email page is from the home page Setup button or the Setup menu, then select Configuration and Email. Our approach here is more direct.
-
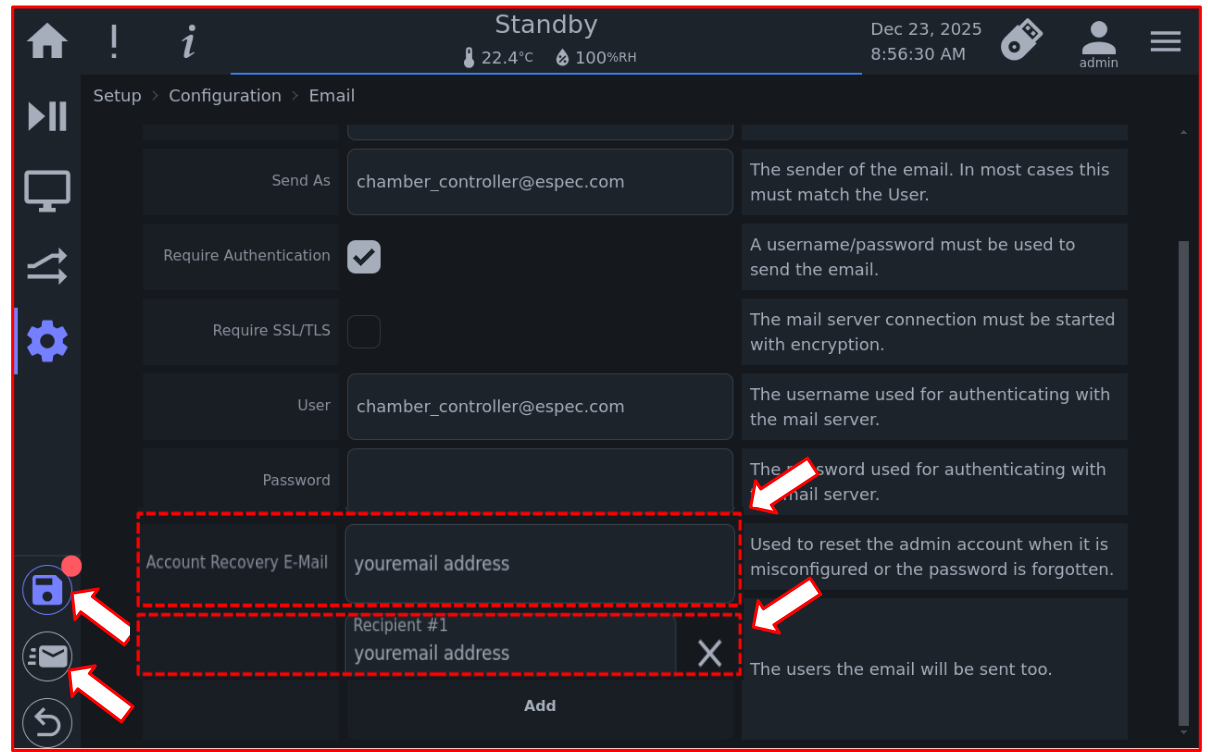
To set up admin account recovery, enter your e-mail address in the Account Recovery E-Mail field (see top-right arrow). To set alarm alert via e-mail, enter the recipient e-mail address in the Alarm Recipients field (see bottom-right arrow). Additional recipient e-mails may be added using the Add button.
-
If the GL system is connected the your main network which has access to the Internet, an e-mail test can be done by applying the e-mail button in the bottom of the menu bar (see arrow). If e-mail settings are all correct, apply the Save button to save the setting. Note: To cancel the Email setup procedure, apply the back-arrow button in the menu bar.
-
Log out of the admin account.
This section outlines the steps to recover the admin account and password. It should be noted that the actual process of account recovery is to reset the admin account to factory setting; and from there you can change the admin password to something more secure. For this reason, Section 2.11.1 should be done first and foremost to limit security breach. Once an e-mail address has been set and stored in the system, the recovery procedure will be sent to that e-mail address.
Procedure:
-
Follow the procedure in Section 2.11.1, Step 1 through Step 3.
-
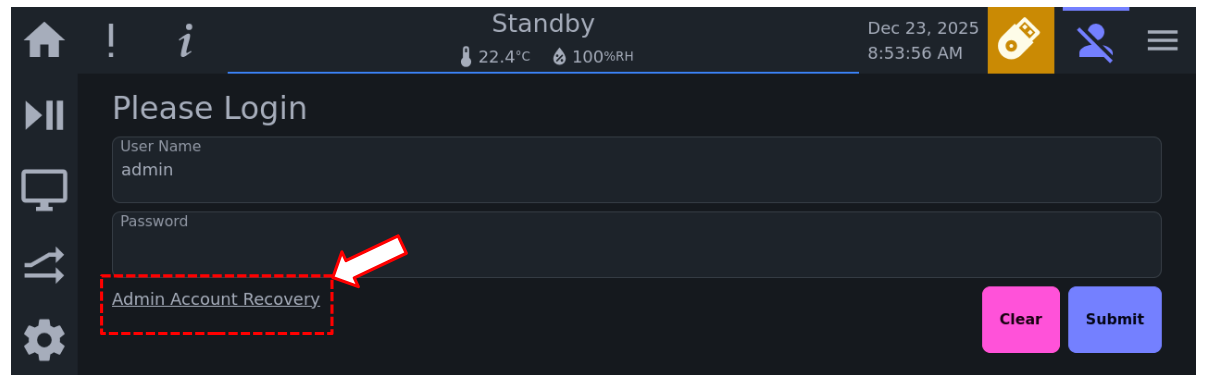
Enter the admin username (admin), then press the Admin Account Recovery button (see arrow).
-
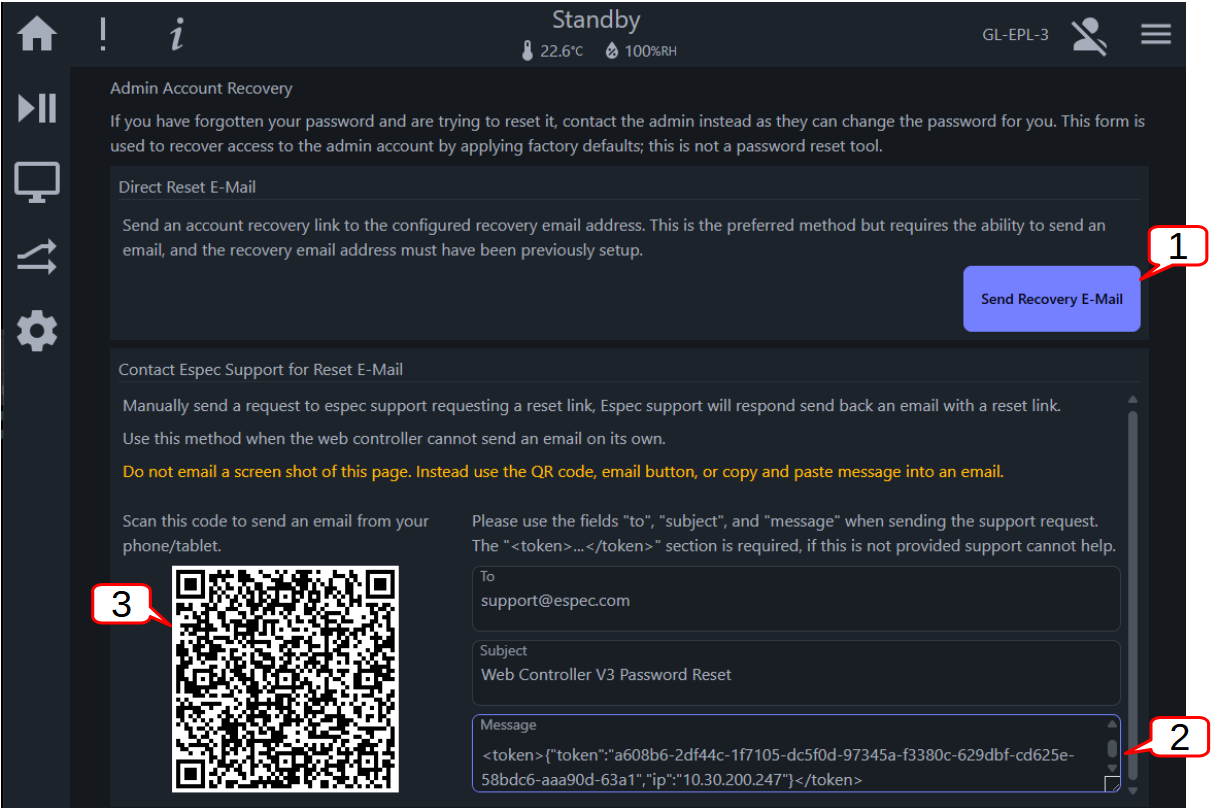
(a) If you have set up an account recovery in Section 2.11.1 with your e-mail address, and your GL system is connected to the main network, select the Send Recovery E-Mail button (see callout 1). A link to reset the admin account is sent to your e-mail account; open the e-mail and click on the link to access the GL system and set the admin password. (b) If you did not set up an account recovery in Section 2.11.1, copy the contents in the Message box (see callout 2) and compose an e-mail based on the given instruction for To and Subject, ESPEC will respond with a link to access your GL system. (c) Or, with your smartphone, you can use the QR code (see callout 3) to send a message to ESPEC for account recovery.
The GL controller supports multiple languages. The following list outlines the different languages currently available in the GL controller user interface: English, Spanish, Italian, Korean, Portuguese, Simplified Chinese, Traditional Chinese, German, French, Japanese, Polish, Vietnamese.
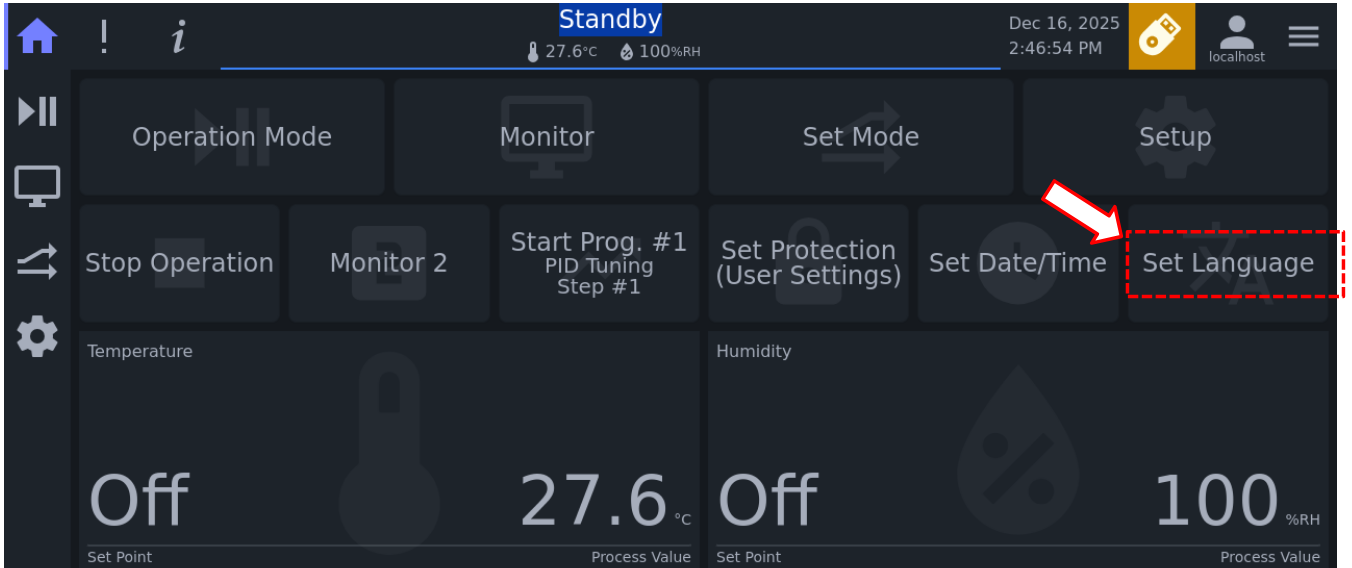
The default language is English. The list of available and supported languages on the GL controller system is under the Set Language submenu, as depicted in the following figure: Setup -> Configuration -> Set Language.
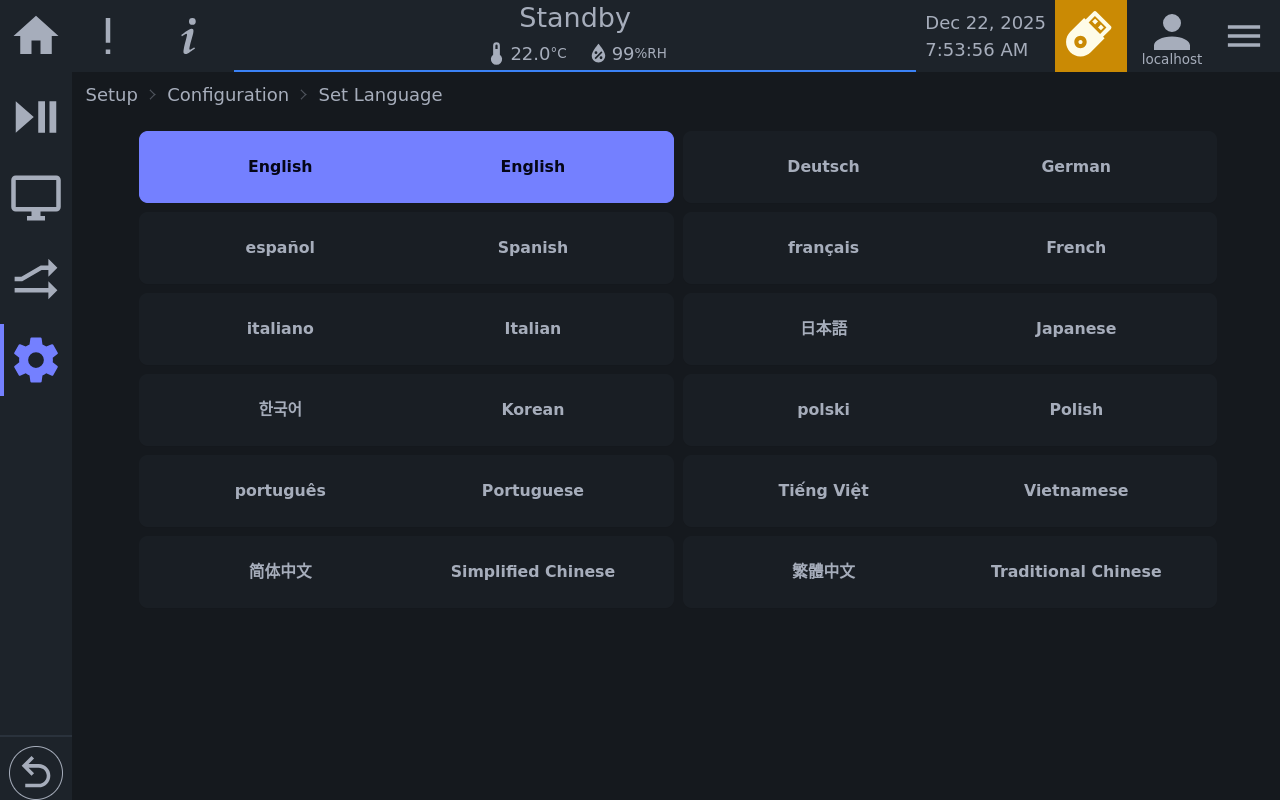
This section outlines the procedure to set and select a desired language for the GL controller user interface. Language selection can be set under any user account.
Procedure 1: Select a language from within the Home page.
-
Press the Set Language button in the home page (see arrow).
-
Select the desired language from the list (in the Set Language page).
Procedure 2: Select a language via the menu bar.
-
Press Setup in the menu bar.
-
Press Configuration
-
Press Set Language
-
Select the desired language from the list.
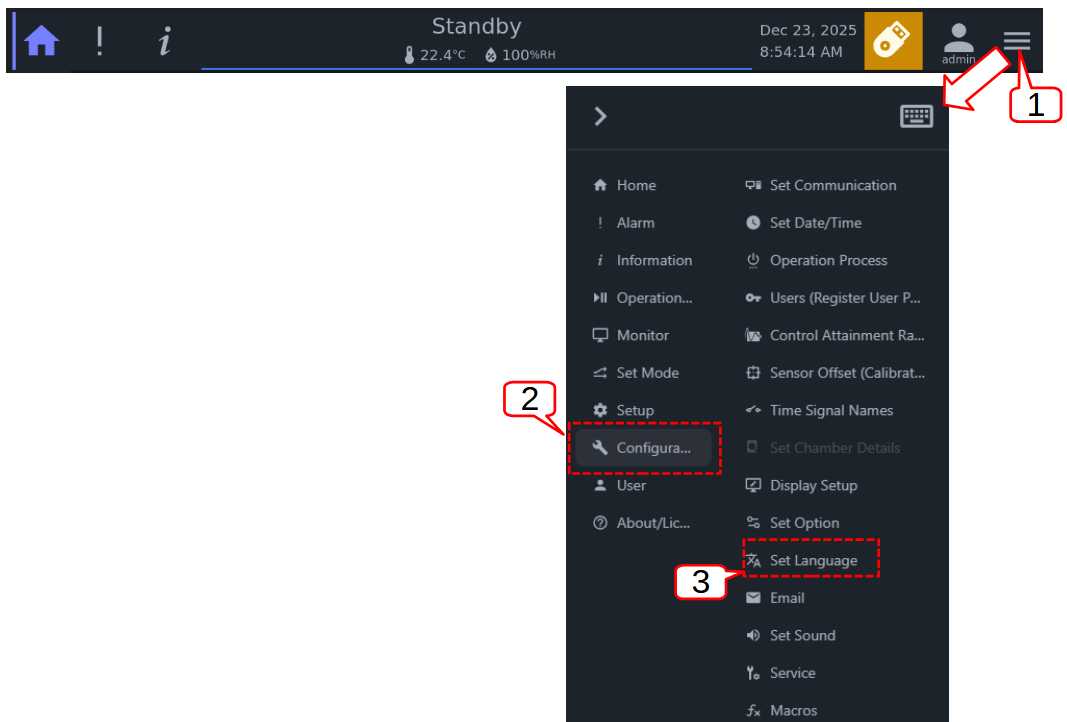
Procedure 3: Select a language via the hamburger button.
-
Press the hamburger button (see callout 1); select Configuration (callout 2), followed by Set Language (callout 3)
-
Select the desired language from the list (in the Set Language page).
This chapter introduces convenient functions provided in this equipment.
The refrigeration capacity is controlled automatically so that it is optimally controlled depending on the temperature (humidity) set point. In ordinary operation, always set the refrigeration capacity to Auto.
| Notice |
|---|
|
When the refrigeration capacity is set manually to the maximum value, it may not be possible to retain the set temperature. Check the setting before conducting a test. There is a possibility that the temperature cannot be maintained and the specimen will be damaged. If the refrigeration capacity setting is changed during operation, control may become unstable, and the temperature and humidity fluctuation of the specification performance may not be guaranteed. (The refrigeration capacity setting cannot be changed during program operation.) |
Note: If an issue occurs during testing, set refrigeration capacity to manual control.
The following procedure outlines the steps to set refrigeration in Auto mode. The procedure assumes that the chamber has already been turned On. If not, set the main power breaker in the ON position. Within a minute, the display on the HMI will come on. The system automatically logs in using the default user account (localhost) to operate the chamber.

Procedure:
-
Press the Hamburger menu (1) in the status bar. Check to confirm the floating keyboard is enabled. A diagonal bar over the keyboard indicates it is disabled. Press the keyboard (2) to enable it. Press Set Mode (3) to access the Set Mode page.
-
Press Constant 1 in the title bar to access Constant 1 configuration page. Three constant modes (No. 1, 2, and 3) are available for configuration and operation. While Constant 1 is selected for configuration, the following procedure applies to any of them.
-
Configuration options are spread over in two pages, as depicted in the figure, to allow configuration for all options, such as Set Point, High & Low Limits, Time Signals and Product Temperature Control (if available). To set Time Signals and Product Temperature Control options, select page 2.
-
Press the set point field of temperature (see arrow). Adjust the set point value of temperature in the keypad. Press the check button to apply the input value; or press anywhere outside of the keypad to close it and apply the setting. Set values take effect immediately after the check button is applied and the keypad closes.
-
Humidity control can be turned ON/OFF as needed. When the Off button is unlit (black), humidity is OFF. To turn on humidity, press the On button. Press the set point field of humidity (see arrow) to adjust the set point value via the keypad. Press the check button in the keypad to apply the input value. Set values take effect immediately after the check button is applied and the keypad closes.
-
As depicted in the figure, refrigeration capacity is available in auto and manual (off, 25%, 50%, 75% and 100%). Default setting is in auto (see arrow). To select between the manual capacity, press the desired refrigeration capacity. The selected option will lit and take effect immediately.
-
When finished setting temperature (and humidity), press the Operation Mode in the Menu bar (1) or press an area near or on the Standby in the status bar (2) to start Constant 1 mode.


For operation details, refer to the GL Chamber Operation Manual.
The following function diagrams explain the behavior and operation of humidity. Humidity control starts after the temperature reaches the set point (within temperature attainment range or longer than temperature attainment time). Humidity control starts in the following timing.
The following diagram depicts the behavior of humidity control when the temperature in the test area is higher than the temperature set point.

The following diagram depicts the behavior of humidity control when the temperature in the test area is lower than the temperature set point.

| Reference |
|---|
| The temperature attainment range of the humidification delay control is set to 1 °C and the temperature attainment time is set to 60 seconds; both settings are fixed and cannot be changed. Even if the attainment judgment criteria on the maintenance setting screen change, they have no bearing in the operation of this function. |
For humidification delay control, its ON/OFF option is under the Set Point panel in Page 1 of Constant configuration page. Refer to Section 3.1.1.
The chamber has four operating modes: Constant, Program, Alarm and Standby. The Alarm mode requires an immediate attention to the chamber operating condition with red alerts, while Standby simply indicates the chamber is in a standby mode and is not under any operating condition. Details of Program mode will be discussed in Chapter 5. Some aspects of Alarm conditions will be discussed in Chapter 10.
This chapter focuses on the constant mode operation. It discusses the method of setting and performing constant value operation. It explains how to start, stop, monitor and extract information of constant value operation.
A constant value operation is a method of keeping temperature and humidity in the test area at constant values throughout the operation. Since the operation is performed in constant values for set points, it is called the constant value operation. The following graph depicts an operation at constant temperature of 30 °C.

For constant mode operation, it is necessary to input the desired temperature and humidity using one of the available constant options. Three constant modes are available for Constant Value Operation. They are Constant 1, Constant 2 and Constant 3.
The following procedure outlines the step for setting up Constant 1 with temperature and humidity. While Constant 1 is selected for configuration, the procedure applies to any of the three constant mode options.
Procedure:
-
If the GL controller system is already on, proceed to Step 2. From a cold start, set the main power breaker in the ON position. Within a minute, the touch-screen display will come on. The system automatically logs in using the default localhost user account to operate the chamber.
-
Press the Hamburger menu (1) in the status bar. Check to confirm the floating keyboard is enabled. A diagonal bar over the keyboard indicates it is disabled. Press the keyboard (2) to enable it. Press Set Mode (3) to access the Set Mode menu.
-
Press Constant 1 in the title bar to access Constant 1 configuration page (see arrow). Three constant modes (No. 1, 2, and 3) are available for configuration and operation.
-
Under the Set Point panel, configuration options are available for Temperature, Humidity and Refrigeration, followed by Time Signals, Product Temperature Control (if available) and High & Low Limits panels through this scrollable page.
-
To set new temperature set point, press the set point field (see arrow). Adjust the set point value in the keypad. Press the check button (or anywhere outside the keypad) to apply the input value. Set temperature mode by selecting Product or Air (See arrow).
-
Humidity control can be turned On/Off as needed. The set point can only be adjusted when humidity is On. When the Off button is unlit (black), humidity is Off. Press the On button (see arrow) to turn it on. Press the set point field (see arrow) to adjust the set point value via the keypad.


In default setting, refrigeration is controlled automatically. This default setting is found in Page 1 of the Constant configuration page. However, under normal circumstances refrigeration capacity can be controlled manually. Refrigeration setting options are available in Auto, Off or manual operation in 25%, 50%, 75% and 100%. The following procedure illustrates these options.
Procedure:
-
The Set Point panel in the figure (below) shows the refrigeration set in Auto mode.
-
To control the refrigeration system manually, select the manual cooling output percentage 25%, 50%, 75% or 100%. Set value takes effect immediately after selection.

| Reference |
|---|
| For details on refrigeration setup, see Section 3.1. When you want to change the mode from Auto to Manual during operation, manually set the capacity of the refrigerator using one of these options: 25%, 50%, 75% or 100%. When refrigeration is changed from Auto to Manual (with specified capacity), refrigeration stops immediately. This may cause control to become unstable. When refrigeration is set to Auto, the manual setting is not reflected in the operation of the refrigeration system. |
Note: Proper testing is required to verify the above reference.
The values set with Absolute High and Absolute Low (Abs High and Abs Low) form the range in which temperature and humidity set point can be entered in Constant Setup or Program Setup. These two values set the extreme high and extreme low set points in a chamber operation. Should a temperature in test area rise above the Abs High set point, alarm will be tripped. The same is true if it goes below the Abs Low set point. The following diagram depicts the behavior of these two situations.

Two different scenarios are described as follows.
Abs High and Abs Low
Criteria used for performing protection in the test area. Set values greater than the temperature set points in the test area by 10 °C or more. If the equipment detects a fault condition, the equipment stops operation after issuing an alarm.
Upper Deviation
Criteria used for performing for specimens. Change the setting depending on the test specimen. If the equipment detects a deviation fault, the equipment stops the header (humidifier) after issuing a warning. When the temperature in the test area decreases to the temperature set point, the equipment returns to the normal control.
The following procedure outlines the steps to adjust Abs High, Abs Low and Upper Deviation for Constant 1. Chapter 5 outlines the steps for Program setup.
Procedure:
-
Confirm that the floating keyboard has been enabled. Refer to Section 2.4.4.
-
From within the main home page, press the Set Mode button and press Constant 1 title bar to open its configuration page (see arrow).
-
Press the Abs. High value field to bring up the numeric input keypad.
-
Enter a new temperature value on the keypad, taking note of the high and low limits. Press the check button to apply the new setting. To cancel the procedure, press the X button. Repeat the same procedure for the upper/lower deviation or humidity setting.


A contact by which your external device can be turned on and off with the keys on the instrumentation can be installed. Time signals can be used to apply voltage to control external devices.
Two time signals are offered in the standard model. Additional time signals (3 through 12) are offered in the model with such options. Default names for these time signals are Time Signal 1, Time Signal 2, etc. They can be changed to reflect the description or purpose of the external device(s). The following two figures depict examples of time signal options set as default names and custom names.
Example 1: Time signal options using default names.

Example 2: Time signal options using default and custom names

Time Signal naming is configured under the Configuration page of the Setup menu. The following procedure outlines the steps to set time signals and customize their names.
Procedure:
-
If the GL controller system is already on and its touchscreen is in sleep mode, tab your finger on the touchscreen and proceed to Step 2. From a cold start, set the main power breaker in the ON position. Within a minute, the touch-screen display will come on. The system automatically logs in using the default localhost user account to operate the chamber.
-
Press the Hamburger menu (1) in the status bar. Check to confirm the floating keyboard is enabled. A diagonal bar over the keyboard indicates it is disabled. Press the keyboard (2) to enable it. Press Configuration (3); then press Time Signal Names (4).
-
To customize the name of Time Signal 1, press the Full name field (1). Enter a new name using the pop-up input keyboard (2). Note: If the input keyboard does not pop up, it has not been enabled; go back to Step 2. Press the Check button (3) to apply the setting. Press the Save button (4) to save the setting. Or, press the Back button (5) to cancel the setting (and press Yes to confirm the action).
-
Short name (second column) and On/Off buttons (third and fourth columns) can also take descriptive names.
-
Time signal can be operated via the On/Off button. This operation can be set using the On/Off button in the Constant configuration page (Constant 1 setting is depicted in the figure below). In Program mode, time signal is identified by its number (discussed in Chapter 5). As shown below, Time Signal 1 (now called Control Ext1) is in the OFF position. To turn it on, press the RUNNING button.
-
The Full name of a time signal will appear in the standard display area during a Constant or Program operating mode as depicted in the figure.


The default name of Constant 1 is constant_1. This name can be changed to something descriptive.
Procedure:
-
Press the Hamburger menu (1) in the status bar. Check to confirm the floating keyboard is enabled. A diagonal bar over the keyboard indicates it is disabled. Press the keyboard (2) to enable it. Press Set Mode (3) to access the Set Mode page.
-
Press Constant 1 in the title bar (see arrow) to access Constant 1 configuration page.
-
Press the constant name field (1), edit the name using the pop-up keyboard (2) and press the check button (3) to apply the setting. The new name takes effect immediately.
-
The same procedure applies to Constant 2 and Constant 3.


Temperature control options are available as Air and/or Product Temperature Control. Since these functions are all optional, the function that is not installed is not displayed or available for operation. Thus the following feature is available only in a chamber with such optional feature(s) installed.
The deviation limits are the allowable air temperature deviation from the product temperature set point upper product temperature control mode. The "plus" value will be added to the product temperature set point to create the "upper" air temperature limit. The "minus" value will be subtracted from the product temperature set point to create the "lower" air temperature limit.
When the product temp. process value is far away from the product temp. set point, the controller will "drive" the air temperature set point to this maximum upper (or lower) deviation limit. As the product temp. process value gets closer to the product temp. set point, the air temp set point will change so that it is less than the maximum upper (or lower) deviation limit.
How to determine the upper and lower deviation limits
If the operator is unsure of what value to set for the upper and lower deviation limits, they can use the following procedure to determine the proper temperature offset. Note: This method requires the operator to have some way of measuring both product and air temperature process values, such as a recorder or a temperature meter.
-
Run the chamber with the selected test product to the desired product temp. set point with the product temperature control turned OFF. Run this "test" in constant mode.
-
When the air temperature has reached the desired set point, record the temperature difference between the product and the air temperature.
-
Use this temperature difference as the deviation limit setting. Enter the value into the "+" setting for product heat up. Enter the value into the "-" setting for product cool down.
-
Execute this product for heat up and cooling cycles in order to determine the upper ("+") and lower ("-") deviation limits.
During product temperature control, the response characteristic of control differs depending on the heat capacity, heat-transfer coefficient, and thermal conductivity of the control target specimen. Since the required control parameters are also changed, set the appropriate values.
The following procedure outlines the steps to adjust Product Temperature Control for Constant 1. Chapter 5 will outline the steps for adjusting Product Temperature Control Program setup.
Procedure:
-
Confirm that the floating keyboard has been enabled. Refer to Section 2.4.4.
-
From within the main home page, press the Set Mode button and press Constant 1 title bar to open its configuration page (see arrow).
-
Press the Product button to turn on Product Temperature control (see arrow). With the Product option set to ON (button lit), the system performs product temperature control. With the Product option set to OFF (button unlit), the system does not perform product temperature control.
-
Scroll up the page and press the Upper Dev. value field to bring up the numeric input keypad.
-
Enter upper deviation value on the keypad, taking note of the high and low limits. Note: The system ignores any value higher or lower than the required range. Press the check button (or anywhere outside of the keypad) to apply the new setting. New value takes effect immediately.
-
Repeat the process for the Lower Dev. option. The X button on the keypad can be used to cancel the configuration.


Before starting the operation, check to confirm that the settings of the absolute high/low limits of temperature (and humidity) warning on the Product Temp Protector device for protecting specimen, as specified in the chamber User Manual, have been performed properly.
The start/stop operation is performed in the Operation Mode page, accessible via the Operation menu or button (in the Home page).
| Reference |
|---|
| When testing electronic components, ensure condensation has not affected the specimen. Condensation occurs when the surface temperature of the specimen is lower than the dew-point temperature of the air in the test area. To avoid condensation of the specimen, it is necessary to perform temperature-only operation in advance and start temperature/humidity control operation after the surface temperature of the specimen reaches equilibrium with the temperature in the test area. In addition, condensation can be avoided by using humidification delay control. If the temperature and humidity in the test area is 85 °C and 85% RH, respectively, the dew-point temperature of the air in the test area is 80.9 °C. Therefore, condensation occurs if the surface temperature of the specimen is less than 80.9 °C. |
The following table lists the dew-point temperature.
| Dry-bulb Temp (C) | Relative Humi (% RH) | Dew-point Temp (C) |
|---|---|---|
| 60 | 85 | 56.5 |
| 70 | 85, 90 | 66.3, 67.7 |
| 85 | 85, 90 | 80.9, 82.3 |
The following procedure outlines the steps to start a constant operation mode for Constant 1. This procedure also applies to Constant 2 and Constant 3.
Procedure:
-
From within the main home page, press the Operation Mode menu (1) or button (2). Refer to Section 2.3.2 for details.
-
Check the set points (Temperature, Humidity) displayed in the panel of Constant 1 (see arrow). Note: To check other options, it may require accessing the Constant 1 setup page.
-
Press the Constant 1 panel and press Yes in the Attention box to confirm the action to start the operation.


The following procedure outlines the steps to stop a constant operation mode for Constant 1. This procedure also applies to Constant 2 and Constant 3.
Procedure:
-
From within the main home page, press the Operation Mode menu (1) or button (2). Refer to Section 2.3.2 for details.
-
Press the Stop button (1) or Constant 1 panel (2), then press Yes in the Attention box (3) to confirm the action.
-
Constant 1 mode is terminated and the system returns to a standby mode.
-
To save energy, turn off the circuit breaker when the equipment will not be used for a long time. If the circuit breaker remains in the ON position, the heater that warms up the refrigerator also remains energized.


| Notice |
|---|
| If the chamber operation is stopped in low temperature operation, depending on the ambient condition, condensation may occur on the equipment surface. In some cases, water puddles may occur in the chamber installation location. To avoid condensation effect, return the temperature in the test area to ambient temperature before stopping operation. |
Home and Monitor pages display different level of information about the current operating mode or condition of the chamber. This section outlines and explains in detail how to read information on each page.
Chamber operating mode is displayed in the middle of the status bar at all time. As depicted in the following figure, the chamber is in Constant mode, performing Constant 2 settings. Temperature and humidity process values are also displayed.
Detailed information of Constant 2 (i.e., current operating mode) is displayed in the Standard Display area indicated by labels 1, 2 and 3 (in the figure). Their descriptions are listed in the following table. Refrigeration and time signals can be controlled during operation under the setup page of Constant 2.

| No. | Description |
|---|---|
| 1 | Displays set point(s) and process value(s) of temperature (Air/Product) and humidity. |
| 2 | Displays temperature/humidity set points and refrigeration capacity. Set points can be used to reference operation progress in Item 1. |
| 3 | Displays time signals and their statuses. Note: On/Off manipulation can be controlled in the Set Mode page. |
The most detailed display page for any operating mode is the Monitor page. Six different submonitor pages provide details of the chamber operating condition.
Starting with Page 1, the display focuses on the main information of the operating condition, namely, the set points and process values of temperature (Air or Product) and humidity. The following two figures illustrate how information is displayed for Constant and Standby modes. Display information for Program mode is deferred to Chapter 5.
Monitor Page 1: Standby Mode

Monitor Page 1: Constant Mode

| No. | Description |
|---|---|
| 1 | Displays set points and process values of temperature (Air/Product). In Standby mode, set points are OFF and process values are indicated by --- for an unavailable option. |
| 2 | Displays set points and process values of humidity. In Standby mode, set points are OFF and process values are indicated by ---. Refer to Item 1. |
Page 2 of Monitor displays details of Time Signal outputs and operating status of the refrigeration system. The following figures depict Page 2 of Monitor for Standby and Constant modes, respectively.
Monitor, Page 2: Standby Mode

Monitor, Page 2: Constant Mode

| No. | Description |
|---|---|
| 1 | Displays set points and process values of temperature (Air/Product) and humidity. In Standby mode, set points are OFF and process values are indicated by ---. |
| 2 | Displays operating status of the available time signals. |
| 3 | Displays refrigeration system status controlled by the PLC. A two-stage refrigeration system is shown in the display. Since the PLC controls the refrigeration system and its stages, users have no control over it. The display mainly provides information for the user how the refrigeration is being controlled and operated, in terms of power, discharge or evaporation temp., gas pressure or temperature. |
| 4 | Edit button: Click to edit the layout of this page. |
Page 3 of Monitor displays details of chamber operating mode: Standby, Constant and Program. Details of the display in Program mode will be discussed in Chapter 4. The following figures depict display details for Standby and Constant.
Monitor (page3): Standby Mode

| No. | Description |
|---|---|
| 1 | Displays current condition or operating mode |
| 2 | Displays trend graph of recent data and set mode prior to current (operating) mode: Standby. Details of this display will be provided later. |
| 3 | Edit button: Click to edit the layout of this page. |
Constant Mode: The constant mode page.

| No. | Description |
|---|---|
| 1 | Displays detailed parameters of Constant mode. |
| 2 | Displays trend graph of recent data and set mode prior to current (operating) mode: Constant. Details of this display will be provided later. |
| 3 | Edit button: Click to edit the layout of this page. |
Page 4 of Monitor displays a summary of the current operating mode. It lists all the parameters associated with the current operating mode, including control types and their status, such as temperature (On/Off), humidity (On/Off), time signals (On/Off), refrigeration system (On/Off), etc.

Page 5 of Monitor is reserved for displaying details of program output and its operating status. In Standby or Constant mode, this page is blank. Chapter 5 will discuss this page in detail.
Page 6 of Monitor, called Trend Graph, displays detailed scatter plot of data collected from the chamber. This trend graph allows the operator to view a scatter plot of data collected during chamber operation. Data collection can occur in two distinct settings: Always and Running. Default setting is Always, which means data will be collected during any operating mode. Section 6.3 ("Set Sampling") provides details of these settings.

By default, the trend graph provides a scatter plot of data points collected during the last hour. Various options of plot range of data accumulated more than one hour can be selected. Data points collected during operation are stored in the internal memory of the GL controller system; as a data log, it remains stored in internal memory regardless of a power outage or a system shutdown. Data can be downloaded (in whole or in portion) and stored on an external USB device (if connected) or on the local computer if the GL system was accessed remotely.
Trend graph is made up of different components, as depicted in the following figure. Trend graph in program mode displays similar components (discussed in Chapter 5).

The nine (9) components called out in the trend graph (above) are described as follows:
-
Trend Graph: Data collected from the chamber are rendered as trend graph via scatter plot methodology; data points of temperature, air temperature, product temperature control and humidity are plotted as a function of time. The y-axis represents the scale of these values. The x-axis represents the data logging runtime.
-
Trend Graph Manipulation Buttons: Control and management of trend graph are provided by the manipulation buttons. Detailed functionality and operation of these buttons are discussed in a separate section (Section 4.9.8).
-
Line Graph: Different styles of graph--solid lines, dashed lines and color--are used to designate each type of data points for visualization. Solid lines represent process values, dashed lines set values, etc.
-
Y-axis Label: The y-axis displays the selected type of data points to be plotted (temperature, product temperature control, humidity). These values are populated based on the selection of the Graph View under item 2 (above).
-
X-axis Label: The x-axis displays log time of the data. Default plot range is one hour with grids; each grid sets a 5-minute time-scale.
-
Y-axis Title: The y-axis title provides clarity to the type of graph being represented.
-
Legend of Trend Graph: The legends provide identity of each item on the trend graph designated with color coding.
-
Status Bar: Displays progress bar of each operating mode.
-
Status Mode: Displays chamber operating mode with date and time. If a program is being executed, program name, slot number and step number will be displayed.
The following is a detailed list of the Manipulation Buttons, item 2 in the previous figure (Section 4.9.7).

-
Auto Refresh: This Auto Refresh button reconstructs the graph to include data points up to the current time.
-
Plot Range Selectors: Default plot range is one hour. With this button (and its options), plot range can be configured up to 12 hours or 7 days. Custom set range is also available via the Custom Time Span option.
-
Download Button: Data can be downloaded for backup on an external USB (or local) device and saved in CSV format. Date/time format can be downloaded in UTC or local time, as indicated by the drop-down menu options. Data log is accumulated and stored in the GL controller system internally; it remains stored in internal memory regardless of a power outage or a system shutdown. It is strongly recommended to download and clear data log regularly. Data accumulation increases in size almost exponentially. As a result, storage space may be wasted; large data file may affect the operation and performance of the GL control system. Refer to Section 6.3 for details how to clear data file.
-
Plot Configuration: Elements of the trend graph can be configured via this button.
-
Pan/Zoom Controls: The collapsible Pan/Zoom Controls button allows the operator to control and adjust the viewable section in the trend graph. The up/down arrows can be used to collapse/expand the drop-down menu to manipulate the trend graph as follows.
-
Zoom In: The Zoom In button allows the operator to zoom into a small section of the trend graph. Depending on the degree of zooming, the display area will be confined to a small set of data points ranging between minutes to hours. To reset the trend graph, click the Zoom Extents button, select Last Hour from the drop-down menu, then click the Auto Refresh button.
-
Zoom Out: The Zoom Out button does the opposite by allowing the operator to zoom out on the trend graph, thereby giving the operator an expansive view of the trend graph. To reset the trend graph, click the Zoom Extents button, select Last Hour from the drop-down menu, then click the Auto Refresh button.
-
Move Up: This button allows the operator to move up the graph along the vertical axis to adjust the viewable area of the scatter plot. To reset the trend graph, click the Zoom Extents button, select Last Hour from the drop-down menu, then click the Auto Refresh button.
-
Move Down: This button allows the operator to move down the trend graph along the vertical axis with the purpose to adjust the viewable area of the scatter plot. To reset the trend graph, click the Zoom Extents button, select Last Hour from the drop-down menu, then click the Auto Refresh button.
-
Move Left: This button allows the operator to pan left on the trend graph, offering a quick preview of a plot of data points tracing back the time in hours or days. With this feature, the operator can quickly gain a preview of past data points which the operator may have missed.
-
Move Right: This button does the opposite to Move Left by allowing the operator to pan right on the trend graph to the current time. To reconstruct the trend graph to contain the most recent data points, the Auto Refresh button allows the quickest operation.
-
If data from Section 4.9.7 were downloaded via the Export CSV and not via the Export CSV (Local Time) option, the date/time of the data must be properly converted prior to any attempt to analyze the data. The recorded time of the data points is based on a UTC (or Universal Time Coordinated, previously referred to as the GMT) instead of the local time. To preserve the integrity of the CSV file and its UTC time stamp, do not rename the data file with MS Excel extension or attempt to open it directly with MS Excel. Any attempt to force open it in MS Excel will result in the wrong time conversion as shown in the following figures.
The following figure displays the CSV file which was directly opened with MS Excel. The time stamp in the first column is wrong; it is still based on UTC time stamp indicated by the arrows.

The following figure displays the same CSV file which was properly imported into MS Excel with the correct time stamp conversion for local time indicated by the arrows.

The proper way to handle this CSV file is to import it using the following procedure to render the correct conversion of the UTC time to the local time on all data points.
Complete the following steps:
-
Select Trend in the main menu bar
-
Click the Download button (item 6 in the previous section) to download the data (current view or entire data) in CSV file
-
Launch MS Excel and start a new blank spreadsheet
-
Click the Data ribbon
-
Click From Text/CSV (that appears under the Home ribbon)
-
In the Import Data Window explorer, open the Downloads folder and select the downloaded CSV file (in step 2) and click the Import button (in the bottom).
-
Click the Load button to load data into the current spreadsheet.
-
To save the current spreadsheet as Excel Workbook, click Save As and follow the standard steps to complete the process.
This chapter discusses and explains the setting methods for performing program operation that include creating, editing and managing programs, starting and stopping program operation, monitoring program display screens.
The features and functionality of program operation are available in two modes in separate panels: Program Setup and Program Run. With the Program Setup mode, the operator can create a program; open, view or edit the program; preview the output of the program prior to executing it; edit and/or overwrite an existing program; delete program from the list; rename program on the list; move a program to a new location; download a program (in JSON file) as a backup or archive; upload a program from a USB (or a local computer) to the GL controller system, and much more. With the Program Run mode, the operator can start or stop a program. These two features are outlined in Section 5.2 and 5.3, respectively.
A program operation changes the settings of the temperature and humidity in the test area in accordance with the instructions and steps contained in the executed program. Instructions in the program control temperature and humidity operation based on the set or specified parameters. The following diagram depicts a sequence of control operation specified by the time, temperature, humidity and ramp for each step.

The Program Setup panel is accessible via the Set Mode menu. The following figure depicts an empty Program Setup panel with no programs on the list. The panel sets a default program slot, with program number and name as Program 1, to start a new program. The plus symbol indicates the slot is available for creating (i.e., adding) a new program.

The following figure depicts a Program Setup panel that contains programs on the list as well as empty ones (slot 3 and 5).

Slots 1, 2 and 4 are being occupied by programs with names and number of steps displayed. Slots 3 and 5 are empty; hence, the plus symbols. The GL controller system automatically opens a new slot for the next program as soon as the current one is occupied by a program. However, if programs were initially created in sequential order from slot 1 to 4 (with slot 5 automatically open for the next program), and then a program in slot 3 is deleted, that slot remains open. A new program can be created to occupy slot 3 again. The reason slot 3 still remains open is because program PAUL4 occupies slot 4, forcing slot 3 to stay on the list, for it was pre-allocated before slot 4. This design was carefully considered to prevent randomly reshuffling programs into different slots that might create confusion after deleting a program out of order. However, if PAUL4 is deleted, then slots 4 and 5 will collapse, forcing only slot 3 to remain open for the next program.
The number of programs that the GL controller system can hold is limited to its available storage space. In the current model, that storage space is 16GB. Data log and configuration files are also stored here, with data log files most likely occupying the most space. For this reason, it is highly recommended to back up data log and clear data log on the GL controller system frequently. Chapter 6 will discuss how to set sampling and clear data logs.
There are only two options associated with creating a new program: (1) create a new program in the selected slot, or (2) import a program file from an external USB device (or a local computer) into the selected slot. Option (1) opens the program editor, while option (2) searches for an external device connected to the USB port (or a local directory) to open a file browser to import the program file.
The Program Setup panel has three tabs (or subpages) to provide programming features and options for the selected program, as depicted in the following figure. Their features are listed and described in the table that follows.

| No. | Name | Description |
|---|---|---|
| 1 | Step-wise Programming | Program instructions can be created step by step. Refer to Section 5.3.1 for details. |
| 2 | Table-wise Programming | Program instructions can be created by filling in the table elements. Refer to Section 5.3.2 for details. |
| 3 | Details | Details of each program operation mode can be configured. Refer to Section 5.3.3 for details. |
Step-Wise Programming: A program can be put together by assembling instructions step by step. Parameters such as time, temperature/humidity, product temp control option, type of control mode (i.e., ramp, ramp rate or soak) can all be configured on the fly using the pop-up step panel that opens next to the selected step (see arrow). Note: The step panel (depicted in the following figure) is actually open and placed between the menu bar and Step 1; it is shown for illustration only. The next figure illustrates the actual layout of this pop-up panel.

The following figure depicts the layout and components (and parameters) of the selected step for editing.

| No. | Name | Description |
|---|---|---|
| 1 | Step | Displays the step number being edited. |
| 2 | Set Temp/Humi | Set point fields for temperature/humidity. Note: Humidity must be enabled first (via Item 3 below) in order to enter the set point. |
| 3 | Enable | Displays product temperature control button (i.e., Product) and humidity control (Enable) button. When the Product button is activated, product temperature control is turned On. If the chamber in question does not have product temperature control feature, this button is not available. When the Enable button is activated, humidity control is set to ON; otherwise, humidity is set to OFF. See Section 5.3.1 for details. |
| 4 | Ramp Control | Displays buttons to enable temperature and humidity ramp control. |
| 5 | Soak Control | Displays buttons to enable temperature and humidity soak control. |
| 6 | Duration | Set the time duration of a step in hours, minutes and seconds for temperature and humidity. |
| 7 | Time Signals | A list of Time Signals can be set to ON/OFF. |
| 8 | Details | Time Signals, refrigeration, and counter settings can be controlled here, in addition to the Pause button. |
| 9 | X | Displays cancel button. |
| 10 | Previous Button | Displays button to navigate to the previous step. |
| 11 | Accept Button | Displays accept button to enter changes to the current step. |
| 12 | Next Button | Displays button to navigate to the next step. |
Table-Wise Programming: A program can be put together by filling in the value for each parameter (such as time, temperature, humidity) and selecting control mode such as product temp, ramp, soak, refrigeration, and time signals can all be selected and configured in one step via this method.

Details: Program operation modes and other parameters (such as program start conditions, end mode, etc.) can be configured in the Details tab. The upper and lower limits of the input range are determined by the temperature (and/or humidity) range of the equipment associated with the Abs.High and Abs.Low limits specified in this tab. Deviation High/Low values, as well as Deviation Soak Control (Dev.Soak Ctrl.) are configured here. Section 5.3.3 discusses these features in detail.

This section outlines the steps to create a program using the step-wise editor page.
Note: The following procedure outlines the steps based on the HMI (touch-screen) operation. For a remote access, the procedure is identical starting with Step 2 by replacing the word press with click.
Procedure:
-
If the GL controller system is already on, proceed to Step 2. Otherwise, set the main power breaker in the ON position. Within a minute, the HMI will come on.
-
Press Set Mode in the menu bar or the Set Mode button in the home page.
-
Press Program 1 slot (plus symbol), followed by the Editor button (pen icon) in the pop-up window. The X button can be used to cancel the action.
-
Press the body of Step 1 (see arrow). To cancel the current setting, press the X button. We outline from top to bottom on how to apply each parameter as follows.
- Temperature: Enter the temperature set point.
- Humidity: Enable humidity using the Enable button (below the Humi set point field); then enter the set point value in the Humi field. Note: If humidity is not enabled, the numeric value in the Humi field does not take effect. A new numeric value can only be entered if the Enable button is activated. If Ramp Ctrl or Soak Ctrl (to be discussed below) is selected, humidity will be enabled.
- Product Temperature Ctrl: The chamber system used for this illustration (see above figure) does not have the Product Temperature Control feature. It is therefore empty and the enable button is blank. However, if the feature is available, to turn it on, simply select the Product button. When selected (i.e., set to ON), the system performs product temperature control. Refer to the special note at the end of this section for details on the Product Temperature Control operation.
- Ramp Ctrl: Enable the ramp control for temperature and/or humidity, respectively using their appropriate buttons. When enabled (i.e., set to ON), ramp control is performed between the set point of the previous step and that of the current step. If ramp control is OFF, temperature (or humidity) is maintained based on the set point for this step. If ramp control is performed in Step 1 (such as in this example), the previous set point will be based on the start condition in the Details setup tab (see Section 5.3.3 for details).
- Ramp Rate: Ramp rate measured in degree per minute is determined internally by the system based on the difference between the two set points and duration (hence, °C/m). When a new time duration is entered, the value of ramp rate will change accordingly. Ramp rate value can be displayed down to three significant figures (e.g., 0.002). If these three digits rendered roughly to 0.000, the display will flag an error. This error will occur when the duration time is large and the difference between the two set points is small.
- Soak Ctrl: When selected for temperature, soak time control will maintain operation at the temperature set point. When soak time control is set to ON, after the operation of the step is started, the equipment waits until the process value reaches the control attainment range, and it then starts counting the time. Thus, the soak time in the temperature set point is the same as the setting time. If disabled, the system does not perform soak time control, and the counting starts at the same time as the start of the step operation. Note: Soak control and ramp control cannot be performed together simultaneously. One or the other can be enabled, not both. If Soak Ctrl is selected, Ramp Ctrl which was previously selected will be disabled (deselected).
- Duration: Enter duration in the format of hours, minutes and seconds. The system can accommodate hour value up to four digits, e.g., 9999. The range of values for minute and second is between 1 and 59.
- Time Signal: Set the time signal contacts; signals 3 to 12 are optional. If an option is not installed, the time signal key (button) cannot be selected. Descriptive name can be assigned to each time signal to identify each contact; refer to Section 7.7 for details. For each available time signal, set the desired time signal to ON or OFF; when ON, the system outputs the time signal; immediately after the program moves to the next step, the time signal changes the contact output setting; when OFF, it does not output the time signal.
- Details: Further control of the program step can be configured in this subpage. Press the Details button (see arrow in the figure above) to configure refrigeration capacity, time signals, loop counter, and pause function. Refer to the special note at the end of this section for details on refrigeration and counter controls. When Pause is set to ON, program execution is paused when this step is ended. The Pause icon also appears next to the time duration on the Step panel. To continue to the next step after the program is paused, select the Resume/Play button (see Section 5.6). When Pause is set to OFF, program continues to the next step.
- Apply Settings: Press the checkmark button (see arrow, above) to apply the settings and close the current Step panel. Note: The previous (<) and next (>) buttons can be used to navigate between the previous and next steps without closing the Step panel.
-
To create Step 2, repeat the procedure in Step 4. Additional steps can be created using the same process.
-
To quickly create an empty step, press the body of the next available step (plus symbol), followed by the checkmark button.
-
To edit an existing step (say, Step 2), press the body of the step (see arrow). Modify the contents of Step 2 in the step panel (see arrow). Press the Details button to adjust any configuration. Press the checkmark button to apply the new settings. Press the Save button (which becomes visible after closing the step panel with the checkmark) to save the program.
-
To traverse between existing steps within the program, with Step 2 selected as the starting point (see arrow), press the left-arrow button (see arrow) or the right-arrow button (see arrow). Press the checkmark followed by the save button to save the new setting.
-
A selected step may be moved backward or forward using the Move Before (<) or Move After (>) button. Press the Step 2 header (see arrow), then press the Move Before button to move Step 2 to before Step 1. As a result, the locations of Step 1 and Step 2 are swapped. To move Step 2 to the position after Step 3, press the Step 2 header (see arrow), then press the Move After button. As a result, the locations of Step 2 and Step 3 are swapped.
-
To insert a step before or after Step 2, press the Step 2 header (see arrow), then press the Insert Step Before or Insert Step After button to insert a new step in the desired location. The Delete Step(s) button can be used to delete the selected step (Step 2, in this case).
-
To copy contents of Step 2 into a new step between Step 2 and Step 3, press Step 2 header (see arrow) followed by Copy Step(s), then press Step 2 header (again) to confirm the selection; press Step 3 header and press Yes to confirm the action. To cancel the operation, press No followed by Cancel in the lower corner.
-
To copy a range of steps (say, Step 1 through 2) and put them in between Step 2 and Step 3, press Step 1 header (1) followed by Copy Step(s), then press Step 2 header (2) to confirm the range, press Step 3 header (3) and press Yes (4) to confirm the action. To cancel the operation, press No followed by Cancel in the lower corner. (Actual programming examples will be provided later.)
-
To delete a range of steps (say, Step 2 through 3), press Step 2 header (1) followed by Delete Step(s), then press Step 3 header (2) to confirm the range and press Yes (3) to confirm the action. To cancel the operation, press No followed by Cancel in the lower corner. Note: Operation can be done in reserve order, namely, starting with Step 2 as the initial step followed by Step 1.
-
To save program (in the current slot), press the Save button in the secondary menu (see top arrow). To save program in the next slot, press the Save button in the secondary menu (see bottom arrow).


| Reference: Product Temperature Control |
|---|
| As stated in Step 4, when product temperature control (if available) is On, the system performs product temperature control. The deviation limits are the allowable air temperature deviation from product temperature (P.Temp) set point under P.Temp control mode. The "plus" (+) value will be added to the P.Temp set point to create the "upper" (or High) air temperature limit. The "minus" (-) value will be subtracted from the P.Temp set point to create the "lower" (i.e., Low) air temperature limit. When the P.Temp process value is further from the P.Temp set point, the controller will "drive" the air temperature set point to this maximum upper (or lower) deviation limit. As the P.Temp process value gets closer to the P.Temp set point, the air temperature set point will change such that the effect is less than the maximum upper (or lower) deviation limit. The High and Low deviation can be adjusted via the Details tab by setting the Dev.High and Dev.Low values in the High & Low Limits panel in the appropriate fields. Refer to Section 5.3.3. |
| Reference: Dev.High and Dev.Low Limits |
|---|
| If the operator is unsure of what value to set for the Dev.High and Dev.Low, the following procedure can help to determine the proper temperature offset. Note: This method requires that the operator has some way of measuring both product and air temperature process values, such as a recorder or a temperature meter. (1) Run the chamber with the selected test product to the desired P.Temp set point with product temperature control turned OFF. Run this "test" in constant mode. (2) When the air temperature has reached the desired set point, record the temperature difference between the product and the air temperature. This temperature difference will be used as the deviation limit setting. (3) Enter the recorded value (from Step 2) into the (+) setting for product heat up. Enter the value into the (-) setting for product cool down. (4) Execute this procedure for heat up and cooling cycles in order to determine the upper (+) and lower (-) deviation limits. (5) During product temperature control, the response characteristic of control differs depending on the heat capacity, heat-transfer coefficient, and thermal conductivity of the control target specimen. Since the required control parameters are also changed, set the appropriate values accordingly. |
| Reference: Setting Refrigeration |
|---|
| Occasionally, automatic refrigeration control during linear ramping, test steps may cause non-linear ramping results. If this was observed to be the case, please contact ESPEC North America Inc. customer service for assistance; you will be provided with some guidelines on how to program your test profile to use manual refrigeration control for better ramping. Additionally, there are some specific circumstances where you may be required to use manual refrigeration control to run a specific test profile. An example of this kind would be to use manual refrigeration to execute a "pre-chill" function with the refrigeration system of your test chamber. This "pre-chill" function can be used to maximize the temperature change rate of the chamber. This setting should be used when transitioning from a set point above ambient to a low temperature. The pre-chill setting is accomplished by setting the manual refrigeration control to 25% output 3-5 minutes before the transition taking place. This will start the refrigeration system and pre-cool the cascade of the system to ensure that maximum capacity is available for the transition. When the temperature transition is started, the refrigeration should be returned to “auto” control. This method can be used in constant mode or program mode operation. Note: When refrigeration is set Auto, the manual setting is not reflected in the operation of the refrigeration system. You cannot change the refrigeration capacity during operation. Set the refrigeration capacity when setting the program prior to operation. |
| Reference: Setting Counter Loop (Step-Wise Programming) |
|---|
| In a counter loop, the number of repetitions of a step or group of steps can be configured. The process consists of: (1) Repeating start step (step that is started from the second time around and continues there after), (2) Repeating end step, (3) Repeat cycle When counter setup is enabled, steps from the start step (1) through the end step (2) are repeated until the repeat cycle count (3) is completed. To set up counter, select the start step and end step (with step number 2 and greater) to mark the loop. The loop count sets the condition to repeat these steps until the number of loops is met. The conditions for selecting start step and end step are: (A) 1 ≤ start step < number of registered steps (B) Repeating start step < repeating end step; end step > 1 (C) There is no limit set for the number of repeat cycle. Note: The total number of operations resulting from the repeating start step (1) to the repeating end step (2) is the number of repeat cycle (3) plus 1. This means the first loop must be completed before the repeat cycle commences. Therefore, if step 1 and step 3 are to repeat five times, the input number of cycle is four (i.e., 4 + 1). Non-continuous steps can be marked to be executed repeatedly. Multiple loops (or counters) can exist within a program. In the Step-Wise Program editor, each counter loop is marked with a bracket that covers the start step and end step. To mark the start step, select the desired step and invoke the Details subpage to configure the counter. Refer to Section 5.3.2 for details on counter setup in Table-Wise Programming. |
The following are few examples and guidelines on how to set up counters in a program. Note: Counter A and Counter B are simply counter labels. The GL controller supports multiple counters in a single program. Thus Counter A, Counter B, Counter C, etc., can be used to identify each individual counter.
Example 1: Two counters in a program, each contains a group of steps, can be set up such that they perform the loop independently in the order that they appear (from left to right in the diagram).

The following figure depicts the actual markings of these two separate counters within the program.

To study the behavior and output of the above program, perform the following steps.
Procedure:
- Create program as shown above (via the Setup menu).
- Save the program
- Execute the program (via the Operate Mode menu)
- Access the Monitor menu
- Select Subpage 3
Example 2: Two counters nested in a program; the inner counter (Counter B) is performed first inside Counter A.

The following figure depicts the actual markings of these two separate counters nested inside the program.

Example 3: On paper, two counters nested inside one another on the same start and end steps can be considered as "combining" the number of cycles.

In actual programming, these two counters are nothing more than the combined number of cycles, thus, using a single loop to achieve the goal by repeating the number cycles 9 (6+3) times.
Example 4: Here is an example of an unusual counter setup which should be avoided. Logically, it is an impossible setup in which the start steps and end steps of the two counters intersecting one another. With the GL controller, it is not an impossible but an abnormal setup. To avoid unpredictable program behavior and outcome, no two (or more) counters should be configured with their start steps and end steps intersecting each other, as shown below.

The following figure depicts the actual markings of these two separate counters intersecting their start steps and end steps which form a strange outcome during program execution.

The program starts from Step 1 to Step 5; these steps are marked by counter 1. When it reaches Step 5, it returns to Step 1 to repeat the cycle marked by that counter (loop 1). Once it completes the cycle at Step 5, it proceeds to Step 6 in the second counter and continues to Step 9. Then it returns to Step 3 to repeat its cycle marked by counter 2. Here is where weird things start to behave: when it reaches Step 5, it returns to Step 1 for counter 1 again until the number cycle is fulfilled (in this case one time). Then it moves to Step 6 and continues to Step 9 until its cycle is complete. It then continues to the next step (Step 10). This weird behavior is depicted in the following figure, with all the steps carried out during execution mapped at the bottom of the screenshot, where both counters repeat the loop once (a total of two cycles in each counter).

Example 5: Two loops overlapping each other by the end step of the first and the start step of the second loop. Since the repeat cycle marked by each counter is controlled by the end step, a strange behavior occurs when loop 2 returns to its start step that also marks the end step of loop 1.

Program starts with Step 1; when it reaches Step 3, it returns to Step 1 to complete the first loop (counter 1). When the repeat cycle is complete at Step 3, program continues to Step 4 through Step 6, which it then returns to Step 3 to complete the cycle required in counter 2. However, Step 3 marks the repeat cycle for counter 1, which the program must loop back to Step 1. This means every time counter 2 needs to complete its cycle by returning to Step 3, the program is forced to execute counter 1 repeat cycle.
Bottom Line: Program structures in Example 4 and 5 should be avoided.
This section outlines the steps to create a program using the table-wise editor page.
Note: The following procedure outlines the steps based on the HMI (touch-screen) operation. For a remote access, the procedure is identical starting with Step 2 by replacing the word press with click.
Procedure:
-
If the GL controller system is already on, proceed to Step 2. Otherwise, set the main power breaker in the ON position. Within a minute, the touch-screen display will come on.
-
Press Set Mode in the menu bar or the Set Mode button in the home page.
-
Press Program 1 slot (plus symbol, first arrow), followed by the Editor button (pen icon, second arrow) in the pop-up window.
-
Press the Table-Wise subpage (1) to turn on the table-wise editor. The program begins with Step 1 with some preselected parameters, such as the High/Low Dev., preconfigured in the Details page.
-
Complete Step 1 by entering parameter values for temperature, humidity and operation time (hour, minute and second) in their designated fields. Click the radio button under Temperature Mode (see arrow) to select control mode from the list. Repeat the same procedure for humidity mode (see arrow) and refrigeration capacity mode (see arrow). Each time signal (TS) can be turned On by placing a checkmark in the box; press on the box under the desired TS. Note: Time signal control can be turned On/Off after the parameter values are entered. Therefore, Step 1 instructions involve a 2-step process, with time signal control being the last step to complete.
-
Create Step 2 by pressing the Append button and filling in all the required fields with parameter values. Additional program steps can be repeated using the same process. A program consisting of five steps is depicted below.
-
A new step can be added (inserted) in between existing steps via the step manipulation menu, which can be invoked by pressing on an input field (e.g., Hrs field or Set Point field) in the selected step (until the menu appears). In the figure, the Hrs input field of Step 3 (see arrow) was momentarily depressed to bring up the step manipulation menu (red rectangle), which consists of add above, delete (x) and add below buttons. A new step can be inserted above or below an existing step using the (+) above or (+) below button. Press the (+) button at Step 2 to insert a new step in between Step 1 and Step 2. Press the (+) button at Step 4 to insert a new step in between Step 4 and Step 5.
-
The step manipulation menu can be shifted along existing steps with the delete (x) button on the selected step (see arrows). To delete Step 2, press the input field of Step 2 (see arrow), then press the delete (x) button. To delete Step 4, press the input field of Step 4 (see arrow), then press the delete (x) button.
-
To save program (in the current slot), press the Save button in the secondary menu (1). To save program in the next slot, press the Save button in the secondary menu (2).


| Reference: Setting Counter Loop (Table-Wise Programming) |
|---|
| In the Table-Wise Program editor, each counter is created by the count number placed in the desired step marked as the end step for that counter (loop). The counter setup process is easier to manage than that for the Step-Wise Program Editor: select a desired step to mark the end step for the counter; input the number of repeat cycles, then set the start step. The principles of counter setup remain the same. Refer to Section 5.3.6 for examples on counter setup. |
The Details tab contains four separate panels to provide further control and operation of the program.

Program Name: Enter or edit program name. The above figure depicts an example how to edit or enter program name and save the changes. Note: If program name is not specified, Program #? will be used, where ? will be the numeral in sequence of 1, 2, 3, etc.
Program Start Conditions: When you want to perform ramp operation for temperature and/or humidity in Step 1, the Temp and Humi must be enabled. Turn on Process Value when you want to start process control from the current temperature and humidity in the test area. Turn on Set Point and enter the desired value(s) when you want to set arbitrary temperature and humidity for ramp control. The following figure depicts Temp and Humi start conditions using set point values.

When the Set Point option is selected, the start temperature and humidity can be changed. The ramp operation is to control the temperatures from set point of the previous step to that of the present step at a certain ramp. The following figure depicts graphically how ramp control operation is performed from Step 1.

Ramp control operation (temp or humi) will not be performed based on the following two conditions:
- When the start condition (temp or humi) is set to OFF in Step 1.
- When the humidity control in the previous step is set to OFF in ramp control (humidity).
Program End Mode: End mode condition can be set to control (i.e., instruct) the equipment what to do next after program operation is ended. Conditions include: Stop the chamber; hold the last step of the current program; start Constant 1, 2, or 3; start next program (with step number).
By default, Stop is selected for end mode. In this mode, the chamber will stop the operation after the program is ended. A different end mode can be selected simply by activating the appropriate button, with the exception of program mode that involves several steps (explained next).
To start a new program after the current program is ended, proceed as follows.
Procedure:
- Select the Program button.
- Select the "program name and step number" button.
- From the Select a Program pop-up window, select the desired program and press Accept
- From the Select Program Step pop-up window, select the step number to start and press Accept. By default, Step 1 is selected.
- Press Save to update the changes.
High & Low Limits: The values set with Abs.High and Abs.Low are the range of values in which data can be entered during programming in the Program Setup page. These values form the range in which temperature and humidity set point can be entered in Program Setup (similar to Constant Setup, see Section 4.4). These two values set the extreme high and extreme low set points in a chamber operation. Should a temperature in test area rise above the Abs High set point, alarm will be tripped. The same is true if it goes below the Abs Low set point. The following diagram depicts the behavior of these two situations.
Two different scenarios are described as follows.
Abs High and Abs Low
Criteria used for performing protection in the test area. Set values greater than the temperature set points in the test area by 10 °C or more. If the equipment detects a fault condition, the equipment stops operation after issuing an alarm.
Upper Deviation
Criteria used for performing for specimens. Change the setting depending on the test specimen. If the equipment detects a deviation fault, the equipment stops the header (humidifier) after issuing a warning. When the temperature in the test area decreases to the temperature set point, the equipment returns to the normal control.
The following procedure outlines the steps to create a program using the Step-Wise method. The program will consist of 15 steps. Operation time, temperature and humidity set point values are listed in the following table.
| Step No. | Temp | Humi | Refrig |
|---|---|---|---|
| 1 | 85 | 10 | Auto |
| 2 | 60 | 10 | Auto |
| 3 | 40 | 20 | Auto |
| 4 | 20 | 45 | Auto |
| 5 | 10 | 80 | Auto |
| 6 | 10 | 90 | Auto |
| 7 | 15 | 98 | Auto |
| 8 | 30 | 50 | Auto |
| 9 | 30 | 65 | Auto |
| 10 | 40 | 98 | Auto |
| 11 | 70 | 50 | Auto |
| 12 | 85 | 85 | Auto |
| 13 | 85 | 98 | Auto |
| 14 | 83 | 10 | Auto |
| 15 | 23 | OFF | Auto |
The procedure assumes the chamber has already been turned On, and the GL controller system starts from its home page. If the chamber is not yet turned On, set the main power breaker in the ON position. Within a minute, the touch-screen display will come on. The system automatically logs in using the default user account (localhost) to operate the chamber.

Procedure:
-
Press the Hamburger menu (1) in the status bar. Check to confirm the floating keyboard is enabled. A diagonal bar over the keyboard indicates it is disabled. Press the keyboard (2) to enable it. Press Set Mode (3) to access the Set Mode page.
-
Press Program 1 panel (see top arrow), then press the Edit button (see bottom arrow) in the pop-up window to access Program 1 edit page for programming.
-
The step-wise editing page (intended for this example) is displayed by default with Step 1, unedited with 0 operation time and empty trend graph at the bottom. Press the Step 1 body (see arrow) to access its editing template.
-
Press the Temp box (see arrow) and enter 85. Press Enable (see arrow) under Humi to turn it on and adjust set value (from 5) to 10 RH. Set operation time to 1 hour: Hrs to 1, Mins and Secs to 0. Step 1 summary page is shown in the right for reference. The first nine time signals are set to Off (unselected).
-
By default, refrigeration is set to Auto and time signals are set to Off. Press the Details button at the bottom of Step 1 summary page (refer to the above figure and/or see arrow in the following figure) to confirm refrigeration and time signals settings. Press the checkmark (see arrow) to complete Step 1 programming. Note: The right/left buttons are for navigating through program steps forward or backward. Since only one step is being created thus far, these buttons are not yet fully operational.
-
Press the Details Page (see arrow) to access program details page for configuring program start/stop mode, Absolute High/Low limits for temperature and humidity. Note: The slider bar and left/right paging buttons are for traversing through program steps.
-
The default program name is Program 1. Press the program name field (see arrow) and enter Humidity Points for program name. By default, program start mode consists of both temperature and humidity without initial set point values, which means the chamber will raise ambient temperature (inside the chamber) to the set point specified in Step 1. Program will stop when it completes all the steps. Adjust the Absolute High and Low Limits (see arrows) for temperature values as desired. Note: The High/Low limits only affect the current program being edited; they will not affect any other programs or constant modes. Press the Save button (see arrow) to save the settings.
Note: The high/low limit values cannot be set to a value greater than the default high/low limit values set at the factory. Refer to the following figure for detail.
Absolute high/low temperature limits: These settings are designed to protect the chamber against thermal damage. Set the values to at least 10 °C higher/lower than the target temperature. When tripped, an alarm is generated and the chamber stops running.
Upper deviation temperature limit: This setting is designed to protect specimens against damage by heat. It also triggers a safety device inside the chamber, which causes the heater output to set at 0% output. When temperature returns within range, normal control is restored automatically.
Absolute high/low temperature limits: These settings are designed to protect the specimens against humidity damage. When tripped, it triggers a safety device inside the chamber. Absolute high will cause the humidity heater to go to 0% output. When humidity returns within range, normal control is restored automatically.
-
The following table outlines the detailed elements for the remaining 14 steps. Repeat Steps 3 through 5 to complete these steps using values in the table.
-
The completed program is illustrated in the following figure. The slider bar and paging buttons can now to be used to traverse between program steps. The trend graph illustrates the output of the program, showing what the program will do when it is executed. This trend graph is extremely useful for previewing the program output to study its results. Press the Save button (top arrow) to save the program in the current slot (i.e., Program 1). Note: The Save As button (middle arrow) can be used to save the program in a different slot. The reverse button (last arrow) can be used to cancel or revert the action.
-
Press Yes to confirm the action (saving). Program 1 is now saved in slot 1.


The following procedure outlines the steps to create a program using the Table-Wise method. The program will consist of 8 steps, with operation time, temperature and humidity set point values listed in the following table. Program 2 (in slot 2) will be used to create the program.
| Step No. | Temp | Humi | Refrig |
|---|---|---|---|
| 1 | 85 | 10 | Auto |
| 2 | 60 | 10 | Auto |
| 3 | 40 | 20 | Auto |
| 4 | 20 | 45 | Auto |
| 5 | 10 | 80 | Auto |
| 6 | 10 | 90 | Auto |
| 7 | 15 | 98 | Auto |
| 8 | 23 | OFF | Auto |
The procedure assumes the chamber has already been turned On, and the GL controller system starts from its home page. If the chamber is not yet turned On, set the main power breaker in the ON position. Within a minute, the touch-screen display will come on. The system automatically logs in using the default user account (localhost) to operate the chamber.
Procedure:
-
Press the Hamburger menu (1) in the status bar. Check to confirm the floating keyboard is enabled. A diagonal bar over the keyboard indicates it is disabled. Press the keyboard (2) to enable it. Press Set Mode (3) to access the Set Mode page.
-
Press Program 2 panel (see top arrow), then press the Edit button (see bottom arrow) in the pop-up window to access Program 2 edit page for programming.
-
Press the Table-wise editing page (see arrow) to display the program edit table.
-
Edit Step 1 by entering the values as indicated by the four arrows. By default, humidity mode is set to Off. Press the down arrow icon (see arrow) to select On from the menu and enter 10 for humidity set point. The rest of the parameters are set by default. Press the Append button (see arrow) to add Step 2 and proceed to the next step.
-
Complete Step 2 of the program by editing the temperature set point to 60 (refer to the table above); the rest of the values and parameters remain the same (as in Step 1).
-
Use the values in the above table to complete the remaining 6 steps in the program, as depicted below. The default settings for program start/stop modes are identical to those in Section 5.3.4; and they will be used here also and therefore no need to access the Details page (with the exception if program name needs editing). The vertical slider bar and paging buttons (on the right) can be used to traverse through program steps for editing. The horizontal slider bar has two small arrows. The right arrow slides the table leftwards to display the remaining time signals; the left arrow slides back the table. Press the Save button to save the program.
-
Program 2 is now saved.


In this example, we illustrate how to set up multiple counters in a program, using Step-Wise and Table-Wise method. The main focus is how to set up counters, giving less attention to temperature (humidity) or other options; we specify the duration for each step with 2 minutes. The following table lists two counters: (1) Counter 1 (Step 1 through Step 3) repeats the cycle one time; (2) Counter 2, with start step at Step 5 and end step at Step 9, repeats the cycle 3 times.
| Step No. | Time | Temp | Humi | Refrig | Start Step | End Step | Counter |
|---|---|---|---|---|---|---|---|
| 1 | 2 min | 21 | Off | Auto | yes | ||
| 2 | 2 min | 30 | Off | Auto | |||
| 2 | 2 min | 30 | Off | Auto | |||
| 3 | 2 min | 35 | Off | Auto | yes | 1 | |
| 4 | 2 min | 30 | Off | Auto | |||
| 5 | 2 min | 35 | Off | Auto | yes | ||
| 6 | 2 min | 21 | Off | Auto | |||
| 7 | 2 min | 30 | Off | Auto | |||
| 8 | 2 min | 35 | Off | Auto | |||
| 9 | 2 min | 30 | Off | Auto | yes | 3 | |
| 10 | 2 min | 21 | Off | Auto |
Refer to Section 5.3.4 on how to create a program that consists of 10 steps with the specified temperature and refrigeration, with humidity feature disabled. The table above (without counters) produces the following:

Procedure: Step-Wise Method
-
Press/click the body of Step 3 (see arrow).
-
Press/click the Details button (see arrow in figure below).
-
Enter 1 in the Count field (see arrow). Note: By default Step 1 is selected for Start Step.
-
Press/click the checkmark button in the step panel (below the Details button).
-
Press/click the body of Step 9, followed by the Details button.
-
Enter 3 in the Count field (see arrow).
-
Enter 5 in the Start Step field (see arrow in above figure).
-
Press/click the checkmark button.
-
Press/click Save, followed by Yes, to save the changes.


Note: To remove a counter, open a program in the Step-Wise editor. Select the end step of the counter; access the Details page in the step panel, reset the number in the Count field to 0, select the checkmark button to apply the changes and save the program. For the above procedure, press/click the body of Step 3, followed by the Details button in the step panel, then reset the number in the Count field to 0 and press/click the checkmark button. Repeat the procedure for the next counter. Save the changes via the Save button.
Procedure: Table-Wise Method
-
Switch the editor to Table-Wise method (see arrow).
-
Press/click the Count column (under Counter) on Step 3 and enter 1 in the cell (see arrow). Note: By default, 1 is selected for the start step (in the Step cell, see arrow).
-
Press/click the Count column (under Counter) on Step 9 and enter 2 in the cell (see arrow). Enter 5 in the Step cell for start step (see arrow).
-
Press/click Save (in the secondary menu), followed by Yes to save the changes.


Note: To remove the counters, open the program in the Table-Wise editor and remove the count numbers 1 and 3, respectively, from under the Count fields and click Save.
Several operation options are available for managing programs in the GL controller. They include Import, Export, Copy, Move or Swap, Rename, Edit, Preview and Delete. These operations can be performed during any chamber operating mode.
The following figure depicts a chamber operating in program mode, currently executing Program 1 (see Section 5.3.4). Technically, when a program is executed, the GL controller system loads that program into its memory for execution. This means Program 1 (saved in the secondary storage) can be manipulated as shown by the editing options in the pop-up menu. Notice how slot 3 provides only two options (Editor and Import) compared to slots 1 and 2.

The following table lists the available options for managing and handling programs. Program step(s) manipulation will be discussed in Section 5.5.
| Name | Description |
|---|---|
| Import | Copy program from external device (USB) into the GL controller storage |
| Export | Export selected program to an external USB device (or stored on a local device that accesses the GL controller remotely). Program can be exported in JSON or MS Excel via the appropriate icon. |
| Copy | Program and its contents can be copied into a new location |
| Move/Swap | Programs can be moved or swapped in different slots |
| Rename | Program name can be quickly edited via this button |
| Editor | Open selected program in editor mode |
| Preview | Program can be quickly previewed in trend graph via a step-by-step temp/humi output |
| Delete | Program can be purged from the GL controller storage |
Programs can be exported to a USB device for backup or stored on a local device that accesses the GL controller remotely (via a Web browser). As depicted in the following figure, program can be exported in JSON, MS Excel or ESPEC Corp. GL compatibility mode via the appropriate icon.

| No. | Description |
|---|---|
| 1 | Export in JSON file for ESPEC North America, Inc. |
| 2 | Export in MS Excel file |
| 3 | Export in ESPEC CORP. GL compatibility mode |
Program filename begins with chamber model and program slot number; e.g., GL-EPX-2-RM_program_1. The following procedure outlines the steps to export Program 1 (created in Section 5.3.4) to a USB device (via the HMI).
Procedure:
-
Plug in a USB device into the USB port (see arrow) at the front of the chamber.
-
Access (or press) Set Mode
-
Press Program 1
-
Export Options:
-
JSON Format (ESPEC North America, Inc): Press (click) the export button (see arrow 1 in the previous figure). Program will be automatically stored in the external USB device. Program filename will be: GL-model_program_1.json
-
MS Excel: Press (click) the Excel (X) icon to download the program in MS Excel file. Program will be saved with .xlsx extension.
-
ESPEC CORP. GL Compatibility mode: Press (click) the JSON (<>) file icon to download the program. Program filename will be: GL-model_program_1.json
-


Programs can be imported into the GL controller, as long as the format of the program structure is in the JSON format accepted by the GL controller system. To avoid loading issues, imported programs should be those that were originally exported out of the GL controller.
Imported programs can be created or edited outside of the GL controller in JSON format, as long as they bear the structure required by the GL controller programming system. For this reason, program(s) created by the GL controller system should be used as a template or a model to produce new programs for importing into the GL controller system.
Procedure:
-
Plug in a USB device into the USB port (see arrow) at the front of the chamber.
-
Access (or press) Set Mode
-
Press Program 3
-
A USB folder will be open. Browse the folder to select and import the program.
-
The imported program is now stored in slot 3.


A program can be relocated (moved) into a new slot. For demonstration, Program 3 will be moved into slot 4.
Procedure:
-
Press Program 3 (see top arrow). Press Move/Swap button in the Program 3 drop-down panel (see arrow).
-
The blue pop-up notification (in lower right) indicates Program 3 has been selected for Move/Swap operation. To cancel the action, press Cancel in the notification. Note: Moving over to a different menu will also cancel the Move/Swap action. Click Program 4 (see arrow) to move Program 3 in 4.
-
Confirm the action with Yes in the dialog box.
-
Program 3 has been move into Program 4. Slot 3 is now empty, as shown in the figure.


A program can be renamed to something more descriptive. For demonstration, Program 2 will be renamed to "TempTest" that actually describes its program purpose.
Procedure:
-
Press Program 2 (see arrow). Press Rename button in the Program 2 drop-down panel (see arrow).
-
Clear the "Program 2" and enter "TempTest", then press Ok. To cancel the action, press Cancel. Note: Moving over to a different menu will also cancel the Rename action.
-
Program 2 has been renamed to "TempTest", as shown in the figure.


A program can be previewed using the Preview button in the program drop-down panel. For demonstration, Program 4 (Humidity Fluctuation) will be selected for preview.
Procedure:
-
Press Program 4 (see arrow). Press Preview button in the Program 4 drop-down panel (see arrow).
-
By default, contents of Program 4 are displayed for preview in Step-Wise mode. Click Table-Wise option to display Program 4 in that mode. Note: In preview mode, program and its contents cannot be edited or changed.
-
Press the Back button (in the secondary menu) to return to Program Setup.


A program can be deleted from the program list. For demonstration, Program 4 (Humidity Fluctuation) will be selected for removal.
Procedure:
-
Press Program 4 (see arrow). Press Delete button in the Program 4 drop-down panel (see arrow).
-
Program 4 (and its slot) is immediately removed from the list, along with empty slot 5, leaving just slot 3 ready to be populated by a new program.


This section describes how to open an existing program for viewing and editing. Changes made in the program can be saved back into the slot (using Save); they can also be saved as a new program to occupy a new slot (with Save As). The editing features include delete, move, insert, copy, cut and paste range of steps. By default, the program editor operates in Step-Wise editing mode.
Program steps can be removed as individual step or in a range of steps. For demonstration, Program 2 ("TempTest") will be selected to remove a single step, followed by removing a range of steps. Program 2 consists of 13 steps. Step 2 will be removed as a single step; step 5 through step 7 will be removed as a range of steps.
Note: To prepare Program 2 to contain 13 steps to follow along with this demonstration, refer to Section 5.3.4. It is not necessary to use slot 2 (Program 2); any available slot will work.
Note: The following procedure outlines the steps based on the HMI operation. For a remote access, the procedure is identical starting with Step 2 by replacing the word press with click.
Procedure: Delete Step 2 in the Program
-
If the GL controller system is already on, proceed to Step 2. Otherwise, set the main power breaker in the ON position. Within a minute, the HMI will come on.
-
Press Set Mode in the menu bar or the Set Mode button in the home page.
-
Press Program 2 (see top arrow), followed by the Editor button in the Program 2 drop-down panel.
-
Press Step 2 header (see top arrow), followed by the Delete button in the drop-down panel (bottom arrow).
-
Press Step 2 header again (see top arrow) to mark the range of steps for deletion, as instructed in the blue pop-up notification (bottom right). Press Yes to confirm the action in the pop-up dialog box. To cancel the current action, press No in the dialog box, followed by the Cancel button in the blue pop-up notification (lower right). Note: Moving over to a different menu (e.g., Table-Wise editing page) will also cancel the current action.
-
Step 2 is removed immediately; and Step 3 now becomes Step 2 (as can be verified by their parameters). Press the Save button, followed by Yes in the dialog box, to write the changes back into slot 2.


Procedure: Delete Step 5 through 7 in the Program
-
Continuing from the previous procedure, press Step 5 header (see arrow), followed by the Delete button in the drop-down panel.
-
Press Step 7 (see arrow) to mark the range of steps for deletion.
-
Press Yes to confirm the action.
-
Step 5 through 7 are removed immediately, as shown in the following figure. Press Save (see arrow) to save the changes in the program.


Program step(s) can be moved to a different location, such as before or after a certain step in the program with the Move Before or Move After button. These buttons allow a selected step to be swapped with its neighboring steps. For example, if Step 3 is selected and the Move After button is pressed, Step 3 and Step 4 swap their positions (with Step 3 now becoming Step 4 and vice versa). If the Move After is pressed again, Step 4 and Step 5 are swapped. This process can be repeated until a desired location for Step 3 is met. The procedure is straight-forward.
Procedure:
- Access the Set Mode menu.
- Press the desired program on the program list, followed by the Editor button in the drop-down panel.
- Press the desired step to mark selection.
- Press the Move Before or Move After button in the drop-down panel to relocate the selected step.
- Close the drop-down panel.
- Save the changes.
Program 2 from Section 5.5.1 is used for demonstration. The original steps and their locations are depicted in the following figure.

Procedure: Move Step 3 to after Step 6.
-
Assuming this activity is continued from Section 5.5.1, proceed to the next step (Step 2). Otherwise, if the GL system is already On, press Set Mode in the menu bar or the Set Mode button in the home page. Press Program 2, followed by the Editor button in the drop-down panel.
-
Press Step 3 (see top arrow). The drop-down panel appears. Note: To cancel current operation, press X to close out the drop-down panel.
-
Press Move After four times until Step 7 is highlighted as shown below; that is, Step 3 has moved into Step 7 (with Step 7 now becoming Step 6).
-
Press X close the drop-down panel.
-
Press the Save button (see arrow) to save the changes.


An existing program can be edited by inserting new steps. Similar to the preceding sections, Step-Wise or Table-Wise method can be used for the task (refer to Section 5.3.1 and 5.3.2).
With the Step-Wise method, the Insert Before or Insert After button can be used to insert a new step in desired location. If Step 3 is selected, for instance, pressing the Insert Before button will insert a new step to the left of Step 3; with Insert After a new step is inserted to the right of Step 3. Step panel for the new step is open with contents of Step 3 prefilled as the parameters. These parameters can be modified to meet the requirement. Use the Check button in the panel to apply settings to the inserted step.
With the Table-Wise method, the add above or add below button (see Section 5.3.2) can be used to insert the step. This approach is quite subtle since all the parameters can be entered once the new step has been created.
The following procedure presents both methods using the following parameters for the new step.
| Step No. | Temp | Humi | Duration | Time Signal |
|---|---|---|---|---|
| New Step | 72 | Off | 1HR 0Min 0Sec | 1 = On |
Note: The same procedure can be applied using the Insert After button.
Procedure: Step-Wise Method
-
Assuming this activity is continued from Section 5.5.2, press Program 2, followed by the Editor button in the drop-down panel.
-
Press Step 3 (see arrow), followed by the Insert Before button in the drop-down panel (see arrow). Note: To cancel the current action before committing to insert, press X.
-
Step panel is open with parameters prefilled. Modify the parameters using the contents in the above table. Press the Check button to apply the settings. Note: The left or right button in the step panel has the same effect as the Check button. However, the X button does not apply the changes; it instead uses (i.e., writes) the default parameters in the inserted step.
-
Press Save to apply the changes in Program 2.


Procedure: Table-Wise Method
-
Assuming this activity is continued from Section 5.5.2, press Program 2, followed by the Editor button in the drop-down panel.
-
Press the Table-Wise subpage (see arrow).
-
Press Step 4 (see arrow), then press the add above icon on Step 3 (see arrow).
-
Edit the parameters in Step 3 using the contents in the above table. Press Save, followed by Yes in the dialog (pop-up) box to apply the changes in Program 2.


The cut-and-paste feature, available in the Step-Wise mode, allows certain steps to be relocated within the program. One or more steps can be relocated. The procedure is straight-forward:
Procedure:
- Select a program for editing, followed by the Editor button
- Select the initial step by its header (i.e., step number); press Cut/Paste Step(s); select the last step to mark the range.
- Select the step to mark the location for pasting. Note: The selected step(s) will be pasted in front of the chosen step.
- Press Yes in the dialog box to confirm the action. The following procedure outlines the steps to cut Step 3-5 and paste them in front of Step 1.
Procedure:
-
Assuming this activity is continued from Section 5.5.3, press Program 2, followed by the Editor button in the drop-down panel.
-
Press Step 3 header, followed by the Cut/Paste Step(s) button in the drop-down panel.
-
Press Step 5 to mark the range.
-
Press Step 1, followed by Yes in the dialog box to confirm the action.
-
Step 3-5 should now be pasted in front of Step 1. Press Save to save changes to the program, followed by Yes to confirm the action.


Programs are executed in the Program Run panel under the Operation Mode menu, which is accessible via the menu bar (1), the button in the home page (2), or the system menu via the hamburger button (3), as depicted in the following figure. Depending on how the home page is configured (i.e., customized), a program may be executed directly from within the home page via the Start Prog. # button (4). Any program available in the Program Run panel can be pinned to the home page using the edit button (pen icon) in the secondary menu. Section 5.6.3 explains in detail how to pin a program.

| No. | Name | Description |
|---|---|---|
| 1 | Operation Mode | Direct access to the Operation Mode in the menu bar |
| 2 | Operation Mode button | Direct access to the Operation Mode via a button in the home page |
| 3 | Operation Mode under System Menu | Alternative method to accessing the Operation Mode via the system menu |
| 4 | Start Prog | Short cut to executing a program pinned on the home page; any program can be pinned for a direct and quick execution. |
Any program available in the Program Run panel can be executed. The following figure depicts the layout and operation buttons of the Program Run panel.

| No. | Name | Description |
|---|---|---|
| 1 | Program List | Displays all programs available in the panel. |
| 2 | Scroll bar | This scroll bar can be used to view all programs in the panel by sliding up or down. |
| 3 | Paging buttons | Three up/down paging buttons can be used to page through the long list of programs; button 3a or 3f takes to the top or bottom page; button 3b or 3e views the list one page at a time; button 3c or 3d pages through the list one row at a time. |
| 4 | Operation buttons | Three buttons are available to manage the program during execution; the Stop button (top button) terminates the program immediately; the Pause/Resume button (middle button) pauses/resumes the program; the Skip button (bottom button) skips to the next step in the program. |
To execute a program, press (or click on) the desired program in the panel. The following figure depicts the action to start Program 2. By default, execution begins with Step 1. However, any step can be selected to begin the execution, using the step selection field. The step pager can be used to page through the steps (back and forth). To start the execution, press (or click) Start Program. Press Cancel to cancel the action.

| No. | Name | Description |
|---|---|---|
| 1 | Program No. | Lists Program Number |
| 2 | Program Name | Lists program name; program number is displayed if program has no name. |
| 3 | Step No. | Step 1 is selected by default to start execution. |
| 4 | Step Selection | A desired step number can be selected to begin the execution. |
| 5 | Step Pager | Use these buttons to page through the program to view or select a step to start the execution. |
| 6 | Start Program | Use this button to start the program execution. |
| 7 | Cancel | Program execution can still be canceled with the Cancel button. |
Procedure:
- Press (or click) Operation Mode
- Press (or click) the desired program in the Program Run panel.
- Press (or click) Start Program to start the execution with Step 1.
- If a desired step is required to start the execution, enter step number in the Step Selection field or select the step in the program, then press Start Program.
Note: If the GL controller and chamber are operated remotely (via a Web browser), the following error message will appear if the operator has insufficient privilege to execute the program or if the user did not log in to their account.

To execute a program on the home page, press (or click) Start Prog # (see arrow), followed by Yes in the dialog box to commence the action. Note: If this option is not available, proceed to Section 5.6.3 for details how to pin a program. By default, the Start Constant 1 is configured to provide the quick execute button.

Note: If the GL controller and chamber are operated remotely (via a Web browser), the following error message identical to that in Section 5.6.1 will appear if the operator has insufficient privilege to execute the program or if the user did not log in to their account.
The following procedure outlines the steps to pin a specific program to the home page. By default, Constant 1 is pinned to the home page (see figure below). The entire home page can be customized using the pin/unpin action via the Edit button in the secondary menu (see above figure).

The following figure depicts the home page in edit mode. In general, home page editing can be performed during any operating mode. However, it is recommended to perform this action during the standby mode.

| No. | Name | Description |
|---|---|---|
| 1 | Edit | Use this button to edit the selected widget or link. |
| 2 | Add | Use this (+) button to add a new component and pin it to the home page. A new widget is added to the bottom of the standard display area; it can be moved to a desired location. Refer to Section 6.12 for details. |
| 3 | Apply | Use this Check mark to confirm and apply new settings to the home page. |
| 4 | Cancel | Use this Back button to cancel the operation. |
The following procedure outlines the steps to pin Program 1 to the home page. Step 1 of the program will be the default step to start the execution.
Procedure:
-
Press Home (see arrow), followed by the Edit button in the secondary menu (see arrow).
-
Press the Edit button of Start Constant 1 (see arrow).
-
Press Operation Mode (see arrow). Note: To cancel, press Close; to delete the current button, press Delete. Use the Delete button with caution as it requires adding the widget back into the spot. If you accidentally pressed Delete, press Back in the secondary menu to cancel this task. Refer to Section 6.12 for details.
-
Press Program 1 (see arrow) to select Program 1 (Range Checker).
-
Press Start Program (see arrow) to set execution with step 1 by default. A desired step may be selected before pressing Start Program. However, in this example, there is only one step; and therefore, step selection is defaulted to step 1.
-
Press the check mark (see arrow), followed by Yes in the Attention dialog box to save the current settings.
-
Program 1 is now pinned to the home page as shown.


As stated in Section 5.4, when a program is selected for execution, the GL controller loads that program from its secondary memory (i.e., storage) into its primary memory (i.e., RAM) to start the execution. Thus, during execution, that program can still be loaded (from storage) into the program editor for editing, but several editing features are forbidden. If the program has been edited or modified, such as with steps being edited, added or removed, it cannot be saved (in the current program slot), as depicted in the following figure.

However, the edited version may be saved in a different slot under a different name. In addition, that same program cannot be deleted during its execution, as depicted in the following figure. In other words, if you select Program #1 (see arrow), then select Delete (see arrow) in the pop-up dialog, an error flag will occur, indicating cannot delete running program.

Chamber operating mode is displayed in the middle of the status bar at all time. As depicted in the following figure, the chamber is in Program mode. Detailed information of the program being executed is displayed in the Standard Display area (see callout 2 and 3). Their descriptions are listed in the following table.

| No. | Description |
|---|---|
| 1 | Displays operating mode and status that include program name, process values of temperature and/or humidity. |
| 2 | Displays set point(s) and process value(s) of temperature (Air/Product) and/or humidity. |
| 3 | Displays program execution status, such as program number and name, step being executed, total execution time, progress bar, remaining time and date/time when program execution completes. |
The most detailed display page for any operating mode is the Monitor page. Six different submonitor pages provide details of the chamber and program operating condition.
Starting with Page 1, the display focuses on the main information of the operating condition, namely, the set points and process values of temperature (Air or Product) and humidity.
Submonitor, Page 1: Program Mode

| No. | Description |
|---|---|
| 1 | Displays set points and process values of temperature (Air/Product). In Standby mode, set points are OFF and process values are indicated by --- for any unavailable option. |
| 2 | Displays set points and process values of humidity. In Standby mode, set points are OFF and process values are indicated by ---. Refer to Item 1. |
Submonitor Page 2 displays details of Time Signal outputs and operating status of the refrigeration system during a program execution.
Submonitor, Page 2: Program Mode

| No. | Description |
|---|---|
| 1 | Displays set points and process values of temperature (Air/Product) and/or humidity. |
| 2 | Displays operating status of the available time signals. |
| 3 | Displays refrigeration system status controlled by the PLC. A two-stage refrigeration system is shown in the display. Since the PLC controls the refrigeration system and its stages, users have no control over it. The display mainly provides information for the user how the refrigeration is being controlled and operated, in terms of power, discharge or evaporation temp., gas pressure or temperature. |
| 4 | Edit button: Click to edit the layout of this page. Refer to Section 6.12 for details. |
Submonitor Page 3 displays details of chamber operating mode in Standby, Constant or Program.
Submonitor, Page 3: Program Mode

| No. | Description |
|---|---|
| 1 | Displays current condition or operating mode |
| 2 | Displays trend graph of recent data and set mode prior to current (operating) mode: Standby. Details of this display will be provided later. |
| 3 | Edit button: Click to edit the layout of this page. Refer to Section 6.12 for details. |
Submonitor Page 4 displays a summary of the current operating mode. It lists all the parameters associated with the current operating mode that include control types and their status, such as temperature (On/Off), humidity (On/Off), time signals (On/Off), refrigeration system (On/Off), etc.

Submonitor Page 5 displays details of program output and status. In Standby or Constant mode, this submonitor page is blank. The following figure depicts details of program status, showing set points and process values of temperature and/or humidity, program runtime (both remaining time and elapsed time), and date/time when program will be completed. It also displays program steps and the current step (highlighted) being executed. The scroll bar or paging buttons can be used to preview these steps while the program is being executed.

| No. | Name | Description |
|---|---|---|
| 1 | SP/PV | Displays set points and process values of temperature and/or humidity. |
| 2 | Runtime | Displays details of program execution time, its elapsed time and remaining time. |
| 3 | Step | Display program steps; paging buttons or scroll bar can used to browse the steps; current step being executed is highlighted. |
The following figure illustrates another program containing four steps with Step 4 being carried out.

Submonitor Page 6, called Trend Graph, displays detailed scatter plot of data points from the data log (past and present). This graph allows the operator to view a scatter plot of data collected during chamber operation. Data collection can occur in two distinct settings: Always and Running. Default setting is Always, which means data will be collected during any operating mode. Section 6.3 ("Set Sampling") provides details of these settings.

By default, the trend graph provides a scatter plot of data points collected during the last hour. Various options of plot range of data accumulated more than one hour can be selected. Data can be downloaded (in whole or in portion) and stored on an external USB device (if connected) or on the local computer if the GL system was accessed remotely.

The trend graph is made up of different components are described as follows:
- Trend Graph: Data collected from the chamber are rendered as trend graph via scatter plot methodology; data points of temperature, air temperature, product temperature control and humidity are plotted as a function of time. The y-axis represents the scale of these values. The x-axis represents the data logging runtime.
- Trend Graph Manipulation Buttons: Control and management of trend graph are provided by the manipulation buttons. Detailed functionality and operation of these buttons are discussed in a separate section (Section 5.7.7).
- Line Graph: Different styles of graph--solid lines, dashed lines and color--are used to designate each type of data points for visualization. Solid lines represent process values, dashed lines set values, etc.
- Y-axis Label: The y-axis displays the selected type of data points to be plotted (temperature, product temperature control, humidity). These values are populated based on the selection of the Graph View under item 2 (above).
- X-axis Label: The x-axis displays log time of the data. Default plot range is one hour with grids; each grid sets a 5-minute time-scale.
- Y-axis Title: The y-axis title provides clarity to the type of graph being represented.
- Legend of Trend Graph: The legends provide identity of each item on the trend graph designated with color coding.
- Status Bar: Displays progress bar of each operating mode.
- Status Mode: Displays chamber operating mode with date and time. If a program is being executed, program name, slot number and step number will be displayed.
The following is a detailed list of the Manipulation Buttons, item 2 in the previous figure (Section 5.7.6).
-
Auto Refresh: This Auto Refresh button reconstructs the graph to include data points up to the current time.
-
Plot Range Selectors: Default plot range is one hour. With this button (and its options), plot range can be configured up to 12 hours or 7 days. Custom set range is also available via the Custom Time Span option.
-
Download Button: Data can be downloaded for backup on an external USB (or local) device and saved in CSV format. Date/time format can be downloaded in UTC or local time, as indicated by the drop-down menu options. It is strongly recommended to download and clear data regularly. Data accumulation increases in size almost exponentially. As a result, storage space may be wasted; large data file may affect the operation and performance of the GL control system. Refer to Section 6.3 for details how to clear data file.
-
Plot Configuration: Elements of the trend graph can be configured via this button.
-
Pan/Zoom Controls: The collapsible Pan/Zoom Controls button allows the operator to control and adjust the viewable section in the trend graph. The up/down arrows can be used to collapse/expand the drop-down menu to manipulate the trend graph as follows.
-
Zoom In: The Zoom In button allows the operator to zoom into a small section of the trend graph. Depending on the degree of zooming, the display area will be confined to a small set of data points ranging between minutes to hours. To reset the trend graph, click the Zoom Extents button, select Last Hour from the drop-down menu, then click the Auto Refresh button.
-
Zoom Out: The Zoom Out button does the opposite by allowing the operator to zoom out on the trend graph, thereby giving the operator an expansive view of the trend graph. To reset the trend graph, click the Zoom Extents button, select Last Hour from the drop-down menu, then click the Auto Refresh button.
-
Move Up: This button allows the operator to move up the graph along the vertical axis to adjust the viewable area of the scatter plot. To reset the trend graph, click the Zoom Extents button, select Last Hour from the drop-down menu, then click the Auto Refresh button.
-
Move Down: This button allows the operator to move down the trend graph along the vertical axis with the purpose to adjust the viewable area of the scatter plot. To reset the trend graph, click the Zoom Extents button, select Last Hour from the drop-down menu, then click the Auto Refresh button.
-
Move Left: This button allows the operator to pan left on the trend graph, offering a quick preview of a plot of data points tracing back the time in hours or days. With this feature, the operator can quickly gain a preview of past data points which the operator may have missed.
-
Move Right: This button does the opposite to Move Left by allowing the operator to pan right on the trend graph to the current time. To reconstruct the trend graph to contain the most recent data points, the Auto Refresh button allows the quickest operation.
-
The Setup menu provides a wide range of configuration options for control and operation of the GL controller system and the chamber. As such, this menu should be off limit to regular users. To protect the GL controller system and chamber from accidental damages, the owner (supervisor or administrator) who manages this GL controller system must grant access to only the selected users to this menu. Access privileges can be enforced on all users under the Users (Register User Password) setup page. Refer to Section 7.4 for details.
According to Section 2.3.5, Setup can be accessed in two ways: (1) Menu bar, (2) Hamburger button.
Setup via Menu Bar: This is the primary feature of the menu, where each submenu is accessible under the Setup page (depicted in the figure).

System Menu via Hamburger button: Setup can be accessed via the hamburger button in the status bar (see arrow). It provides a direct access via the system menu without affecting the standard display.

Note: The Setup menu can also be accessed from within the Home page if it is custom configured to contain that menu.
The following sections describe these submenus in the order they appear according to the list in the system menu (via the hamburger button), with the except of Configuration, to be discussed separately as it deserves a chapter of its own.
Note: Set Timers option cannot be operated via the HMI by the local user at the chamber. This feature must be operated remotely, where the GL controller system is be part of a network and the user accesses it from a PC via a Web browser. Refer to Chapter 8 for details on how to access the GL controller system remotely on a network.
The Timers tab provides a quick way to apply the Macro Editor to automate a simple macro action to extend the operating mode of the chamber. There are two timer types: One-time timer and repeated timer. The one-time timer or one-shot timer allows an operator to set up a single (hence, one-time) operation on the chamber, while the repeated timer permits an operator to set up a repeated operation on the chamber. The repeated timer will operate indefinitely until it is disabled. The following figure depicts these two timer types.

-
One-Time: This timer fires the constant mode operation at 3:06:58 PM on 9/6/2023. The timer instruction and 3:06:58 PM must be configured ahead of time, later than the current time in order for the operation to take effect. For this reason, the GL controller date/time must synchronize with the current or local date/time (refer to Date/Time Settings under the Settings menu for detail). The one-shot timer is date/time dependent.
-
Repeated Daily/Weekly: This line is added after the first line got executed. Since it is set to occur after the first line, it will trip at 3:15 PM on Wednesday and Thursday of the week (in reference to the current date/time of the GL controller). The action executes a program from slot 2 (also referenced by the program name). When program execution is complete, the chamber will be set in the operating mode specified by the instruction in the program. This timer type is date/time independent; the operation will recur until the timer itself is removed from the Timers list or disabled with the Enabled box unchecked.
-
Add Timer: A new timer can be added using the Add Timer button, which will be added at the bottom of the list.
-
Remove/Delete: Each timer can be removed using the X button to its right.
-
Save/Apply: To start the timer, the Save or Apply button must be used. The two timer instructions (depicted above) are saved under the Macro Editor called Operation Timer 1 and Operation Timer 2, respectively. If the timers are edited with new instructions and saved, the system generates a new name Operation Timer 3 for the third timer, with a numeral incremented by one per each update. If the timer instructions are all removed from the Timers list, and a new timer is created and saved, the system starts over with Operation Timer 1, with its numeral incremented by one on each new update. This information can be viewed under the Macros submenu (under the Settings menu).
A one-shot timer sets the Timers to fire a certain action once based on the set date and time. With this feature, a selected program can start at a certain day and time once. The running program can be paused, resumed or stopped by another (subsequent) one-shot timer. An operator can plan to stop a certain program and switch the chamber to a different mode with the one-shot timer.
The following example illustrates how to set a one-shot timer to switch the chamber from Standby to Program and execute the said program starting with step 1.
-
Log in using the admin account
-
Access the Start Stop menu
-
Touch or click the ADD TIMER bar
-
Select/confirm that One Time is selected from the drop-down list of the Timer type; by default, One Time is selected.
-
Touch or click the date/time field under the Timer Properties and apply the calendar and time to set the desired time. Note: Date and time must be ahead of the current date and time on the GL controller system.
Note: For a one-time operation, it is easier to use the Offset button (on the right of the date/time field) to adjust the future time, as depicted by the arrows in the following figure. Here, the GL controller will add the time to the current time to calculate when this action will fire.
-
Under Operation, select Program: Run Program
-
Under Program, select from name (or slot number)
-
Under Step, select what step to start
-
Apply the setting with the APPLY button
Note: Both the Save and APPLY buttons provide the same effect. Either button can be used to save the settings and apply the action.
-
The program in slot 21 (as depicted in the example) will commence at 5:59:28PM (according to the GL controller local time).


The one-shot or repeated timer can be removed from or added to the Timers list with the X or ADD TIMER button. Each new timer is added to the bottom of the list and takes effect after each update.
To add a new timer and use it, simply apply the ADD TIMER button. The following figure illustrates how a second timer is added to switch the chamber from a program mode (activated by the first timer) to Constant. Here, program from slot 21 gets executed (by the timer in the first line) at 1:20:15 PM, with execution time to last several hours. The timer in line 2 will switch the chamber to Constant mode at 2:00:00 PM.

Different timers on the list can be enabled or disabled using the Enabled box. Additional timer can be added to the Timers list and updated to take effect, provided the time is set for future time.
The following example illustrates how to configure a one-shot timer to stop the current program and switch the chamber to Constant at a specific time. The timer is configured as a new instance with one line by itself, as depicted in the following figure. The action is instant and the program being executed will be stopped immediately; therefore, the action must be applied with care.
Procedure:
-
Log in using the admin account
-
Access the Start Stop menu
-
Clear all or current timer settings with the X button (if necessary).
-
Touch or click the ADD TIMER bar
-
Confirm that One Time is selected (or make selection from the drop-down list).
-
Touch or click the date/time field under the Timer Properties and apply the calendar and time to set the desired time.
-
Under Operation, select Standby: Stop Operation
-
Apply the setting with the APPLY button. The timer is now saved in the Macros list.
-
The timer is activated at the set time, as depicted in the Macros list under the Operation Timer 1 script. To view the Operation Timer 1 action, access the Settings menu and select Macros from the submenu.


With a weekly repeated timer, a program can start on a certain day, at a certain time. The following example illustrates how to execute a program on a weekly basis (one day during each week) at a certain time. Here, we set a program execute every Tuesday at 4:00 PM.
Procedure:
-
Log in using the admin account
-
Access the Start Stop menu
-
Clear all or current timer settings with the X button (if necessary).
-
Touch or click the ADD TIMER bar
-
Touch or click Timer Type and select Repeated Daily/Weekly
-
Edit the time to 4:00 PM
-
Check the box under T. The calendar format is Sunday(S) to Saturday (S).
-
Under Operation, select Program: Run Program Mode
-
Under Program, select program in the desired slot number (slot 8, PROGTEST8, was used as an example).
-
Set and select program step 1 to begin execution.
-
Apply the setting using the APPLY button. The complete configuration is depicted in the following example.

This timer can be disabled or enabled by manipulating the Enabled box. If you stop the program or switch the chamber to a different mode (such as, Constant), while this timer is still enabled, the selected program will recur on Tuesday at 4:00 PM the following week. To disable the timer permanently, it must be removed from the list (with the X and APPLY button).
The following example illustrates how to execute a program on a daily basis, from Monday through Friday, at 5:00 PM during each week.
Procedure:
-
Log in using the admin account
-
Access the Start Stop menu
-
Clear all or current timer settings with the X button (if necessary).
-
Touch or click the ADD TIMER bar
-
Touch or click Timer Type and select Repeated Daily/Weekly
-
Edit the time to 5:00 PM
-
Check the boxes under M through F. The calendar format is Sunday(S) to Saturday (S).
-
Under Operation, select Program: Run Program Mode
-
Under Program, select program from the desired slot number slot number (PROTEST7 from slot 8 was used as an example). Set and select program to begin at step 1.
-
Apply the settings with the APPLY button. The complete configuration is depicted in the following figure.

The following trend graph is a result of the timer from a different chamber (used for illustration here) with its configuration set to run over several days. The trend graph was produced by extrapolating the data from the last three days (Friday through Sunday). It shows how program was repeated each day at 6:05 PM and ended shortly before 9:00 AM, as indicated by the status bar at the bottom of the graph. The chamber was put in a Standby mode until 6:05 PM, at which time the program recurred.

This timer can be disabled or enabled by manipulating the Enabled box. If you stop the program or switch the chamber to a different mode (such as, Constant), while this timer is still enabled, the selected program will recur on the next day. To disable it permanently, the timer can be removed from the list (with the X and APPLY button).
The Timers list may contain multiple timers with different instructions for a specific operation. Multiple timers allow for sequential activations, order of script execution or specific execution via the enabled box selection, etc.
The following figure depicts a list of multiple timers, each with a specific function and operation, which has been prepared to execute in the top-to-bottom paradigm.

Each entry in the above figure is added after the previous one (above it) has been executed. All of which are enabled by default. Only timer 1 (top line) and timer 4 (bottom line) remain in effect, since the middle two are one-shot timers. In addition, the last timer is also a one-shot timer and it will end after the program it has executed has ended. Each timer causes action to take over the previous one.
The Firmware History page can be used to check against the current release of GL controller system by ESPEC to ensure your system is current and up to date. This firmware can also be used to check against the original version shipped with the chamber.
Contents in the trend graph of the Monitor menu are dictated by the settings on this page. Data points collected from the chamber will bear a date/time stamp of the GL controller as shown in the status bar on the HMI display (see Section 2.4.2). For practical purposes, date/time of the GL controller should reflect the current date and local time zone. Refer to Section 7.2 for details on how to adjust date/time on the GL controller.
The Set Sampling page consists of three main components: (1) data logging frequency, (2) data logging mode and (3) logging items. It is recommended to clear (i.e., delete) the data log regularly by applying the Delete all logged Data button, designated by arrow No. 4 in the following figure, to avoid mass data accumulation both to protect and maintain data storage space and the overall responsiveness of the GL controller system. Data log can be downloaded for archive. Refer to Section 4.9.8 or 5.7.7 for details.

| No. | Name | Description |
|---|---|---|
| 1 | Sampling Frequency | Data logging interval selection |
| 2 | Logging Mode | Data logging mode selection; available in Always and Running |
| 3 | Logging Item | Data logging items; items to be included in data log |
| 4 | Clear Data | Clears data file for new data log |
Data logging is controlled by the sampling frequency and chamber operating mode designated by Item 1 and Item 2 in the table, respectively. The default sampling frequency occurs at a 5-second interval. An arbitrary value can be used to set the sampling frequency in Item 1. Two operating modes are available to control data logging: Always and Running. When Always is selected, data will be logged at all time. When Running is selected, data will be logged only when the chamber is running, both in Constant and Program mode.
Data points and types (such as, temperature, humidity, etc.) can be manually selected to appear in the trend graph. Selection can be made based on the check mark placed in their respective boxes (see figure below). This page is scrollable to allow all available items be selected and included in the data log. Color decoration can be selected for plot legends. Different logs for a trend graph can be created using the (+) button. The y-axis (vertical) scaling can be adjusted via the Y Axis Max and Y Axis Min buttons. Detailed steps for these settings are discussed in the following sections.

| No. | Description |
|---|---|
| 1 | Default log name for trend graph preview. The first log is called default. |
| 2 | A new log can be created using the + button; default name is new. This name can be changed via Item No. 4 (below). |
| 3 | Use this button to delete a log. The selected log is deleted when the trash bin is pressed (or clicked). |
| 4 | Log name can be created or edited using this field. This option operates in concert with No. 2 (above). |
| 5 | Lists available items selectable to include in log preview. |
| 6 | Minimum and maximum vertical scaling can be adjusted using these two fields. |
| 7 | Legends of different data points can be characterized with unique properties for easy identification. |
| 8 | The Save button can be used to apply the new settings; use the Back button in the secondary menu to cancel the current action. |
The following procedure outlines the steps to configure data log in any operating mode with logging frequency at a 5-second interval; data points will be logged every five seconds.
Procedure:
-
If the GL controller system is already on and its HMI is in sleep mode, tab your finger on the HMI and proceed to Step 2. From a cold start, set the main power breaker in the ON position. Within a minute, the HMI will come on. The system automatically logs in using the default localhost user account to operate the chamber.
-
Press the Hamburger menu (1) in the status bar. Check to confirm the floating keyboard is enabled. A diagonal bar over the keyboard indicates it is disabled. Press the keyboard (2) to enable it. Press Setup (3) followed by Set Sampling (4).
-
Press the Delete all Logged Data button (see callout 1) to reset data log file. Press the sampling frequency field (see callout 2) and set the value to 5 via the pop-up keypad (not shown). Press the Always button (see callout 2). Press the Save button to save the current settings.
-
Data points will consist of the selected items in the default setting. These items are depicted in the above figure with the check mark in their boxes.


The following procedure outlines the steps to configure data log in Program mode with logging frequency at a 5-second interval; data points will be logged every five seconds.
Procedure:
-
Repeat Step 1 and 2 in Section 6.3.1.
-
Press the Delete all Logged Data button (see callout 1) to reset data log file. Press the sampling frequency field (see callout 2) and set the value to 5 via the pop-up keypad (not shown). Press the Always button (see callout 2). Press the Save button to save the current settings.
-
Data points will consist of the selected items in the default setting. These items are depicted in the above figure with the check mark in their boxes.
This section outlines the steps to create a custom log file for trend graph preview. In this example, we set the chamber to operate in program mode (using Program 2 discussed in Section 5.5). Our custom log will include program ID and name, program step, refrigeration system and alarm, as well as temp/humi SP and PV; these parameters will be checked against the default log.
Procedure:
-
Press Setup, followed by Set Sampling.
-
Apply default setting and select status, Temp Air SP, Temp Prod. SP, and their counter PV, then save the settings with the Save button in the secondary menu. Access Monitor and select Trend subpage as shown below.
-
Press Setup, followed by Set Sampling.
-
Create a new log called custom1 as follows: Press +, enter custom1 in the name field.
-
Select the following items:
- Status
- PGM Step
- PGM ID
- PGM
- Temp Air SP, Temp Prod. SP, Temp Air PV, Temp Prod. PV, and Temp EN
- Refrig
- Alarms
-
Press Save, followed by Yes in the dialog box.
-
Press Operation Mode, then execute Program 2.
-
Press Monitor, followed by the Trend submonitor page. The log being displayed is the default log.
-
Press the Trend icon in the upper-right (see arrow 1) and check the custom1 box (arrow 2) to display custom1 log.
-
Trend graph based on custom1 is now displayed, which can be compared to the default log.


The Alarm/Operation History page displays operation history of the chamber that includes alarms/warnings, operating modes and statistics. Any alarms or alerts tripped during the chamber operation (and logged in the data file) are displayed here. Information of the history log is linked to the data log. Therefore, history logs can go back to as far as the available data in the data log. This page therefore displays the chamber operation history based on the information extracted from the data log.
Note: Since the data log is recommended to be cleared regularly in order to maintain storage space as well as the overall performance of the GL controller, it is recommended that information of the Alarm/Operation History be reviewed or analyzed regularly prior to deleting and resetting the log file.
The quickest way to access and view Alarm/Operation History is as follows.
Procedure:
-
If the GL controller system is already on and its touchscreen is in sleep mode, tab your finger on the touchscreen and proceed to Step 2 (below). From a cold start, set the main power breaker in the ON position. Within a minute, the touch-screen display will come on. The system automatically logs in using the default localhost user account to operate the chamber.
-
Press Setup in the menu bar (see arrow 1). Press the Alarm/Operation History tab (see arrow 2).

The Alarm/Operation History consists of three separate subpages, each providing different information of the operation history.

| No. | Name | Description |
|---|---|---|
| 1 | Alarm/Warning | List of alarm and warning occurred during chamber operation |
| 2 | Operating Mode | List of operating modes taking place during chamber operation |
| 3 | Operation Statistics | List of operation statistics during chamber operation |
Details of alarms and warnings that occurred during chamber operation are tabulated in five separate columns to provide specific information of each event. Events are listed in a top-down order, with recent ones at the top, earlier ones at the bottom. The table can scroll up or down by swiping the touchscreen in the down/up direction, namely, swipe the touchscreen up to scroll down the table.

| No. | Name | Description |
|---|---|---|
| 1 | Type | Lists the type of alert as alarm (ALM) or warning (WAR); alarm or warning ID's are included in the list |
| 2 | Alarm | List alarm or warning message to provide specific information |
| 3 | Trip Time | List date and time when alarm or warning occurred |
| 4 | Clear Time | List date and time when the trip was resolved (cleared) |
| 5 | Trend Graph | Provides an access link to view the trend graph when the trip occurred |
Each entry in the table is attached to it a trend graph (in the last column) to provide a graphical overview in the timeline when an event occurred.
The following procedure outlines the steps to open a trend graph to view details of an overheating alarm that occurred during chamber operation, then return to the alarm/warning table. Overheating Alarm is selected for this example, since it may reflect real event during a production run.
Procedure: Example
-
Locate the Overheating Alarm, as depicted in the figure below. Press the trend graph icon (see arrow).
-
The timeline in the trend graph indicated that Overheating Alarm occurred between 3:41 PM and 3:48 PM (see arrow 1) and was tripped by and during the constant operation. Overheating occurred when the Temp Air process value (PV) reached the SP value. For further analysis, data points of the trend graph may be downloaded via the trend graph manipulation buttons (see arrow 2). Refer to Section 4.9.7 for further details. This trend graph is essentially the trend graph invoked in the Monitor page.
-
Press the back button (see arrow 3 in above figure) to return to the Alarm/Warning table.


The second subpage of Alarm/Operation History provides a list of chamber operating modes, also consisting of five columns. Operating modes are listed in a top-down order, with recent ones at the top, earlier ones at the bottom. The table can scroll up or down by swiping the touchscreen in the down/up direction, namely, swipe the touchscreen up to scroll down the table. The table in the figure only shows few items on the list; scroll down the table to view earlier operating modes recorded on the table.

| No. | Name | Description |
|---|---|---|
| 1 | Entry | Lists the entry number of each operating mode; entry number 1 is assigned to the most recent operating mode (at the top of the list) |
| 2 | Operation (mode) | Lists the type of operating mode: standby, constant, program, remote access, etc. |
| 3 | Details | Lists a brief description of each operating mode; detail is listed only for alarm and program mode |
| 4 | Date/Time | Lists date and time when the operating mode or event took place |
| 5 | Trend Graph | Provides an access link to view the trend graph when the operating mode (or event) occurred |
The following procedure outlines the steps to open a trend graph to view details of a tripped alarm, entry number 135 in the table, that occurred during the chamber constant operation. The alarm (entry 135) is selected for this example to coincide with that in Section 6.4.1, since this incident may reflect real event during a production run.
Procedure: Example
-
Locate entry 135 (first column) for the Alarm, as depicted in the figure below. Press the trend graph icon (see arrow).
-
The timeline in the trend graph specifically covers the alarm mode that occurred at 3:41 PM. According to the plot, alarm was tripped due to overheating that occurred when the Temp Air process value (PV) reached the SP value. Data points of this graph may be downloaded (see arrow 2) for analysis. Refer to Section 4.9.7 for further details.
-
Press the back button (see arrow 3 in above figure) to return to the operating mode table.


Percentage of each operation mode according to the logged data is presented as a donut chart to provide a quick overview of the overall operating statistics of the chamber, as depicted in the following figure.

The Set Protection page allows the operator to protect the log-in process on the HMI. It has the On/Off option for the user to set HMI automatic login. By default, the HMI automatic login is On. To protect the user HMI login, set it to Off.
This page also offers other features to extend or limit control on the GL controller system for remote access. The GL controller system offers two unique remote-operation options when it is connected to the local network: (1) remote access via a Web browser on a PC or other web-based device on that local network, and (2) remote access via direct communication with GL native text commands through TCP/IP (LAN communiation) or serial interface. These two options are configurable on the HMI.
| No. | Description |
|---|---|
| 1 | HMI autologin; User has option to enable or disable HMI auto login as an extra protection. |
| 2 | Three control options are available for remote communication via TCP/IP or serial interface: (i) Disabled, (ii) Monitor Only, and (iii) Monitor and Control. When option (i) is selected (Disabled), remote communication is blocked; when option (ii) is selected (Monitor Only), only monitor commands can be issued; when option (iii) is selected (Monitor and Control), both monitor and set commands can be issued. |
| 3 | Remote access to the GL controller system with full control and operation via a Web-based device; e.g., access via a Web browser running on PC or handheld device on the local network. |
| 4 | Configuration options for Multicast DNS (mDNS) name resolution on the local network. mDNS provides a quick way to resolution hostname on the local network; access to a device via its hostname need only include the dot local (.local) attached to the target hostname. This option is secondary to No. 3. |
Note: Configuration options No. 1, 3 and 4 (in the above table) can only be performed directly on the HMI. If the GL controller system is accessed via a Web browser, only remote TCP/IP or serial communication option is available, as depicted in the following figure.
The following procedures provide a quick way to enable (or disable) HMI autologin, remote TCP/IP or serial communication and remote access via a Web browser.
The HMI automatic login feature can be disabled or enabled for extra protection.
Procedure:
- With the system already turned On, access the Home page.
- Press the Set Protection (User Settings) button.
- Press the Off button
Direct communication with the GL controller at the text-command level is achievable with the remote TCP/IP or serial communication protocol. Remote communication option can be set to issue only monitor commands or monitor and control commands; it can be disabled completely to lock out communication. By default, the GL controller uses TCP/IP for remote communication to offer both speed and convenience. If remote serial communication is desired and it is available as an optional feature on your GL controller system, it can be set via the appropriate button (refer to the previous figure in Section 6.5).
Procedure:
-
Log in as user with administrative privilege; the localhost user that the system uses is a viable option.
-
Access the Home page and press Set Protection (User Settings) (see arrow).
Note: If this button is not available, select Setup (in the menu bar), then press the Set Protection (User Settings) button (see arrow).
-
Press the Monitor and Control button in the Remote TCP/IP Communication field (see arrow)
Refer to Section 7.1.6 for details on how to use remote TCP/IP communication via an SSH terminal emulator, called PuTTY.
Note: Remote TCP/IP communication protocol operation is unaffected by the setting of network remote access for a Web browser (discussed in the next section). Therefore, remote TCP/IP communication can be enabled and used independently of the Web-browser remote access setting (discussed below).
The following procedure provides steps to enable local network remote access for GL controller to be accessed remotely via a Web browser for control and operation of the chamber.
Procedure:
-
Log in as user with administrative privilege; the localhost user that the system uses is a viable option.
-
Access the Home page and press the Set Protection (User Settings) (see arrow).
Note: If this button is not available, select Setup (in the menu bar), then press the Set Protection (User Settings) button (see arrow).
-
Press the HTTP/HTTPS Access button (see arrow), followed by Yes to confirm the action.
-
The GL controller system will reboot to apply the setting.
-
To confirm the setting (if it was applied successfully) following the reboot, repeat Step 2.
-
To find out what IP address (or hostname) the GL controller system is using, refer to Section 7.1.4 for details.
-
To access the GL controller system from a PC on the local network, launch a Web browser (e.g., Chromium, MS Edge, Firefox, Google Chrome), then in the URL field, enter:
or
where IP or hostname was obtained in Step 6 (above).
Here are two examples of GL controller UI on Google Chrome accessed via its IP address and its hostname, respectively.
The following figure is the GL controller UI accessed on Google Chrome via the IP address with:
The following figure is the GL controller UI accessed on Google Chrome via the hostname with:
The GL controller system is quite robust. It is designed with a dual-partition operating system (i.e., firmware) to complement one another. Should one firmware fail, the other one can be booted to operate in place of the failed one. Technically, the system keeps two versions of the firmware: (1) Current version of the operating firmware, (2) Previous stable version. Initially, the GL controller system is shipped with identical firmware on both partitions. These two partitions eventually hold different versions of the firmware as updates have been applied. In this process, one partition is active and the other is passive.
Firmware update with bug fixes or upgrade with new features can be performed in one of two approaches:
- Automatic firmware update,
- Offline (manual) firmware update.
It incorporates a mechanism to protect its stable operation during a firmware update.
After a successful update, the GL controller system switches to run on the new firmware. All configuration and data log files are brought over to operate on the new firmware. If firmware update fails, the GL controller system returns to run on its previously known stable state version until the update issue is resolved. This process ensures that the GL controller system (and chamber) is always up and running without disruptions.
The ROM/Firmware Information page consists of three subpages: (1) Installed Version, (2) Over-the-Air Update, and (3) Manual Update. They are described in the following sections.
The Installed Version page displays information of the GL controller system that includes name of the package, operating system ID and control version, front-end and back-end versions.

Information on this page can be used to check against the version released by ESPEC.
The Over-the-Air Update page displays information about automatic update and remote management service. The process provides remote service support with risk tolerant and efficient over-the-air update via a cloud service provider (called Mender IO) through a unique registration number linked to each GL controller system (and chamber).

Automatic firmware update is enabled by default with the check mark in the box (depicted in the figure). Over-the-Air update can only happen if the target GL controller system has access to the Internet. This update option can be disabled by the customer by unchecking the box. If a new update package is available, update process will commence when the target chamber is in standby mode.
The Remote Management Service is a feature that allows ESPEC software engineering team to access and troubleshoot the GL controller remotely through Mender. It is disabled by default indicated by the red triangle status icon, depicted in the figure.
Customer and their IT department have complete control and freedom to dictate the use of Mender cloud service and Remote Management Service. Should they decide to use the service, they must proceed as follows:
- Set GL controller system with access to the Internet
- Start the GL controller system
- Access the Firmware submenu under Settings
- Enable the Remote Management Service (check the ``Enabled'' box)
- Save the setting via the Save button (in the upper-right corner)
- Reboot the GL controller system via the Accessory page (refer to 6.11 for details)
Manual firmware update can be performed right on the chamber via its HMI. This option is made possible for the GL controller system that operates as a stand-alone system, isolated and not part of a network, where automatic Over-the-Air update cannot be completed over the Internet.
Procedure:
-
Obtain Firmware Update Package from ESPEC and put it on a USB device
-
Set the chamber in Standby mode
-
Plug the USB device (from step 1) into the USB port as shown:
-
Press Setup (see arrow 1) followed by ROM/Firmware Information; press Manual Update subpage (2), then press Browse (3) to select the update package from the list on the USB device and press Accept.
-
The system begins to upload the update file which will take several minutes.
-
When update is complete, reboot the system with the REBOOT button.
-
The GL controller system has been updated. Its new firmware version can be found under the Installed Version page.

Manual firmware update via a local network is another alternative option. Instead of updating the firmware on the HMI, the process is done remotely from a PC on the network.
Procedure:
-
Obtain Firmware Update Package from ESPEC and put it on the PC (or USB).
-
Launch a Web browser on the PC. Access the GL controller system via its hostname or its IP address. Refer to Chapter 8 for details on the URL format.
-
Set the chamber in standby mode.
-
Access the ROM/Firmware Information page.
-
Click Browse (see arrow). Navigate to the folder that holds the firmware update package. Drag-and-drop the package in the white box (indicated by the arrow), or click the white box and browse through a folder for the package on the local computer.
-
Once an update package has been loaded, the system begins to install the new firmware, as shown in the following figure.
-
Click REBOOT, as indicated in the figure, to restart the system.


The GL controller can rollback its firmware to the previous stable state via the Rollback button (depicted in the figure). Rollback can be performed at any time.

Frost may form on the cooler in temperature operations below 40 °C. Defrost the chamber in the following cases.
- If temperature inside the chamber is uncontrollable or rises slowly.
- If air blowing from the chamber is weak (when the door is opened).
- If frost or ice forms on test area wall.

There is no automatic defrost operation; hence, this option is greyed out (see above figure). Defrost must be operated manually. The following procedure outlines the general steps to conduct defrost on GL chambers. Refer to your specific chamber manual for instructions on manual defrost operation.
Procedure:
-
Check the main power switch is in the ON position. If the GL controller system is already on and its touchscreen is in sleep mode, tab your finger on the touchscreen and proceed to Step 2. Otherwise, set the main power breaker in the ON position. Within a minute, the touch-screen display will come on. The system automatically logs in using the default user account (called localhost) to operate the chamber.
-
Press the Hamburger menu (1) in the status bar. Check to confirm the floating keyboard is enabled. A diagonal bar over the keyboard indicates it is disabled. Press the keyboard (2) to enable it. Press Configuration (3); then press Operation Process (4).
-
Confirm that the following settings (see arrows) are configured such that the operation is not interrupted or an alarm generated if the chamber is run with the door cracked slightly.
-
Select one Constant mode (say, Constant 1); make notes of its original settings. Set target temperature to a minimum 70 degrees and set humidity and refrigeration control OFF. (It is unnecessary with temperature-only chambers.)
-
Start Constant 1 for about 60 minutes with the door closed.
-
Start Constant 1 again for 15 minutes with the door slightly cracked.
-
Return settings to their original configuration if modification was made in Step 3 (using the recorded notes).


Power OFF: Set the main power breaker in the OFF position.
Running time meters (i.e., accumulation of operation time) of the vital hardware devices inside the chamber indicate how long each device has been in operation. The high-stage and low-stage compressor, as well as the humidity system, are part of the list. These components are operated by motors; and motors with moving parts are subject to wear. Running time meters are recorded as Total Elapsed time and Time Since Service; they provide information for recommended maintenance when each device has reached its critical service and total runtime.

| No. | Category | Description |
|---|---|---|
| 1 | Device Index | Lists all vital devices in operation by index |
| 2 | Device Name | Lists all vital devices in operation by name |
| 3 | Total Elapsed Time | Lists total runtime of each device in operation |
| 4 | Total Since Service | Lists total runtime since previous service maintenance |
| 5 | Reset Button | Lists reset button for each listed device |
If a component has been serviced (or replaced), its record of operation time should be reset. The following procedure outlines the steps to reset the meter on the Humidity System (item 4 in the previous figure).
Procedure:
-
Press Setup in the (left) menu bar (see arrow 1). Press Set Time Meters (arrow 2).
-
Press the reset button of humidity system (arrow 1). Press Yes (arrow 2).
-
The humidity system time meter has been reset.


The GL controller automatically records back trace data during operation. The data contain set points and process values of temperature/humidity and control value information of other components required to control the GL controller instrumentation. If an alarm occurs during operation, the GL controller completes the recording of the back trace data. The data can then be downloaded and sent over to Espec diagnostic service for analysis to determine the cause of equipment failure (if any) which lead to an alarm. The customer will be provided with the diagnostic results of the equipment before and after the occurrence of an alarm.
Up to ten back trace data are kept on the list at all time. The first back trace data drops from the list to allow the next back trace data to take the spot; and this process repeats indefinitely in a first-in first-out queue. Back trace data can be manually generated via the Manual Trigger button (item 6, below).

| No. | Category | Description |
|---|---|---|
| 1 | Alarm | Alarm notification |
| 2 | Alarm ID | Lists ID number of alarm |
| 3 | Device | Lists device or component that tripped an alarm |
| 4 | Date/Time | Lists date and time alarm occurred |
| 5 | Download Button | Lists button to download back trace data |
| 6 | Manual Trigger | This button allows a manual generation of the back trace data |
The following procedure outlines the steps to access and download the back trace data associated with an overheating alarm ID 003-3000 (depicted in the previous figure) as an example. The data will be exported out to a USB device connected to the GL controller system.
Procedure:
-
If the GL controller system is already on and its touchscreen is in sleep mode, tab your finger on the touchscreen and proceed to Step 2 (below). From a cold start, set the main power breaker in the ON position. Within a minute, the touch-screen display will come on. The system automatically logs in using the default localhost user account to operate the chamber.
-
Plug in a USB device into the USB port (see arrow) at the front of the chamber.
-
Press Setup in the menu bar (see arrow 1). Press the Set Back Trace tab (see arrow 2).
-
Locate alarm ID 003-3000 (see arrow 1). Press the export button (see arrow 2) to export the data file out to the USB device.
-
Back trace data will be stored (automatically) in the external USB device as MS Excel format with extension .xlsx with with date/time stamp associated with the alarm.


The back trace data can be created manually in case a diagnostic analysis is needed.
Procedure:
-
Press the Manual Trigger button (see arrow 6).
-
The GL controller reads the most recent back trace log and generates the data which may take between 5 to 8 minutes to complete, as indicated by the notification message and the rendering arrow.
-
Once data generation is complete, the data file is populated at the bottom of the list. To fetch the data, press the export button (see arrow).
-
Data file will be exported out to the attached USB device. If this procedure is performed on a PC accessing the GL controller system remotely on a network, the data file will be downloaded and stored in the Downloads folder on the PC. Filename of the data is associated with the current date and the key word ``manual'' with extension .xlsx. The data can be open and viewed on MS Excel.


Data log can be archived as data backup using Samba. This feature (and this page) requires an administrator's privilege to configure the data backup.

Procedure:
-
Log in as admin
-
Select the Setup menu (in the menu bar)
-
Select the Data Download (Log Data Backup) submenu
A shared folder must be created on the target server (or computer) that hosts a Samba share. Then complete the following steps:
-
Turn on Samba with the check mark in the box to enable the feature. Note: If this box is not checked, all the required fields are grayed out (cf. previous figure).
-
Set the backup frequency via the drop-down menu. Three options are available: (1) every 5 minutes (default), (2) Once per hour, and (3) Once per day.
-
Enter the correct path to the shared folder on your server.
-
The shared folder requires the complete credentials (username and password). Enter them in the appropriate fields, along with the correct domain as may be part of the shared folder.
-
Apply the Save button (red dot, bottom of menu bar) to save the settings.

The Accessory page allows the operator with two control options: (1) HMI screensaver and (2) GL controller power management. The HMI screensaver option is available (and visible) only when operated on the HMI. The following figure depicts both the HMI screensaver and power management options. The hour meter information is posted at the top of this page to indicate how long the instrumentation has been in operation.

| No. | Name | Description |
|---|---|---|
| 1 | Hour Meter | Displays hour meter information of the chamber |
| 2 | HMI Screensaver | Timeout screensaver; only available on HMI operation |
| 3 | Power Management | GL controller power management options |
The GL controller system has a screensaver feature to control the HMI display with timeout options in 10 minutes, 30 minutes and 1 hour, as depicted in the above figure. With a 10-min timeout setting, the HMI display goes to sleep if there are no activities on the HMI screen for 10 minutes. The GL controller system continues in its operating mode, while the HMI is in sleep mode. To turn the HMI display back on, simply tab the finger anywhere on the HMI screen once and wait for about four seconds for it to illuminate.
Sometimes, certain services of the GL controller system may stop working due to a momentary disruption, such as a network was unplugged; and that service refuses to restart automatically. The Restart Services button can be used to manually restart those services.
Sometimes, a certain setting may require rebooting the GL controller system. For example, if a firmware update is performed manually via the HMI screen, the GL controller requires rebooting via the Reboot Controller button. This action will reboot the operating system of the GL controller, while the chamber and its components remain powered on.
During a reboot process, the operating system starts all processes to reconnect communication and verify the configuration on the GL controller and the chamber operation. Within in a minute, the HMI display comes on. The GL controller system automatically logs the localhost user in for operation.
The display and layout of Home and Submonitor Page 2 and Page 3 are customizable by manipulating the elements of the UI, called widgets, via the edit button in the secondary menu. With this feature, the user can personalize the widgets on these pages to streamline the operation and functionality, such as creating a shortcut. The entire layout of the Home and Submonitor Page 2 is customizable; only a few elements or widgets on Submonitor Page 3 are customizable.
Home: The following figure depicts the home page in edit mode. All customizable widgets are indicated by the edit button (see arrow). Note: Submonitor Page 2 and 3 are similar.

| No. | Name | Description |
|---|---|---|
| 1 | Add/Create | Create a new widget; a new widget is placed at the bottom of the current page. |
| 2 | Save | Apply the changes to the current page |
| 3 | Back | Cancel; press this Back button, followed by Yes, to cancel the current settings and return to default setting. |
A widget selection window appears when any widget button is activated (see arrows), as depicted in the following figure.

Four separate menus (Links, Monitor, Start/Stop and Color) of the widget page provide different options to customize the functionality of Home, Submonitor Page 2 and Page 3.

| No. | Name | Description |
|---|---|---|
| 1 | Links | This menu provides four different categories to select and link a widget for the shortcut: General Links, Monitor Links, Setup Links and Configuration Links. |
| 2 | Monitor | Displays and provides widget selection options related to the Monitor menu, including Chamber Status Items, Temperature, Humidity, Time Signals and General Items. |
| 3 | Start/Stop | Displays and provides widget selection options related to the Operation Mode menu, namely Constant Run and Program Run. |
| 4 | Color Options | Displays a list of color options for personalization and customization. |
| 5 | Active Widget | Displays the active widget of the menu buttons (Operation Mode, Monitor, Set Mode, Setup)--the widget on which the edit button was activated; this widget will be replaced with the selected one. |
| 6 | Delete | Delete button; this button deletes the current widget. |
| 7 | Close | This button closes the current page (the widget page). |
General Links: The general links page consists of widget selection options from four different categories as depicted in the figure.

Monitor Links: The monitor links page consists of four separate display categories for monitoring options, as depicted in the figure.

Operation Links: The operation links page consists of two separate categories related to Constant Run and Program Run options.

Color Options: The color option page consists of a list of different color selection used for decoration or personalization, as depicted in the figure.

The following procedure outlines the general steps to edit the links on the Home page. The procedure can be applied to Submonitor Page 2 or Page 3.
Procedure:
-
Decide on what shortcut or widget to edit (e.g., menu or operation button, or display panel).
-
Access the Home menu.
-
Press the edit button in the secondary menu (see arrow).
-
Press the edit button of the desired widget to be edited (see arrow). Example: Edit the Start Prog. 1 widget.
-
Select a new widget to replace the current one. Example: Select Set Sampling (see arrow). Note: Program 2 or 3, etc., may be selected. This example illustrates that any widget can be used as a replacement. To remove the selected (current) widget, press Delete; to close the widget selection window, press Close.
-
Press the check button, followed by Yes (in dialog box), to save the setting. Or, press the back button followed by Yes to cancel the editing task.


The following procedure outlines the general steps to create a new link on the Home page. The procedure can be applied to Submonitor Page 2 or Page 3.
Procedure:
-
Decide on what shortcut or widget to create (e.g., menu or operation button, or display panel).
-
Access the Home menu.
-
Press the edit button in the secondary menu (see arrow).
-
Press the plus (+) button to create a new widget (see arrow).
-
The new widget is placed at the bottom of the display area (scroll down if necessary to access it).
-
Press (or Click) and drag the widget to a desired location.
-
Press the edit button of the widget to create a new link (see arrow).
-
Repeat steps 4 through 6 in Section 6.12.2.


The GL Configuration menu, being part of the Setup menu outlined in Chapter 6, is the administration page where different settings and configuration options can be applied to the GL controller and the chamber. For this reason, this page should be off limit to regular users. User privileges can be enforced via the Users (Register User Password) setup page. Refer to Section 7.4 for details.
Under this menu, the following can be configured: Set Communication, Operation Process, Control Attainment Range, Time Signal Names, Display Setup, Set Language, Set Sound, Set Date/Time, Users (register users and passwords), Sensor Offset, Set Chamber Details, Set Option, Email, Service and Macros.
The GL controller system supports four different communication methods: RS485, RS232, GPIB and LAN. The LAN is the standard setting.

| No. | Name | Description |
|---|---|---|
| 1 | Path indicator | Path to Set Communication; it indicates the path to the Set Communication via the Menu bar or the Hamburger button |
| 2 | Communication Type | Lists of types of supported communication: RS485, RS232, GPIB, LAN. |
| 3 | LAN Communication | Configuration page for LAN communication; it is the standard setting. |
| 4 | Network Status | Display network status, interface and configuration protocol |
The following figure depicts the RS-485 setup screen. When attempting to communicate via the RS-485 protocol, make sure the configuration on the client side has a matching set of parameters illustrated in this figure (described in the accompanying table). This setting overrides that on the client device. RS-485 (Recommended Standard-485) is a serial interface standard for multipoint communication lines that was adopted by the Electronic Industries Association (EIA).
Note: The RS-485 setting used here is the standard protocol. Therefore, the protocol selection and echo back options are not available.

| No. | Name | Description |
|---|---|---|
| 1 | Address | Specify the address number from 1 to 16. The address number is assigned to identify the chamber. Make sure that it is not the same as the address of other chambers connected. |
| 2 | Delimiter | End packet signal with delimiter with option CR, LF or CR+LF. Make sure to select CR+LF (default setting). |
| 3 | Baud Rate | Select from 4800, 9600, and 19200. Default setting is 9600. |
| 4 | Parity | Select from None, Odd, and Eve. Default setting is None. |
| 5 | Data Bits | Select from 8 and 7. Default setting is 8bits. |
| 6 | Stop Bits | Select from 1 and 2. Default setting is 1. |
RS-232C (Recommended Standard-232) is a serial interface widely adopted for transmission between computers and peripheral devices. It is based on a communication standard of the EIA.
The RS-232C setup screen follows the similar configuration protocol of the RS-485 with the exception that it does not have an address. When attempting to communicate via the RS-232 protocol, make sure the configuration on the client side has a matching parameter as illustrated in this screen; it overrides that on the client device.
The General Purpose Interface Bus or GPIB is a standard parallel interface used for attaching sensors and programmable instruments to a computer. It is officially known as IEEE-488 (Standard No. 488 of the Institute of Electrical and Electronic Engineers [USA]) which was based on the HP-IB (Hewlett-Packard Interface Bus) standard of Hewlett-Packard Company, often referred to as GI-IB (IEEE-488/HP-IB).
The GPIB setup screen and its configuration option is currently unavailable/unsupported.
With the GL controller instrumentation connected to LAN, you can access the chamber to control and operate it remotely, just as you would on the HMI. The Set LAN setup screen displays the GL controller network protocol and its configuration. By default, the GL controller uses DHCP to join a LAN network. Its IP address will be provided by the DHCP server of that network.
Note: Details of network configuration and Set LAN editing are provided in Chapter 8.

| No. | Name | Description |
|---|---|---|
| 1 | Hostname | Displays the hostname of the GL controller system; it can be used to access the GL controller UI via a Web browser. |
| 2 | DHCP | Protocol option; when DHCP box is checked, IP address provided by DHCP server is used; when unchecked, the GL controller uses a static IP configuration, as shown. Refer to Chapter 8 for details. |
| 3 | IP Address | Displays the current IP address of the GL controller system |
| 4 | Subnet Mask | Displays the network subnet mask of the system |
| 5 | Gateway | Displays the gateway address for network connection points |
| 6 | DNS1 | Displays the primary Domain Name System, DNS 1. |
| 7 | DNS2 | Displays the secondary Domain Name System, DNS 2. |
| 8 | Communication Mode | Setting options to control communication mode. |
| 9 | Delimiter | Delimiter type to control communication and transmission. |
| 10 | TCP/IP Socket | Communication port selection options. |
With LAN connection, direct communication with the GL controller via its native text commands can be accomplished remotely that can bypass control on the HMI or the Web browser interface. This type of communication can take place via this LAN Communication Test page locally on the HMI or remotely on the Web display.

| No. | Name | Description |
|---|---|---|
| 1 | Command Prompt | Issue raw commands here; commands must contain command and delimiter, using the correct syntax of command structure. The prompt supports history commands; previous commands can be recalled with the up-arrow key for editing and reinvocation. |
| 2 | Response Data | Displays responses returned by the GL controller; previously issued command may be re-executed (re-invoked) by clicking on it. |
The following procedure outlines the steps to open the command prompt to issues raw text commands to the GL controller, locally or remotely from within the GL controller UI.
Procedure: LAN Communication Test on HMI or Web Display
-
Press/click Setup (in the menu bar or main home page); press/click Configuration; press/click Set Communication; press/click LAN Communication Test (see arrow).
-
In the command prompt (see arrow), enter: date? and press Enter; enter: rom? and press Enter; enter: temp? and press Enter. Results are shown as follows.
-
To exit the LAN Communication Test page, access any menu outside of this page.


The most practical approach is via a terminal emulator, such as Termite or PuTTY, where raw text commands can be issued directly to the GL controller. Refer to GL Controller Communications Manual for details on GL controller native text commands and its instruction set.
Examples of GL controller text commands issued on the LAN Communication Test page and via PuTTY terminal emulator are provided as follows.
Procedure: Remote control via PuTTY
-
Download the executable or installable package for the desired platform from the PuTTY official web site: https://www.putty.org.
-
Look up the IP address of the GL controller on the Set Communication page, indicated by the IPv4 Address field, under the eth0 column (see arrow).
-
Launch PuTTY on your PC and follow the procedure in the diagram to connect to the GL controller.
- Enter IP address found in (2). Example: 10.30.200.247
- Enter port number 10001 in the "Port" field (in place of default 22)
- Select Raw for connection type
- Click Open to start the communication session
-
Enter "date?" and press Enter; enter "rom?" and press Enter; enter "temp?" and press Enter. Results are shown below.
-
To end communication, click X and confirm the exit.


To keep an accurate date/time of the data log, it is important to have the correct date/time on the GL controller. Data log will bear a date/time stamp used by the GL controller. By default, the GL controller date/time is synchronized using the Network Time Protocol (NTP) server provided by the Debian network time pool.
Based on this setting, the synchronization can only occur if the GL controller has access to the Internet. Without Internet connection, the NTP server of the Debian network time pool does not work, and the date/time of the GL controller will be out of sync as it may drift from the real time. The purpose of NTP is to apply skewness to the date/time such that it always remains in sync. If your network has its own NTP server, the GL controller can use it. Without a local NTP server, you can still adjust the date/time manually or synchronize it using a local device such as your laptop or PC.
On the HMI, date/time information of the GL controller is displayed on the status bar, next to the login status icon. This information is also found on the Set Date/Time page, as depicted in the following figure.

| No. | Name | Description |
|---|---|---|
| 1 | Set Date/Time | Displays date/time setting options |
| 2 | Time Zone | Displays selected time zone currently used by the GL controller; apply radio button to select a desired time zone from the list. |
| 3 | NTP Setup | Lists current NTP server |
| 4 | Add | Additional NTP can be added via this button |
The following procedure outlines the steps to adjust date/time and local time zone.
Procedure: Date/Time and local time zone adjustment on HMI
- To adjust the date, press the calendar icon (see item 1) and select a new date.
- To adjust the time, press the clock icon (see item 1) and select a new time.
- To adjust local time zone, press the radio button (see item 2) and select a desired time zone on the list.
- Press the Save button in the secondary menu to apply the new setting.
On the Web display, this information can be found on the Set Date/Time page itself, as depicted in the figure.

| No. | Name | Description |
|---|---|---|
| 1 | Set Date/Time | Displays date/time setting options: Automatic or Manual. |
| 2 | NTP Setup | Displays list of current NTP servers with priority queue from top to bottom; each can be removed via its trash bin icon. |
| 3 | Add | Additional NTP server can be added via this button; it is added to the bottom of the list, acting as the last queue on the list. |
The following procedure outlines the steps to adjust date and time manually.

Procedure: Manual Date/Time Setting
Note: The calendar and clock inputs are Web browser dependent. Each Web browser provides calendar and clock drop-down pickers differently. For example, Firefox does not support the clock picker. The screenshot in the above figure was based on Google Chrome.
- Click the Manual button (see arrow 1) to turn on calendar and clock options.
- Enter new month/date/year values in the field (see arrow 2) or click the calendar icon (see arrow 3) to adjust the month (year) and date using the drop-down calendar.
- Enter new hour:min:sec values in the time field (see arrow 4) or click the clock icon (see arrow 5) to adjust the time using the drop-down clock values.
- Apply the setting using the Save button in the secondary buttons.
If the GL controller does not have access to the Internet, its clock will drift and eventually be out of sync with the real clock. In order to apply autonomous date/time and synchronization, the GL controller must have access to a local time server. This local time server can be added to the top of the NTP list to take priority.

| No. | Name | Description |
|---|---|---|
| 1 | NTP | Displays NTP hostname or IP address |
| 2 | Delete | Use the trash bin icon to remove NTP from the list |
| 3 | Add | Add additional NTP to the bottom of the list |
| 4 | Save | Apply and store the current setting with the save button |
The following procedure outlines the steps how to use a local time server.
Procedure:
- Edit the top NTP entry with your local timer server using either its IP address or its hostname.
- Remove the rest of the Debian NTP server using the trash bin. This procedure ensures that the system will not attempt to access Debian NTP server to apply date/time synchronization.
- Save the setting via the Save button.
To restore the NTP server using Debian date/time protocol, apply the following steps. To ensure successful date/time synchronization, four different Debian NTP servers are used, numbered from 0 to 3. For instance, if the first NTP server does not respond, the second one will be used, and the process continues to the last one on the list.
| NTP Server # | NTP Hostname or IP Address |
|---|---|
| 1 | 0.debian.pool.ntp.org |
| 2 | 1.debian.pool.ntp.org |
| 3 | 2.debian.pool.ntp.org |
| 4 | 3.debian.pool.ntp.org |
The Operation Process page provides options to manage and control the chamber operation when it is interrupted abruptly. In default setting, the chamber will stop any test after resuming from a power outage (that occurred during testing); test operation continues uninterrupted when door is open; door open warning is set to Off. These three default settings are depicted in the following configure. However, all of them are customizable.

| No. | Name | Description |
|---|---|---|
| 1 | Power Fail Recovery | Chamber operation after power failure recovery. Two options are available: (1) Continue Test, (2) Stop Test. Default setting is Stop Test. |
| 2 | Door Open Action | Displays available options with Continue, Pause and Stop Test. The Pause and Stop Test options can be adjusted with delay time in x minutes. |
| 3 | Door Open Warning | Displays available options with On and Off. The On option can be adjusted with delay time in x minutes. |
| 4 | Save | Use the Save button to apply and store new settings on alarm or warning beeper. |
| 5 | Back | Use the Back button to exit the current page. |
The following procedure outlines the steps to set the chamber to stop test after x minutes when the door is open.
Procedure:
- Press/click the Stop Test button
- Enter x minutes in the minute field. Refer to Sections 2.4.4 and 2.4.5 on how to turn on the keyboard/keypad when operating on the HMI.
- Press/click the Save icon/button to save the setting.
- Press/click the Back icon/button to exit.
The GL controller supports and allows multiple operators with separate user accounts to control and operate the instrumentation. Each user account has specific roles with read/write privileges to access and operate the system. By default, three user accounts exist on the system, as depicted in the figure. The layout of the Users page displays specific roles associated with these users; each may be assigned with specific roles according to the selection in the drop-down list.

For HMI operation, the localhost user has specific roles to operate and control the chamber, including settings in the configuration menu. Refer to the following table.
For remote access and operation via a network, each user with specific roles on read/write privileges can log in to the GL controller system to operate the chamber. Refer to the following table.

| No. | Name | Description |
|---|---|---|
| 1 | Account Property | Displays account username and password |
| 2 | Access Properties | Displays read/write privileges associated with the five menus: Home, Operation Mode, Monitor, Set Mode and Setup. Each menu has three access privileges in the drop-down list: RO (Read-Only), RW (Read-Write), NA (No-Access). Different privileges can be assigned to each account using options from the drop-down list. |
| 3 | admin | Displays administrator (admin) account. Default credentials for this user account are username: admin, password: admin. This account is generally assigned with complete powers to the GL controller system. |
| 4 | localhost | User account granted with specific roles with read/write privileges to access and control the instrumentation |
| 5 | Add | Create new user account using this button |
| 6 | Delete | Remove user account using this trash bin |
Note: Refer to Section 2.6.2 for details on the localhost and how to log in or out of the account.
The following procedure outlines the steps to create a user account (called technician) and set certain access privileges to the menu properties. The user can access all operation menus except Setup.

Procedure:
- Add: Click the add button (callout 1). Refer to the callout in the above figure.
- Username: Enter username under the Username column.
- Password: Enter the password for this user in the Password fields (twice).
- Access Privileges: Click and select access privilege (No Access, Read Only, Read Write) for each menu. Repeat the process for the rest of the menus.
- Save: Click the Save button at the upper-right corner to save the settings.
This new account will be available for use immediately after the Save button is applied.
The following procedure outlines the steps to remove a user account from the GL controller system.
Procedure:
- Ensure that the user has logged out.
- Locate the user account to be deleted.
- Click the trash bin next to the account to be deleted.
- Save: Click the Save button at the upper-right corner to save the settings.
Conditions of the attainment range and the attainment time can be used to determine whether the chamber has reached the exposure temperature (i.e., set points). The status where the process value falls within the attainment range of the set point for a certain period of time or longer is considered as a set point attainment; that the control is being attained.

The processing of controlling attainment range is active in the following conditions.
- Soak control of a program step
- Temperature attainment output (optional)
- Humidity attainment output (optional)
The attainment range must be smaller than the upper and lower deviations, as depicted in the following graph.

Procedure:
- Set the attainment range (temperature, humidity). Input range: Temperature: 0.1 °C to 100.0 °C; humidity: 1 %RH to 100 %RH
- Set the attainment time. Set the attainment time for each of temperature and humidity. Input range: 0 to 9999 seconds.
- Set the attainment range and attainment time of the product temperature (only when option is installed). Input range: 0.1 °C to 100.0 °C; 0 to 9999 seconds.
Set the correction values of the install temperature input sensor. By setting the correction values for the sensors input value, you can compensate for changes over time and adjust the differences between the chamber and other measuring instruments. Therefore, the goal of sensor calibration is to match the values with those of a calibrated device (the reference device) at all times, not to correct for control errors. Also, these correction values are enabled for all measured values such as the monitor screen and the trend graph.
Perform correction for the input value of the temperature (dry-bulb) sensor, humidity (web-bulb) sensor, specimen temperature control sensor (optional) for measuring the temperature and humidity in the test area.
The purpose of this offset adjustment is to adjust the process values for the already calibrated instruments and not to correct control system errors. In addition, the correction is reflected in all process values, such as the monitor screen, trend graph, and monitor output (optional output terminal for temperature recorder).
Procedure:
- Set the correction value of the offset adjustment.
- Set the correction value to be added to or subtracted from the sensor in the range of +/- 5 °C.
- After entering the value, the value corrected to the sensor input value is displayed at the Process Value.
Procedure:
- Press Set/Calibrate sensor on the Configuration screen.
- Enter the correction values. Press an entered value to display a numeric keypad, and then enter the correction value. After you entered the value, the corrected sensor input value will be displayed under the
| Reference |
|---|
| If precise calibration is required, contact ESPEC. |
The names of time signals may be defined by the user. As depicted in the following figure, both the full and short name can defined, along with the On/Off labels.
Note: The number of available time signals depend on the options and/or specifications of the chamber.

| No. | Name | Description |
|---|---|---|
| 1 | Full | Displays full name of time signal. |
| 2 | Short | Displays short name of time signal |
| 3 | On | Displays On label; it can be defined with descriptive name/label |
| 4 | Off | Displays Off label; it can be defined with descriptive name/label |
Once defined, time signal names and labels will appear in the display monitor, Constant and Program setup pages.

The following procedure outlines the steps to customize the time signal names and their On/Off properties (labels), using Time Signal 1 as an example.
Procedure:
-
Access the Time Signal Names page based on the menu sequence: Setup > Configuration > Time Signal Names. If this performance is done via the HMI, refer to Section 2.4.4 and 2.4.5 on how to enable the keyboard/keypad for input.
-
Enter "Dry Air Purge" in the field indicated by callout 1; enter "DAP" indicated by callout 2, "Start" by callout 3 and "Stop" by callout 4.
-
Save the setting using the Save icon (callout 5) and confirm the action in the pop-up dialog.

The Set Chamber Details page is not available via the GL controller software system; hence, it is grayed out.
The Display Setup page provides a number of customization options for user interface theme, startup display tab/menu, HMI screensaver timeout, user interface zooming and sub-tab (submenu) position memory.
Note: Customization options differ slightly between the HMI display and the remote Web display. Only three options--startup display tab, user interface theme and sub-tab position memorization--are available for customization via the remote operation on the Web display (see Section 7.9.2).
The label associated with each button indicates its specific setting and behavior. As depicted in the following figure, the highligted buttons indicate the selected options. To customize the setting, press the desired button.
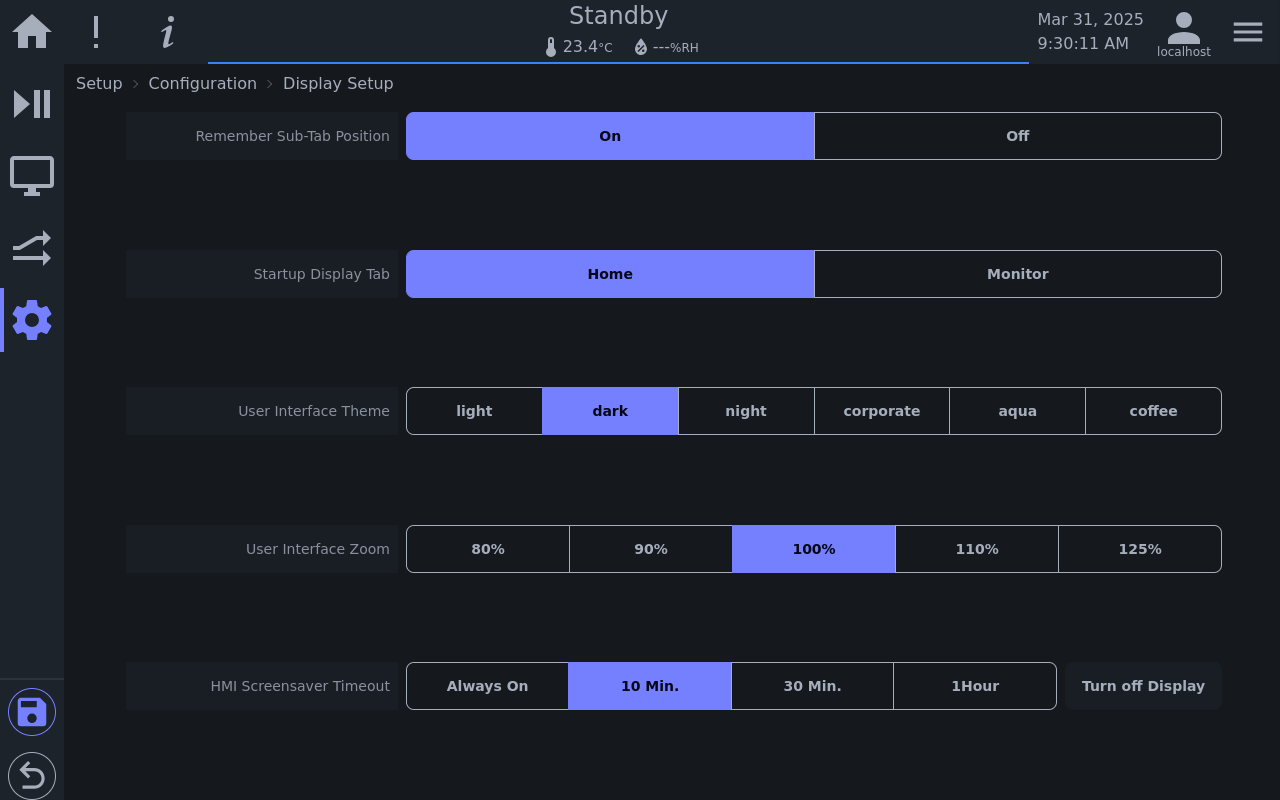
The label associated with each button indicates its specific setting and behavior. As depicted in the following figure, the highligted buttons indicate the selected options. To customize the setting, press the desired button.

The Set Option has a few setting options on proportional band, integral and derivative.

The GL controller supports multiple languages. The following list outlines the different languages currently available in the GL controller user interface: English, Spanish, Italian, Korean, Portuguese, Simplified Chinese, Traditional Chinese, German, French, Japanese, Polish, Vietnamese.
The default language is English. The list of available and supported languages on the GL controller system is under the Set Language submenu, as depicted in the following figure: Setup -> Configuration -> Set Language.
Several options are available for selecting a language. The following procedures outline the steps to set and select a desired language for the GL controller user interface. Language selection can be set under any user account and via HMI or remote Web access.
Select a language from within the Home page.
Procedure 1:
-
Press the Set Language button in the home page (see arrow).
-
Select the desired language from the list (in the Set Language page).
Select a language via the menu bar.
Procedure 2:
-
Press Setup in the menu bar.
-
Press Configuration
-
Press Set Language
-
Select the desired language from the list.
Select a language via the hamburger button.
Procedure 3:
-
Press the hamburger button (see callout 1); select Configuration (callout 2), followed by Set Language (callout 3)
-
Select the desired language from the list (in the Set Language page).
Two most important features in the Set Email page, among other things, are the admin password recovery (i.e., revert to factory setting) and automatic alert emails to authorized users. Both features require that the GL controller system has access to the Internet.

| No. | Name | Description |
|---|---|---|
| 1 | Host | Displays the hostname or IP address of the email server |
| 2 | Port | Displays the port number used by the email server |
| 3 | Send As | Displays default sender name as chamber_controller |
| 4 | Authentication | Allows options to authenticate outbound email; authentication is set by default. |
| 5 | SSL/TLS | Allows options to use encryption for outbound email |
| 6 | User | Displays user for mail server authentication |
| 7 | Password | Password field for outbound email authentication |
| 8 | Recovery email | Email address used for recovering administration password of the GL controller system |
| 9 | Alarm recipient | Enter email for each recipient to receive email alert from the GL controller |
| 10 | Save | Save and apply new settings using the Save icon in the secondary buttons |
| 11 | Test Email | Press/Click the button to test sending email alert; it requires access to SMTP Office365 on the Internet |
| 12 | Back | Returns to the previous page, thus exiting the current email page. |
The administrator's account (username admin) and password play an important role in managing the GL system security and operation. With multiple accounts and users on the system, the admin account must be kept secure so that no unauthorized users have access to it. If the account is compromised or its password is forgotten, a password recovery option can help reset the admin account.
To protect the GL controller system, the Account Recovery E-mail field must contain an email address of the administrator (or owner) who manages the GL controller system. This setup is to ensure that only the administrator who manages the GL controller can proceed with the password reset/recovery for the admin account. A one-time password will be sent to this e-mail address to recover the administrator's account.
To access the Email setup page, be sure to log in as admin (see Section 2.6.3), then access the hamburger menu (in the status bar), select Configuration, followed by Email. The figure below depicts the Email page.
Note: Section 2.11 also addresses this topic in details and provides a step-by-step setup.

Procedure:
-
Enter the admin's email address in the Account Recovery E-Mail field (see callout 1, figure above).
-
Click/Press the Save icon (callout 2) to save the settings.
The alert email feature can notify the operator in case the chamber is tripped with an alarm or with other issues. This notification may help to prevent damage to test product or the chamber itself with the operator acting to intervene the problem immediately by stopping the chamber remotely.
The following procedure outlines the steps to set up e-mail alert to receive notification of the operating conditions of the chamber.
Procedure:
-
Click Add (in the field of Alarm Recipient)
-
Enter the recipient's email address.
-
Additional email can be added by clicking the Add button.
-
The X button can be used to remove unwanted email address from the list.
-
Click Save (see callout 1) and confirm the action in the Yes/No pop-up window.
-
Click the Test Email icon (see callout 2) to test the alert email. A test email message will be sent to all the recipients on the list. If the GL controller fails to reach the Office365 mail server, the test will fail, but the setting can still be saved.

This section outlines the steps to recover the admin account and password. It should be noted that the actual process of account recovery is to reset the admin account to factory setting; and from there you can change the admin password to something more secure. For this reason, Section 12.1 (also see Section 2.11.1) should be done first and foremost to limit security breach. Once an e-mail address has been set and stored in the system, the recovery procedure will be sent to that e-mail address.
Procedure:
-
Follow the procedure in Section 2.11.1, Step 1 through Step 3.
-
Enter the admin username (admin), then press the Admin Account Recovery button (see arrow).
-
(a) If you have set up an account recovery in Section 2.11.1 with your e-mail address, and your GL system is connected to the main network, select the Send Recovery E-Mail button (see callout 1). A link to reset the admin account is sent to your e-mail account; open the e-mail and click on the link to access the GL system and set the admin password. (b) If you did not set up an account recovery in Section 2.11.1, copy the contents in the Message box (see callout 2) and compose an e-mail based on the given instruction for To and Subject, ESPEC will respond with a link to access your GL system. (c) Or, with your smartphone, you can use the QR code (see callout 3) to send a message to ESPEC for account recovery.
The Set Sound page offers two options to control the Alarm volume and Warning volume. By default, both volumes are set to maximum level.

The slider bar on each volume control can be used to adjust volume setting. The speaker icon at each slider bar can be used to turn off the volume or turn it on to maximum level.

| No. | Name | Description |
|---|---|---|
| 1 | Slider Bar | Use the slider bar to adjust the volume level to a desired setting. |
| 2 | On/Off button | Use the speaker On/Off button to turn off the volume or turn it on to maximum level. |
| 3 | Save | Use the Save button to apply and store new settings on alarm or warning beeper. |
| 4 | Back | Use the Back button to exit the current page. |
| CAUTION |
|---|
|
It is strongly advised to keep the beep on whenever possible to prevent any delay in the detection of an alarm or warning. If the beep is turned off, alarm and warning are not notified with sound and are indicated only with red blinking of the operation lamp and on warning occurrence screen. Set the beep volume in accordance with the ambient environment. |
The Service page is password protected. It is intended for use by authorized ESPEC North America service personnel.
| CAUTION |
|---|
|
Do not use attempt to change settings in the Service page. Changing parameters at yours discretion may cause an accident. This function is used by our service representatives to make various adjustments. ESPEC is not liable for any accident and injury that may be caused by the change of parameters at your discretion. |
Frequently used tasks can be automated by creating and running as a set of instructions, called scripted macros. Macros are a series of scripted commands and instructions grouped together to accomplish a certain task. These scripted commands can be triggered automatically by the state of the chamber or by an authorized operator through a manual manipulation. Automated tasks through macro-scripted actions can range from sending e-mail notification about test completion to synchronization of operation between multiple chambers.
Note: Macros operation page is inaccessible when operated locally; this menu is grayed out on the HMI. It is accessible and available for operation only via a remote access on a Web browser, as shown in the figure below.

When activated (via the button in the above figure), the Macros operation page (with its classic user interface) is displayed and operated completely inside the GL controller main display area, as depicted in the following figure.

The following figure depicts the Macros setup page with a default scripted action called Alarm Emails. The lock symbol indicates that the contents of the Alarm Emails script cannot be modified, since it was generated by the GL controller.

The submenu of Macros consists of four main operation buttons for managing and manipulating the macro scripted profiles.
Procedure:
-
Create New: A new macro script can be created via this Create New button.
-
List of Macro Actions: A list of all macro scripted profiles on the system. Click on its name to display its contents in the macro editor page (item 3).
-
Macro Scripts: The first macro script on the list (item 2) is listed in the main display by default. Its contents can be viewed using the macro editor (main display).
-
Import from local file: A macro scripted profile can be imported from the local computer. Apply this button to import a macro profile from the local computer. The macro editor will be launched to display the contents of the profile. The Save As button needs to be applied to save the imported profile; its name will appear under the list of macro actions (item 2).
Note: Many operations associated with the macros require that the GL controller has access to the Internet.
A macro script can be created to contain various trigger options. The Create New button, when clicked, launches the macro editor, within which the operator can compose the macro scripts to set different alert and trigger options. The components of the macro editor are listed as follows:

-
Name: A macro has a unique name to identify its action or task.
-
Enable: The macro action can be enabled or disabled. When enabled, trigger will take effect based on the chamber condition specified in the macro script.
-
Trigger: A macro may be triggered by any of the following types:
-
Always: The macro will run every time. This type of trigger is not recommended.
-
Never (Manual Only): The macro must be manually triggered by an authorized operator or an API request.
-
Program State: The macro script will run when an execution state in the selected program has changed based on the parameters listed in the following figure.
- Program State: Under the Program State options (drop-down menu in the above figure), a trigger alert can happen when there is a change in the program execution (designated as Program Changed), when a program has started or stopped (Program Started, Program Stopped); or a step within the executed program has changed (Step Changed), or a step has started or stopped (Step Started, Step Stopped). All of these options can be incorporated into the Program State trigger type.
- Program: A specific program may be selected to trigger the effect if the condition is met. If Any (default setting) is selected, any program will cause the trigger effect if the trigger condition during execution is met.
- Step Number: A specific step in the selected program can be used to trip the trigger effect if the condition is met, such as when step 5 in the selected program has completed its execution.
-
Alarm State: The macro will run when the state of an alarm has changed. The parameters that specify the alarm state are listed in the drop-down menu shown in the following figure. The alarm list is chamber and PLC dependent.
-
Date/Time Trigger: The macro will run at a specified time or date and time with periodic operation. When the date/time matches the configured "Month", "Day of the Month", "Year", "Day of the Week", "Hour", "Minute", and "Second" the macro will fire. This operation can be configured for a one-time trigger or a periodic trigger, as depicted in the following figures.
-
Additional trigger types can be selected from the trigger list that include time signals, loop temperature, custom expression and logical operations. All of which have the same programming or scripting paradigm based on specific parameters and trigger conditions. A single macro script can be created to monitor a list of programs, their status or conditions, using a set of complex logical operations selected from the list of trigger types (such as, and, or, not).
-
-
Multiple Trigger Types: Additional trigger types can be added via the (+/-) button, with options to insert additional trigger type using Insert Before or Insert After buttons. Trigger type can be removed from the list via the Delete button.
-
APPEND: The action or actions of the trigger (item 3, above) can be implemented in the body of the Operations template. The APPEND button can be applied to add and compose the trigger operations. The components of the trigger operations are outlined as follows:
Label Name Description a Conditional Statement The conditional statements of trigger operations consist of If, Else If, Else and Wait For. These conditional statements can be used to check the type(s) of trigger operation. b Type of Condition The type of trigger used in the conditional statement. c Additional Conditions Additional conditions can be added via (+/-) button. The available options are: Insert Before (current type), Insert After (current type), Delete. d Alert Method Available alert methods for the trigger operation. Default option is: Mail: Send a custom e-mail. e E-mail Address The operator's e-mail address in this block will be used to send an alert e-mail. Multiple e-mail addresses can used, one e-mail address per line. f Subject title A descriptive subject title is important in an alert e-mail. g Message The message in the e-mail should be brief and descriptive. h Manage Trigger Operations Steps With this button, management of trigger operations steps is possible with the Inset After, Insert Before or Delete options. i Add Trigger Operations Step The APPEND button appends an additional step at the bottom of the step list. -
Operations: Components of the trigger Operations are outlined in the previous and the following figure. The default operation type is E-Mail: Send a custom email. Different operation types can be selected from the list. Each selected type is used in the conditional statement to trip the operation. Multiple types can be implemented by applying the (+/-) button. The operation type thus consists of three fields: (1) who to send the alert, (2) subject of the alert, (3) message of the alert. Multiple operations can be added using the APPEND button to create additional or multiple operations.
-
File Manipulation: Three file manipulation options are available in the main macro editor when the Create New option is applied. These are Export to local file, Import from local file and Save.
After the macro script has been composed and saved, additional options are available as follows:
The current macro script can be deleted from the macro editor with the Delete button (trash bin). A warning appears to reconfirm the action.
This script can be invoked to test its operation by applying the person icon. If the macro operation involves sending out an alert e-mail, the recipient on the e-mail list will immediately receive the e-mail alert. The GL controller can send out e-mail alerts only if it has access to the Internet because, by default, it uses SMTP Office 365 for the email protocol.


The following example illustrates a simple macro script to send out an e-mail alert when the chamber trips an alarm (any alarm). In order for the macro setup to work, the GL controller must have access to the Internet. The procedure for this example is outlined as follows.
Procedure:
-
Click Macros in the Settings submenu.
-
Click Create New.
-
Click the Name field in the macro editor, enter ALARM01 for the macro name. Confirm that the trigger is enabled (with its box checked).
-
Click the type field under the Trigger type and select Alarm State from the list (as shown).
-
Click the Alarm State field and select Tripped from the drop-down list as its parameter (as shown).
-
Confirm that Any is selected under the Alarms option. The complete selection type, state and alarms options is depicted below.
-
Click APPEND to add the operations instructions.
-
Confirm that the logic If is selected by default to check the condition, and the condition type Always is select. This is to ensure that an alert will be sent out whenever an alarm is tripped.
-
Confirm, under the Operation Type, that "E-Mail: Send a custom email" has been selected.
-
In the Recipients block, enter the operator's e-mail address. Multiple e-mail addresses can be used, with one e-mail address per line.
-
Enter the subject title of the e-mail in the Subject.
-
Enter the message to be included in the e-mail in the Message body box.
-
Click the Save button. The macro list now has the macro script listed by its file name. If you attempt to exit the macro editor (by clicking on other submenus or menus), a warning message will appear (as shown below).
-
To test the macro script, click the person icon. The operator should receive an e-mail alert from the GL controller.


The complete macro script is depicted in the following figure.

Here is an example of the use of two logical Or conditions of the trigger type to monitor two specific programs (PROGTEST001 and PROG3TEST) and trigger the e-mail operation. Two logical If conditions monitor the program state and alarms; an alert is sent out accordingly. The first If condition is set up to monitor the program activity; the second If condition monitors any alarm occurrences. Note: This sample macro script is presented to illustrate the flexibility of the macro editor. There are numerous ways to achieve the same the task noted here.
Procedure: To construct the macro script, proceed as follows.
-
Click Create New on the Macro submenu.
-
Click the Name field and enter ALARM02.
-
Confirm that the trigger is enabled (with its box checked).
-
Under Trigger:
-
Click the Type field and select Program State from the drop-down list.
-
Click the Program State field and select Program Started from the drop-down list.
-
Click the Program field and select PROG2TEST on slot 2. Note:: PROG2TEST must be made available on the program list.
-
The last option on step number is set as default for the trigger to apply at any step.
-
Click the (+/-) and select Insert After to add a new trigger type, as shown in the figure.
-
Click the Type field and select Or from the drop-down list.
-
Click the Type field and select Program State from the drop-down list.
-
Click the Program State field and select Program Started from the drop-down list.
-
Click the Program field and select PROG3TEST on slot 3. Note: PROG3TEST must be created and is available on the program list.
-
The last option on step number is set as default for the trigger to apply at any step.
-
Apply the (+/-) button to add two more trigger type steps to contain the logical Or and Alarm State as depicted in the following figure which depicts the complete configuration of the conditional statements in the trigger logic:
-
-
Click APPEND under the Operations block to create the first step of the trigger operation.
-
Confirm that If condition is selected (by default).
-
Click the Type field and select Always from the list. This is to ensure that an e-mail alert will be sent out if the state of a specified program occurs.
-
Confirm that E-Mail: Send a custom email is selected (by default) for Operation Type.
-
Enter the recipient's e-mail address in the Recipients block, one e-mail address per line.
-
Enter subject title in the Subject block.
-
Enter a brief message in the Message Body block. The complete configuration is illustrated as follows:
-
-
Click the operation step number (number 1 in the circle, as shown below) and select Insert After to add a new step to the trigger operation.
- Confirm that If condition is selected (by default).
- Click the Type field and select Alarm State from the list.
- Click the Program State field and select Tripped from the list.
- Confirm that Any is selected by default under the Alarms field; it is to ensure any alarm will trigger this action.
- Confirm that E-Mail: Send a custom email is selected (by default) for Operation Type.
- Enter the recipient's e-mail address in the Recipients block, one e-mail address per line.
- Enter subject title in the Subject block.
- Enter a brief message in the Message Body block to indicate alarm has been tripped. The complete configuration is illustrated as follows:
-
Click Save to save this macro scripted profile.
-
Testing the Macro Script: Click the person icon to test and run the macro script.
-
If the run is successful (that is, no errors are found in the script), a Successful message appears and an e-mail alert is sent to the recipient(s) listed in the Recipients block.
-
If the run failed, an error message appears as shown below. The macro script does not work.
-


This chapter discusses the networking features of the GL controller operation as a networked device. It explains how the GL controller can join a network, how to configure a different type of network protocol for the GL controller and how to access the GL controller via its hostname or its IP address on a Web browser.
As stated in Section 2.1, the GL controller is capable of operating as a standalone system or as a networked system. When the GL controller is connected to a network, its UI can be accessed via a Web browser from any device (e.g., PC, laptop, handheld, smartphone) on the network using either the IP address or the hostname of the GL controller. The entire GL controller system and chamber can be controlled remotely via this Web browser. The following figure depicts the GL controller UI on Google Chrome Web browser, accessed via its IP address.
The GL controller is programmed to join a DHCP (Dynamic Host Configuration Protocol) network using an IP address provided by the DHCP server. On a network that does not support DHCP, the GL controller uses its preconfigured IP address (called fallback IP) to join the network; this fallback IP address is based on a Class C private network configuration. The GL controller can also be configured using a specific static protocol with static IP address to join any static network domain.
| Network Type | Description |
|---|---|
| DHCP | By default, GL controller joins a DHCP network by requesting (and using) an IP address from the DHCP server. Refer to Section 8.3. |
| Default Static | By default, GL controller uses its preconfigured IP address (192.168.0.83) when DHCP server is not available. Refer to Section 8.4. |
| Custom Static | GL controller can be configured to use any static IP address in any network domain. Refer to Section 8.5. |
Remote access to the GL controller system as a networked device offers many potential advantages. Here are few examples.
Summary:
-
GL controller can be controlled and operated remotely
-
Data logs can be downloaded and stored on the operator's PC for analysis
-
Multiple users may access and view chamber operation status from their PC at the same time
-
Only authorized users on the network can access and control the GL controller system
-
User interface and operation are made easier via a Web browser; no need to utilize the on-screen keyboard/keypad for control inputs.
-
Automatic Over-the-Air update via Mender IO cloud service is done without the user's intervention, thus keeping the GL controller system up to date.
-
GL controller system is kept secure and protected through the implementation of the user policy and separate user accounts.
-
Alert notifications via email can be sent out to all or specific operators about the status or conditions of the chamber, such as warning or alarm.
The GL controller supports the following Web browsers: Chromium, Google-Chrome, Mozilla Firefox, Microsoft Edge, Apple Safari and Opera. Microsoft Internet Explorer 11 can also be used to access and operate the GL controller. However, due to its slow performance, the use of Microsoft Internet Explorer 11 is strongly discouraged.
The following procedure illustrates how to connect the GL controller system to a DHCP network, look up its hostname and its IP address, and access its UI via a Web browser from a laptop or PC on the network.
Procedure:
-
Plug a Cat5 or Cat6 Ethernet cable into the RJ-45 Ethernet port at the rear of the chamber (see arrow); this can be done while the GL controller system is still running. Note: Ethernet connection on the GL controller, like any other network devices, is hot-pluggable.
-
Plug the other end of the cable into an Ethernet port (or a router) that connects to the main network.
-
After about 30 seconds, press the hamburger menu in the status bar (1), followed by Configuration (2) and Set Communication (3) in the system menu, as depicted in the following figure.
-
The hostname of this GL controller system is GL-EPL-3-P300, indicated by callout (1). The hostname of your GL controller will be different and unique, which is associated with the registered serial number. The IP address of the GL controller is listed next to IPv4 Address, indicated by callout (2); it is shown as 10.30.100.190. Note: The IP address of the GL controller is assigned to eth0. Thus, the IP address under the eth0 column is the one used by the GL controller to join the main network. The IP address (192.168.1.100) assigned to (and listed under) eth1 is for internal communication between the GL controller and the PLC.
-
Connect a PC or a laptop based on the diagram illustrated in step 2. Turn on the computer and confirm that it is connected to the same network that the GL controller is a part of.
-
Launch a Web browser on the computer.
-
To access the GL controller via its IP address, enter: http://10.30.100.190/ in the URL of the Web browser and press Enter. The home page of the GL controller will appear.
-
To access the GL controller via its hostname, enter: http://GL-EPL-3-P300.local/ in the URL of the Web browser and press Enter. The home page of the GL controller will appear.
-
-
The general URL of the GL controller is:


This section outlines the steps to set up a private static network connection between the GL controller system and a PC or a group of PC's via a network hub where no DHCP is available. The goal is that the GL controller UI can be accessed from any PC on the network.
By default, if the GL controller detects a network signal on its eth0 Ethernet port, it first applies DHCP protocol to request an IP address. If the request fails, the preconfigured IP address 192.168.0.83, called fallback IP, is used to join the network.

| No. | Category | Description |
|---|---|---|
| 1 | DHCP | DHCP is enabled by default (from factory). Fallback IP address is used in DHCP mode. Refer to Section 8.5 for custom static setting. |
| 2 | Network protocol | Displays factory settings for fallback IP network configuration; they must not be changed. Refer to Section 8.5 for custom static network setting. |
| 3 | Fallback setting | Displays notification of the fallback IP address when DHCP request failed. |
The client PC must be configured to use the same Class C network with the same subnet mask and gateway as follows.
| Category | Parameter |
|---|---|
| IP Address | 192.168.0.84 (recommended) |
| Subnet Mask | 255.255.255.0 |
| Gateway | 192.168.0.1 |
| Preferred DNS server | 8.8.8.8 |
| Alternate DNS server | 8.8.4.4 |
The following procedure outlines the steps to configuration a static network protocol on a PC running MS Windows 8/10/11.
Procedure:
-
Repeat step 1 in the procedure of Section 8.3 (above).
-
Set up Ethernet connection as depicted in the diagram.
-
With the PC turned on, hold down the Windows key and press R to launch the Run Command dialog box.
-
In the Run dialog box, enter ncpa.cpl into the Open box field and press Enter.
-
Point and Right-Click the “Local Area Connection” icon, then click Properties from the drop-down menu (follow the arrows in the figure). Note: The Local Area Connection icon is the one connected to the GL controller (or a hub). It is important to access the correct icon in case the PC has multiple Ethernet ports.
-
In the “Local Area Connection Properties” window, confirm that the check mark is placed in front of “Internet Protocol Version 4 (TCP/IPv4)”, as depicted in the figure. If not, check it. Click to highlight “Internet Protocol Version 4 (TCP/IPv4)” and then click Properties in the lower-right corner.
-
In the “Internet Protocol Version (TCP/IPv4) Properties” window, turn on the radio button for “Use the following IP address:” and enter the IP address (192.168.0.84), subnet mask (255.255.255.0) and gateway (192.168.0.1), as shown in the following figure.
-
In the “Use the following DNS server addresses:” section, enter the following DNS server values (also shown in the following figure):
-
Preferred DNS server: 8.8.8.8
-
Alternate DNS server: 8.8.4.4
-
-
Turn on “Validate settings upon exit” with a check mark and click OK, as illustrated in the following figure.
-
Click OK to close “Local Area Connection Properties” window. Close out the Network window.
-
Returning to the GL controller: On the GL controller HMI, press the hamburger menu in the status bar (1), followed by Configuration (2) and Set Communication (3) in the system menu, as depicted below.
-
The fallback IP address used by the GL controller is listed next to IPv4 Address under eth0 (see arrow), shown as 192.168.0.83. Note: The GL controller IP address is assigned to eth0. The IP address (192.168.1.100) assigned to (and listed under) eth1 is for internal communication between the GL controller and the PLC.
-
To access the GL controller, open a Web browser on your PC and navigate to: http://192.168.0.83/


If multiple PCs are required to access and control the chamber, a network hub can be used to connect all PCs with the GL controller, as depicted in the diagram. The GL controller system will use its fallback IP 192.168.0.83. All PCs on the network must use IP address 192.168.0.x, where x is unique for each PC.

Procedure:
- Repeat step 1 in the procedure of Section 8.3 (above) and set up Ethernet connection as depicted in the above diagram.
- Follow steps 3-10 in Section 8.4.1 to set up IP address for each PC on the network.
- To access the GL controller on each PC, open a Web browser on the PC and navigate to: http://192.168.0.83/
For security reasons and to limit access to the network domain, your IT may control what device can join the network. This means no device can simply join the network without IT's approval. Each device must have a unique static IP address assigned by the IT team. The GL controller system can be configured with a unique static IP address to join such a network; it uses a custom static IP address with network settings given by your IT, as depicted in the following table.
| Category | Parameter |
|---|---|
| IP Address | Unique IP address for the GL Controller, assigned by IT. Example: 10.30.200.247 |
| Subnet Mask | Correct subnet to help identify the network and host device on the network. Example: 255.255.0.0 |
| Gateway | Correct default gateway to allow network access. Example: 10.30.0.1 |
| DNS1 | Default primary domain name server to resolve hostnames (optional). Example: 10.30.30.31 or 1.1.1.1 |
| DNS2 | Default secondary domain name server to resolve hostnames (optional). Example: 10.30.30.23 or 8.8.8.8 |
The fallback IP configuration in the Set LAN page will be replaced with that given by your IT. The IP configuration in the table will be used as an example in the following step-by-step procedure.
Procedure:
-
Repeat step 1 in the procedure of Section 8.3 (above).
-
Set up Ethernet connection as depicted in the following diagram.
-
On the GL controller HMI, press the hamburger button (1) in the status bar. Check to confirm the floating keyboard is enabled under the system menu. A diagonal bar over the keyboard indicates it is disabled. Press the keyboard (2) to enable it; press Configuration (3), followed by Set Communication (4), as depicted in the figure.
-
Press Set LAN (Network Setup) page, then uncheck the DHCP box (see arrow 1); enter 10.30.200.247 in IP address field (see arrow 2). Enter the rest of the parameters listed in the table above, as depicted in the figure. Press Save (arrow 3) and confirm the action.
-
Back on the Set Communication page, confirm that your custom IP setting is displayed under the eth0 column, as depicted in the following figure.
-
Confirm that the computer on the network uses the same network protocol. Launch a Web browser on the computer.
-
To access the GL controller via its IP address, enter: http://10.30.200.247/ in the URL of the Web browser and press Enter. The home page of the GL controller will appear.
-
If your static network has a DNS to resolve hostnames, enter: http://hostname.local/ in the URL of the Web browser and press Enter. The home page of the GL controller will appear.
-


GL controller can communicate with each other on the local network. The hostname in the status bar itself is a clickable link; when clicked, a drop-down menu displays a list of clickable links to other GL controller or ESPEC Web Controller systems detected on the local network.

| No. | Name | Description |
|---|---|---|
| 1 | Network Monitor | A clickable link that opens in a new page to manage all GL controller systems detected on the local network. Operation of the Network Monitor is bound to user privileges; a user must therefore have specific privileges to use it. |
| 2 | List of GL Controllers | Displays a list of all GL controller systems (hostname and URL via IP address) detected on the local network. Any GL controller system on the list can be accessed directly by clicking on its hostname/IP. The back button of the Web browser can be used to return to the GL controller that initiated the call. |
Note: The Network Monitor feature is not operational on the HMI. The GL controller system must be part of a network and its UI must be accessed remotely via a control PC on the network.
The Network Monitor page can operate as a central server monitor where all the GL controller and ESPEC Web Controller systems on the local network can be displayed on a single monitor, as depicted in the following figure. An operator can remotely monitor and manage all the GL controller and ESPEC Web Controller systems from a centralized location. In this discussion, we will refer to both the GL controller and other ESPEC Web Controller systems as EWC devices or EWC.

To access and manage the Network Monitor page,
Procedure:
- Log in as admin or as a user with permission to control the Network Monitor page
- Click the E logo or the hostname of EWC
- Click the Network Monitor link on the drop-down menu
The following figure illustrates the layout of the Network Monitor page with seven (7) important components. Each is listed and described as follows:

-
Back Button: This button closes the Network Monitor page and returns to the Overview of EWC.
-
Refresh Button: The refresh button updates the display of the Network Monitor page to apply any new configuration.
-
Monitor Tab: By default, only one tab with default name ALL CHAMBERS is active and ready to populate the selected EWC devices (as depicted in the above figure). Multiple tabs with unique and descriptive names can be created to display different groups of EWC devices.
-
EWC on the Network: By default, each EWC is displayed with its hostname for identification, but a unique name may be created in place of the hostname. As shown in the above figure, each EWC is displayed based on its operating status, such as Standby, Constant or Program, using it's default color. Each EWC can be accessed directly and displayed inside the Monitor tab as shown in the following figure for F4T-EP-RD. To close F4T-EP-RD, click the X button on the top right. To open it entirely in a new Web browser tab, click the expand button next to its hostname.
The color coding scheme allows the operator to quickly identify a chamber with issues, such as the one depicted in the following figure.
-
Monitor Area: The monitor area is based on the size of the monitor screen which defines the real estate of the display to accommodate EWC devices.
-
Edit Layout: The Edit Layout (pen icon) is a clickable link/button that provides the edit menu with options to create additional tabs to populate EWC devices, as shown below.
From left to right, the four buttons are: Revert (back button), Save, Add Chamber/Device, Edit/Create Tab. Detailed operations of these buttons will be discussed in the following section.
-
User: Identity of the current user is listed here for reference.


When Network Monitor page is open for the first time, it has an empty tab with default tab name ALL CHAMBERS.

The Edit Layout (pen icon) button can be used to edit or create new tabs to populate and display EWC devices. The four buttons in the menu (labeled in the figure) can be used to manage and edit the layout.

These four buttons are described as follows:
-
Edit Tab: The default tab name All Chambers can be edited via this button. Additional tabs can be added via the + button. Any tab on the list can be removed with the trash bin button. The up/down arrows on the right can be used to select a tab to be edited.
-
Add Chamber/Device: A new EWC device can be selected to add into the display tab via (1) the Create New button or (2) the EWC list as shown in the following figure. The first option permits manual configuration, while the second option applies the default settings for the selected EWC device which includes hostname, IP address, type of EWC and its version, as depicted in the following figure (for WebDev25).
-
Save: To apply all settings made in the network tab, the Save button must be applied.
-
Revert: This is the back button to exit the Edit Layout.


In the following section, we provide an example how to set up the Network Monitor page.
In this section, we provide a step-by-step example how to set up and configure a network monitor page to display three EWC devices in the default Monitor tab. This example can be completed only if you have at least two EWC devices, one as a host and the other as a client on your network. Note: All EWC device hostnames and IP addresses used in this example are for illustration purposes only. You must use the hostnames and IP address of your EWC devices found on your network.
-
Select one EWC on the network to host a Network Monitor page.
-
Log in as admin or as a user with Network Monitor privilege.
-
Click the E logo or the hostname of EWC.
-
Click the Network Monitor link on the drop-down menu.
-
Click Edit Layout (pen icon) in the Network Monitor page.
-
Click the Add Chamber/Device button. Two options are available for adding the EWC device into the Monitor tab: (1) Create New and (2) Select from the drop-down list. The first option is for a manual configuration; the second option applies the default configuration. Option 2 will be used for this example. From the drop-down menu, click to select the desired EWC to populate the Monitor tab.
Default configuration of the selected EWC has been applied as shown in the pop-up window, which includes hostname, IP address, type of EWC and version.
Click ACCEPT to populate this device in the Monitor tab.
-
Apply step 6 again to add two additional EWC devices from the list. The selected EWC devices will be populated below the first one in a single-column profile. The check mark in each box indicates the device selection.
-
The pen icon appearing in each EWC object indicates that the Monitor tab is still in edit mode. Click and drag to relocate or arrange each EWC in the Monitor tab, as shown below.
-
Click Save to apply the settings. The Network Monitor page configuration is complete with three EWC devices in the Monitor tab (called ALL CHAMBERS).
-
Each EWC in the Monitor tab is a clickable link that, when clicked, opens the selected EWC inside the Network Monitor page, as depicted below.
The expand button (1) next to the hostname can be used to open WebDemoSCP220 in a new Web browser tab so that the Network Monitor page is free to manage other EWC devices. The X button (2) can be used to exit and close WebDemoSCP220 to get back to the Network Monitor page.
-
The back button (indicated by the arrow) can be used to return to the host EWC for its chamber control and operation.
The E logo (in the Overview page) and the back button (in the Network Monitor page) can be used to toggle back and forth between the EWC's Overview page and its Network Monitor page to monitor other EWC devices on the network. The toggle operation can be performed during any operating mode of the host EWC, not just in Standby as shown in the figure.


In this section, four more examples are given to illustrate the practical application of the Network Monitor page. The EWC device in Example 1 will be used as the host EWC in following examples.
This short example illustrates how to create and add a new Monitor tab (called TESTS). It is then populated with two EWC devices.
-
Log into EWC as admin or as a user with Network Monitor privilege.
-
Click the E logo (or the hostname).
-
Click Network Monitor link on the drop-down menu.
-
Click Edit Layout (pen icon).
-
Click Edit Tabs; then, click + in the Tab Editor window and edit the Display Name field with TESTS, and click CLOSE.
-
Click the TESTS tab, then click Add Chamber/Device to select and populate two EWC devices.
Rearrange the layout and click Save to complete the configuration.
-
TESTS tab and ALL CHAMBERS tab can be toggled to display two groups of EWC devices, as illustrated in the following figure. An active tab is highlighted and underlined in blue (as indicated by the arrows).
-
Additional tabs may be created and added into the tab bar by repeating steps 5-7, as depicted in the following figure.


This short example illustrates how to remove an EWC device from a Monitor tab. As a concrete example, WebDev25 will be removed from the ALL CHAMBERS tab.
-
Starting from the Network Monitor page, click the ALL CHAMBERS tab.
-
Click the Edit Layout (pen icon).
-
Click the pen icon of the WebDev25 object, then click DELETE in the Chamber/Device Editor window as shown in the following figure.
-
Click Save to apply new settings to this tab. Only two EWC devices remain in this tab.

This short example illustrates how to manually add a new EWC device (using WebDev25 as an example) to the TESTS tab using the Create New button.
-
Starting from the Network Monitor page, click the ALL CHAMBERS tab. Note: It is not necessary to select ALL CHAMBERS, but selecting it allows a complete manual configuration (as will be apparent at step 4).
-
Click the Edit Layout (pen icon).
-
Click the Add Chamber/Device button and click Create New.
-
Apply the following steps to the Chamber/Device Editor:
-
Click the Show on Tab spin button to select TESTS from the list.
-
Enter MyWebDev25 in the Display Name field. Note: To display the EWC device by its hostname, WebDev25 may be entered here. This field cannot be left blank or an INVALID NAME will be displayed.
-
Enter hostname as "webdev25.local".
-
Enter its IP address (10.30.200.239).
-
Click the Device Version field to select 2.?.? from the list. The selected EWC is known to have version 2.x.x. The correct version must be selected or an error will occur.
-
Click ACCEPT.
-
-
Click Save.
-
Click the TESTS tab to view its new display and notice that WebDev25 is now identified as MyWebDev25.


Warning! At step 4 above, it is crucial to enter the correct IP address, since the system tries to locate the device based on that IP address on its network. A wrong IP address would produce an EWC error as depicted in the following figure. Here, steps 1-5 were repeated to create a new EWC device with a non-existing IP address.

To remove a misconfigured EWC device, such as MYTEST2, refer to the previous example on Removing an EWC Device.
This short example illustrates how to remove TESTS from the Monitor tab.
-
Starting from the Network Monitor page, click the Edit Layout button (from within any active tab).
-
Click Edit Tabs.
-
In the Tab Editor window, click to select TESTS in the tab list, then click the trash bin (to remove it) and click CLOSE.
-
Click Save to apply the changes. TESTS tab is now removed from the Monitor tab and no longer appears in the tab bar.

About/License Terms is the submenu accessible only via the system menu (i.e., hamburger menu) in the status bar. It contains important information about the GL controller software version, License and Terms of Agreements for end-users and a link to ESPEC online support page. The following procedure outlines the steps to access About/License Terms.
Procedure:
- Click the hamburger menu (see arrow)
- Click the About/License Terms submenu (see arrow)
- The first subpage of About/License Terms appears and the hamburger menu collapses (refer to Figure in Section 10.1).

This submenu provides three subpages, as depicted in the following figure, with the hamburger menu shown as a pre-access action. Details of these subpages are discussed in the following sections.

The first page (by default) displays general information of the GL controller software, namely, its current firmware version, installed version, package name and version number, date and time firmware was created/installed, etc.

| No. | Description |
|---|---|
| 1 | Displays the current firmware version of the GL controller software |
| 2 | Link to ESPEC online support page to access the GL controller user's manual both online and PDF, and support information on other chamber related requests |
| 3 | Detailed information of the installed version of the GL controller |
The firmware version number (see arrow No. 1) can be used to check against the current release of the GL controller software to ensure your system is current and up to date. This firmware can also be used to check against the original version shipped with the chamber to determine whether a firmware update is needed.
If your GL controller is part of a network system with access to the Internet and the GL controller is accessed via a Web browser from a PC, the Web Controller Support Page link (see arrow No. 2), when clicked, points to the support page on ESPEC website for software download or other support on chamber/software related questions, as depicted in the following figure. Click the back-arrow button (in the upper-left page) to return to the GL controller system.

Note: On the HMI, Web Controller Support Page link is blocked (inoperative), even when the GL controller system has access to the Internet.
By default, subpage 2 opens and displays the overview of the software license, its legal aspect, and its practical application and usage that all end-users must acknowledge and abide to in order to use the product.

The main focus of this page is on end-user agreement and terms of service. It lists different modules and functions used in the GL controller software which are governed by various license terms and copyrights. End-users are encouraged to view this page in its entirety, including the respective licenses applied to each of them. This page implies that, by using this software (i.e., GL controller software), end-users have read, understood and accepted all the terms outlined herein.
The GL controller operation manual is available in two different formats: online and PDF. Both formats are available via the support link in Section 10.1 for download (PDF format) or online view via the wiki page. The embedded manual (i.e., PDF format) is made available from within the GL controller system without having to access the online manual via the ESPEC support page.
Procedure:
- Click the hamburger menu (see arrow)
- Click the About/License Terms submenu (see arrow)
- Click subpage 3 (see red arrow in the following figure)

By default, the first page (or title page) of the document is displayed (see callout No. 1). To access a specific chapter or section, click the table of contents (callout No. 2).
Note: The embedded manual is not viewable on the HMI; the GL controller system does not have a PDF viewer to display the manual.
Sometimes, it is helpful to construct a table to outline the steps of the program before entering them into the GL controller program editor (see Section 5.3). The following table illustrates an example how to prepare these steps. This program conducts test on temperature fluctuation.
| Step No. | Temp SP | Temp Mode | Humi SP | Humid Mode | Time (hr:min) | Refrig | TS 1 | TS 2 | Counter Step | Counter Count |
|---|---|---|---|---|---|---|---|---|---|---|
| 1 | -30 | Soak Ctrl | 5 | Off | 1:00:00 | Auto | 0 | |||
| 2 | 20 | Soak Ctrl | 5 | Off | 1:00:00 | Auto | 0 | |||
| 3 | 55 | Soak Ctrl | 5 | Off | 1:00:00 | Auto | 0 | |||
| 4 | 65 | Soak Ctrl | 5 | Off | 1:00:00 | Auto | 0 | |||
| 5 | 180 | Soak Ctrl | 5 | Off | 1:00:00 | Auto | 0 | |||
| 6 | 23 | On | 5 | Off | 1:00:00 | Auto | 0 |
Here is another program that performs Low Humidity test. This program requires a chamber with humidity option. As illustrated in the following Table, deviation soak between plus and minus 10 have been utilized. Both temperature and humidity have been controlled via soak. Time signal TS 9 and TS 10 have been utilized. Note: TS 1 and 2 are generally the default time signals.
| Step No. | Temp Mode | Temp SP | Dev(+) | Dev(-) | Humi Mode | Humi SP | Duration | Refrig | TS9 | Ts10 | Counter Step | Counter Loop |
|---|---|---|---|---|---|---|---|---|---|---|---|---|
| 1 | Soak | 60 | 10 | -10 | Soak | 10 | 2:00 | Auto | On | On | ||
| 2 | Soak | 40 | 10 | -10 | Soak | 15 | 2:00 | Auto | On | On | ||
| 3 | Soak | 20 | 10 | -10 | Soak | 15 | 2:00 | Auto | On | On | ||
| 4 | Soak | 10 | 10 | -10 | Soak | 15 | 2:00 | Auto | On | On | ||
| 5 | Soak | 40 | 10 | -10 | Soak | 20 | 2:00 | Auto | On | On | ||
| 6 | Soak | 20 | 10 | -10 | Soak | 30 | 2:00 | Auto | On | On | ||
| 7 | Soak | 40 | 10 | -10 | Soak | 40 | 2:00 | Auto | On | On | ||
| 8 | Soak | 10 | 10 | -10 | Soak | 20 | 2:00 | Auto | On | |||
| 9 | Soak | 20 | 10 | -10 | Soak | 30 | 2:00 | Auto | On | |||
| 10 | Soak | 10 | 10 | -10 | Soak | 40 | 2:00 | Auto | On | |||
| 11 | Soak | 40 | 10 | -10 | Soak | 20 | 2:00 | Auto | On | |||
| 12 | Soak | 20 | 10 | -10 | Soak | 45 | 2:00 | Auto | On | |||
| 13 | Soak | 10 | 10 | -10 | Soak | 80 | 2:00 | Auto | On |
Copy and use the following programming table to prepare a program.
| Step | Temp | Humi | Time | Soak | Refrig | 1 | 2 | 3 | 4 | 5 | 6 | 7 | 8 | 9 | 10 | 11 | 12 |
|---|---|---|---|---|---|---|---|---|---|---|---|---|---|---|---|---|---|
Programming optional features.
| Processing at End of Operation | ☐ Stop; ☐ Power OFF; ☐ Hold Last Step. ☐ Constant Operation (No. 1)(No. 2)(No. 3) ☐ Operate Next Program No. ( ), Step ( ) Example: ☑ Stop |
|---|---|
| Counter A | Repeat Cycle: Repeating Start Step ( ) Step ; Repeating End Step ( ) Step |
| Counter B | Repeat Cycle: Repeating Start Step ( ) Step ; Repeating End Step ( ) Step |
| Start Setting (Ramp Operation) | ☐ Process Value ☐ Set Point ( °C) ( %RH) Example: ☑ Ste Point (35°C) (25%RH) |
Note: GL controller supports multiple counters which therefore will not be limited to just Counter A and Counter B. Each counter and its loop can be invoked by entering the loop number under the Counter column (refer to the first table in this Appendix) and then set the start step. Multiple counters can be created by manipulating the start/stop step. The following table illustrates how counters are manipulated in a program.
| Step No. | Temp SP | Temp Mode | Humi SP | Humid Mode | Time (hr:min) | Refrig | TS 1 | TS 2 | Counter Step | Counter Count |
|---|---|---|---|---|---|---|---|---|---|---|
| 1 | -30 | Soak Ctrl | 5 | Off | 1:00:00 | Auto | 1 | 0 | ||
| 2 | 20 | Soak Ctrl | 5 | Off | 1:00:00 | Auto | 1 | 0 | ||
| 3 | 55 | Soak Ctrl | 5 | Off | 1:00:00 | Auto | 2 | 3 | ||
| 4 | 65 | Soak Ctrl | 5 | Off | 1:00:00 | Auto | 3 | 2 | ||
| 5 | 180 | Soak Ctrl | 5 | Off | 1:00:00 | Auto | 1 | 4 | ||
| 6 | 23 | On | 5 | Off | 1:00:00 | Auto | 4 | 4 |
The following figure depicts the loops created by the program in the above table.

| Item | Specification | Application |
|---|---|---|
| HMI / Display | 10.1-inch High Resolution Capacitive Touch Display Display Panel: IPS Resolution: 1280x800 pixels View Angle: 178 ° Hi-Fi Speakers: 8 Ohms 1 Watt High brightness: 350 cd/m2 Refresh Rate: 60 Hz Video Interface: HDMI Touch Panel Interface: USB-C Power Supply: Power Jack (DC 7.0V - 14.0V) | User Interface for GL Controller and Chamber Operation |
The GL controller software is an embedded computer powered by Debian GNU/Linux distribution running as the operating system (OS). The embedded computer hardware is an x86 64-bit architecture system board, called AAEON UP2Board, designed by AEEON. The following figure depicts the top view of the system board.

The following hardware specifications are taken from the manufacturer/vendor website: The specs listed in the above table may be found here: AEEON.
| Component | Details |
|---|---|
| CPU | Intel® Celeron® Processor N3350 |
| Graphics | Intel® HD Graphics |
| Memory | Up to 8GB onboard LPDDR4 |
| Storage | Up to 128GB onboard eMMC |
| I/O | HDMI 1.4b x 1; DP 1.2 x 1 |
| Camera | MIPI-CSI via 21 Pin FPC connector x 1; MIPI-CSI via 31 Pin FPC connector x 1 |
| USB | USB 2.0 x 2 (via 10 Pin Header x 1); USB 3.2 Gen 1 x 3 (Type-A); USB 3.2 Gen 1 OTG x 1 (Micro B) |
| Expansion | 40-pin GPIO x 1; Full-sized mPCIe x 1 (PCIe & SATA [x1], USB2.0 [x1]); M.2 2230 E-Key x 1 (PCIe [x1], USB2.0 [x1]); SATA III x 1; 60 Pin EXHAT x 1 |
| Display Interface | HDMI 1.4b x 1; DP 1.2 x 1; eDP 1.3 x 1 |
| Ethernet | GbE x 2 (Realtek 8111H CG) |
| Security | fTPM |
| RTC | Yes |
| OS support | Windows® 10 IoT Enterprise LTSC 2021; Windows IoT Core Linux Ubuntu 20.04 LTS; Linux Yocto 3.1 |
| Power | DC 5V / 4-6A |
| Dimension | 856 mm x 900 mm |
For reference, the following figure depicts the Up2Board installed inside the electrical box of the test chamber.
Answers to frequently asked questions (FAQ) are compiled, summarized and displayed in the following table. Note: As more FAQ and answers become available, they will be appended in the table for future release.
| No. | Question | Answer | Reference |
|---|---|---|---|
| 1 | I want to change the buzzer operation in the event of the occurrence of an "alarm or warning." | ON/OFF switch can be controlled via [Setup] → [Configuration] → [Set Sound]. If the beep is turned off, alarm and warning are indicated only with red notifications on the HMI. | 2.8 Setting the Alarm and Warning Buzzer |
| 2 | What should I do when a system abnormality has occurred? | Notify the sales representative or customer support for assistance. | |
| 3 | I want to turn off the HMI immediately. | To turn off the HMI immediately, press [Setup] → [Configuration] → [Display Setup], then press Turn Off Display. To turn it back on, tab your finger on the screen. | 7.9.1 Display Setup on HMI |
| 4 | I want to set the HMI in sleep mode. | Several options are available for setting the HMI in sleep mode. Press [Setup] → [Configuration] → [Display Setup], then select HMI Screensaver timeout. To turn it back on, tab your finger on the screen. | 7.9.1 Display Setup on HMI |
| 5 | "OFF" is displayed for a setup value. | When the equipment is stopped or the humidity control is set to OFF, "OFF" is displayed. | 2.3.3 Monitor |
| 6 | "---" is displayed as the temperature (humidity) process value. | If the temperature (humidity) process value is abnormal or the humidity control is set to OFF, "---" is displayed. | 2.3.3 Monitor |
| 7 | I want to change the refrigeration setup from Auto to Manual (arbitrary state). | Access [Set Mode], select a Constant setup, then apply refrigeration manual setting as needed. When you want to change the mode from Auto to Manual during operation, make the manual setting first. | 4.3 Refrigeration Setting |
| 8 | When is the setting of time enabled? | At the moment when the time signal is set, the contact output in question changes Contact rating: 250VAC, 5A | |
| 9 | Is the trend graph data erased when the circuit breaker is turned off or when power failure occurs? | Data are stored in the non-volatile memory of the GL controller system; they cannot not be erased by power failure or shutdown. | 4.9.7 Monitor: Trend; 4.9.8 Trend Graph Manipulation Buttons |
| 10 | What is the ramp operation? | The ramp operation is to control the temperatures from the set point of the previous step to that of the present step at a certain ramp. | 5.3.1 Step-Wise Programming |
| 11 | What is the soak time control? | After the operation of the step is started, the equipment waits until the process value attains the attainment range of the set point, and then starts the counting of time. Thus, the soak time in the temperature set point is the same as the setup time. | 5.3.1 Step-Wise Programming |
| 12 | Can the soak time and ramp control be set simultaneously? | The ramp control and soak time cannot be set simultaneously. | 5.3.1 Step-Wise Programming |
| 13 | Can the program in operation be edited or saved? | During program execution, that program can be loaded into the program editor for editing, but the edited version cannot be saved back in the same slot that was loaded from for execution; it can however be saved in a different slot (and under a different name). | 5.6.4 Manipulating a Program during its Execution |
| 14 | Can the program in operation be deleted? | During program execution, that program cannot be deleted. | 5.6.4 Manipulating a Program during its Execution |
| 15 | Can the program contain loops (counters) to reduce the number of steps? | Program may contain multiple loops (i.e., counters) to repeat steps or groups of steps. | 5.3.1 Step-Wise programming; 5.3.6 Example 6: Setting Multiple Counters in a Program |
| 16 | Can I connect my GL chamber to my main network and access it remotely? | Your GL chamber can join the main network using DHCP or static. The UI can be accessed via a Web browser. | 8 Network Setup & Remote Access |
| 17 | Can I set my GL chamber to use a static IP address on the network? | Your GL chamber can use a static IP address on a static network | 8.5 Custom Static Network |
| 18 | Can I access other GL chambers on the network? | Working with multiple GL chambers on the network, you can choose one GL controller (on the network) to monitor other GL chambers on the network. | 2.1 GL Controller Operation Options; 9 Network Monitor |
| 19 | When I issue set command to set a new temp value via TCP/IP communication, the system responds with PROTECT ON. | If remote TCP/IP communication was set to Monitor only, set command cannot be issued. Enable remote TCP/IP communication with Monitor and Control. | 2.10.1 Remote Communication Options; 6.5 Set Protection |
| 20 | How do I enter the password to log in on the HMI? | To enter the password to log in on the HMI, the floating input keyboard must be enabled via the hamburger menu. | 2.6.3 How to Log in via HMI |