Repository navigation
Check methylation phenotypes
Developer: Developer's team
Scripts status: Ready
Prerequisite scripts: Script 0, 01a and 01b
Data upload method: automated upload to sftp bristol
Issue report to: Sarah Watkins s.h.watkins@bristol.ac.uk and Haotian Tang haotian.tang@bristol.ac.uk
This Module processes DNA methylation data and phenotype data for the following aims, including:
- Detect and remove outliers in DNA methylation data for GWAS and/or EWAS.
- Clean, format, and QC phenotype variables.
- Predict epigenetic age and smoking status from methylation
- Predict cell counts by using cleaned DNA methylation data, compare predicted vs measured cell counts (if available), and compare predicted vs predicted cell counts (if multiple cell type references are used).
- Computes PCs for methylation data, and associates the methylation PCs with genetic PCs, batch, and key study and participant characteristics.
- Generate covariates for module 1d and 1e (positive/negative control mQTL analysis and GWAS of genetic PCs).
To run the entire script, use the following command:
./01c-check_phenotypes_and_methylation.sh -c /path/to/config/file
Importantly, Module 01c is designed to run in chunks, making it easier to fix problems as they arise. We recommend that you run this script interactively. If you have a large methylation dataset, then it is possible to run ./01c-check_phenotypes_and_methylation.sh ewas in a job. Note that runtime may be long, depending on the dataset size and the number of surrogate variables (SVs) generated. If you are submitting a job on an HPC system, please refer to the 01c example template.
./01c-check_phenotypes_and_methylation.sh -c /path/to/config/file methy_outlier
./01c-check_phenotypes_and_methylation.sh -c /path/to/config/file check_phenotype
./01c-check_phenotypes_and_methylation.sh -c /path/to/config/file predict_age_smoking
./01c-check_phenotypes_and_methylation.sh -c /path/to/config/file cell_counts
./01c-check_phenotypes_and_methylation.sh -c /path/to/config/file ewas
./01c-check_phenotypes_and_methylation.sh -c /path/to/config/file meth_pcs
./01c-check_phenotypes_and_methylation.sh -c /path/to/config/file combine_covariates
Important
Please check Please check plots and output for each of these analyses.
methy_outlier
- Detects and removes methylation outliers using the Tukey method in ewaff on the normalized beta matrix.
- Removes CpGs that become >10% missing after outlier handling and saves cleaned methylation objects separately for GWAS and EWAS.
- Produces per‑CpG summary (mean/median/sd) and a cohort descriptives file (sample counts, age/sex summaries).
check_phenotype
This script is designed to format the phenotypes based on whether you have designated them as _factor or _numeric, so it is very important that you have added either _factor or _numeric to the end of every variable column name in your phenotype file (See examples in Phenotype data).
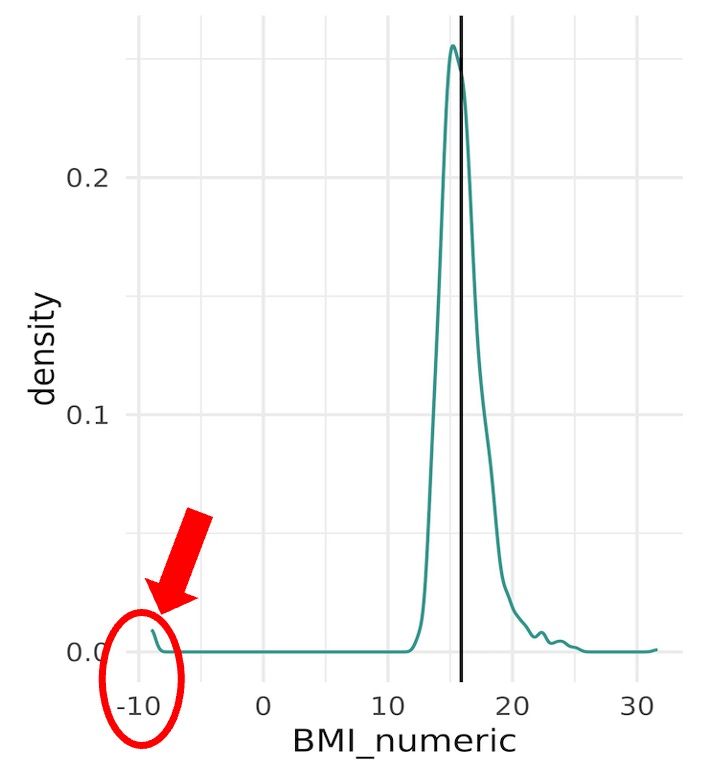
- Produces distribution plots and summary tables for every variable to reveal unexpected values or coding problems (e.g., missingness codes like -9; biologically implausible values (such as age of 150)). **Please check all plots and tables! ** In the below example, the distribution plot for BMI shows a small peak at -9. -9 is not a possible value for BMI, and indeed when we went back to check then -9 is the missingness code, so we go back to our phenotype data and set values of -9 to NA.
- Prints a message if any variable contains >10% missing values. If this prints and is unexpected, then please check your data.
- Winsorizes numeric variables that contain extreme outliers. Then re-generates plots and summary statistics for those variables, so you can review the effect of winsorization. Please check these plots and tables to ensure outliers have been removed.
predict_age_smoking
- Predicts epigenetic age (Hannum clock) and smoking (both mcigarette and Elliott predictors) by using meffonym.
- Smoking must be coded as a factor (0/1); script will attempt auto-conversion if numeric. Please check the output messages to confirm the pipeline was able to convert this to a factor.
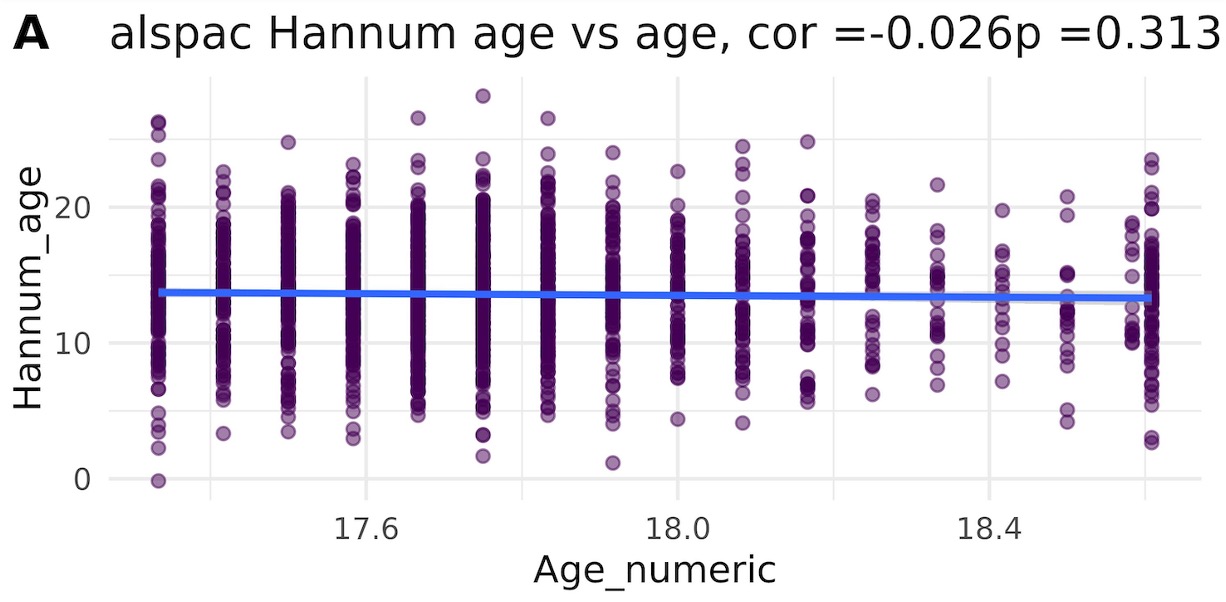
- Generate three prediction plots; check correlation with age (may be weak if age range is limited). We do not necessarily expect the correlation with age to be good because we do not know how well this predictor will work in populations across the DEEP consortium. The below plot shows how we don't find correlation in age-limited datasets:
cell_counts
- Predicts cell fractions using appropriate cell reference panels in EpiDISH or Meffil. References include Unilife (blood samples at any age), Salas (adult blood), Zheng (adult saliva or buccal), and Middleton (child saliva).
- Produces per-sample predicted fractions (with prefix per reference), summary statistics, and diagnostic distribution plots.
- Computes Spearman correlation matrices and generates correlation plots and scatter plots comparing predicted and predicted cell counts when multiple references are used and/or comparing predicted and measured cell counts when measured cell counts are available.
ewas
This script runs five EWAS analyses. These are EWAS where we know what to expect - their purpose is to check that the EWAS method and covariates are functioning as we expect in each dataset, and to identify any issues before running the main set of EWAS. We will be able to tell this from the EWAS report HTML files - please check these files for QQ and miami plots.
Five EWAS analyses are:
- Smoking EWAS (adults only): should detect AHRR sites
- Age EWAS: should detect many age-associated sites (will not run if there is no variation in age). If there is limited variation in age we should still see genome-wide inflation:

- Maternal smoking EWAS (children only): should detect a few distinct peaks of association with MYO1G sites likely being the strongest:

- Sex EWAS: should detect many sex-associated sites (will not run for single-sex studies)
- Negative control (scrambled sex): should show no true associations; QQ plot inflation must be flagged. Will run for all studies.
meth_pcs
We aim to identify major drivers of methylation variation so we can select appropriate PC/batch covariates for downstream EWAS and mQTL analyses and detect dataset-specific issues. We generate principal components (PCs) of the methylation data and assess their associations with genetic PCs, batch variables, and core study/participant covariates.
Generate four plots:
- Scree plot (illustrating how much of the variance in methylation is captured by each of the top 50 PCs):

- PC1 vs PC2 scatter plot, colored by study variables.
- PC3 vs PC4 scatter plot, colored by study variables.
- Forest plots visualizing the associations between each methylation PC (PC1–PC10) and relevant covariates (estimates with 95% confidence intervals), including demographic variables (e.g., age, sex), batch factors, estimated cell counts, genetic PCs, and study-specific variables. Please check for the factors that are driving DNAm, for example, in the below plot cell counts seem to be driving PC1:

combine_covariates
- Combine the original covariate file with genetic PCs, all predicted cell counts, and predicted smoking for Modules 1d and 1e.