-
Notifications
You must be signed in to change notification settings - Fork 1
MapboxGL js part 3
What makes MapboxGL.js so cool is that you can add a lot of interaction and styling flexibility to the map. Here we will introduce some extra concepts and tricks.
From here on the steps do not contain any specific action but are just an explanation about the possibilities in the style.json. You can use these to create your own map.
🔗 https://www.mapbox.com/help/glossary/
➡️ When you are happy with your map go put it online with hosting on github!
🚫 Solution
Let's add some points from a GeoJSON object.
name and a value.
You will have something like this:
{
  "type": "FeatureCollection",
  "features": [
    {
      "type": "Feature",
      "properties": {
        "name": "Almere"
      },
      "geometry": {
        "type": "Point",
        "coordinates": [
          5.213184356689453,
          52.373083994540266
        ]
      }
    },
    {
      "type": "Feature",
      "properties": {
        "name": "mijn Huis"
      },
      "geometry": {
        "type": "Point",
        "coordinates": [
          5.263652801513672,
          52.376123154904604
        ]
      }
    }
  ]
}main.js make a variable with the geoJSON.
// Make a GEOJSON
var mygeoJSON = {
  "type": "FeatureCollection",
  "features": [
    {
      "type": "Feature",
      "properties": {
        "name": "Almere"
      },
      "geometry": {
        "type": "Point",
        "coordinates": [
          5.213184356689453,
          52.373083994540266
        ]
      }
    },
    {
      "type": "Feature",
      "properties": {
        "name": "mijn Huis"
      },
      "geometry": {
        "type": "Point",
        "coordinates": [
          5.263652801513672,
          52.376123154904604
        ]
      }
    }
  ]
};// On Load add GeoJSON SOURCE and LAYER
map.on('load', function (e) {
// ADD GEOJSON SOURCE
map.addSource('punten', {
'type': 'geojson',
'data': mygeoJSON
});
// ADD an extra layer
map.addLayer({
'id': 'geojson-points',
'type': 'circle',
'source': 'punten',
'layout': {},
'paint': {
'circle-color': '#000fff',
'circle-radius': 10
}
});
});map.on('load, function(){}) in your main.js file to add the GeoJSON object.
ℹ️ with map.addSource we add an extra source to the map.
ℹ️ map.addLayer adds an extra layer to the map, on top off the map.
🔗 Read about GeoJSON format here
Do you want this cool 3D effect? This is called `fill-extrusion.
A fill-extrusion is only possible on polygons!
The type of layer is fill-extrusion:
{
    "id": "building_extrusion",
    "type": "fill-extrusion",
    "source": "cartiqo",
    "source-layer": "builtup",
    "maxzoom": 22,
    "minzoom": 11,
    "filter":
        [
            "==",
            "type",
            "building"
        ],
    "paint": {
        "fill-extrusion-height": 20,
        "fill-extrusion-color": "#f37788",
        "fill-extrusion-opacity": 0.9
    }
},
The best part about developing your own map is we can add our own JavaScript interaction. This gives you a lot of freedom with the interactivity and the possibilities to extent your application with other libraries, like D3.js. Think about graphs, pop-ups, side panels, scroll stories.
Let's start with adding a simple mouse move action!
//Adding hover effect
map.on("mousemove", "admin", function (e) {
    // panel.innerHTML = e.features[0].properties.name;
    map.setFilter("admin-hover", ["==", "originalid", e.features[0].properties.originalid]);
});

// Reset the state-fills-hover layer's filter when the mouse leaves the layer.
map.on("mouseleave", "admin", function () {
    map.setFilter("admin-hover", ["==", "originalid", ""]);
});main.js JavaScript file.
We need an extra layer in the style. We make the layer with an empty filter. So it does not show up on the map on initialization. With the mousemove event we can change the filter so the layer is rendered.
{
    "id": "admin-hover",
    "type": "line",
    "source": "cartiqo",
    "source-layer": "boundaries",
    "maxzoom": 22,
    "minzoom": 0,
    "filter": ["==", "originalid", ""],
    "paint": {
        "line-color": "#eeee00",
        "line-width": 15
    }
}style object.
When you refresh your browser the Admin layer will change color on your mouse movement!
We can also see attribute information about a feature on a mouse click.
layer-name to the layer you want to query.
// Get polygon information
map.on('click', 'geojson-points', function (e) {
console.log(e.features[0]);
new mapboxgl.Popup()
    .setLngLat(e.lngLat)
    .setHTML(e.features[0].properties)
    .addTo(map);

});ℹ️ The console.log statement logs the first feature of the clicked object e. e.
On the Mapbox Example page there are more JavaScript interaction examples to find! Check out these:
- https://www.mapbox.com/mapbox-gl-js/example/hover-styles/
- https://www.mapbox.com/mapbox-gl-js/example/center-on-symbol/
- https://www.mapbox.com/mapbox-gl-js/example/using-box-queryrenderedfeatures/
A sprite is a single image containing all icons included in a style. Sprites are often used in web development and even video games to improve performance. By combining lots of small images into a single image (sprite), you can reduce the number of requests needed to fetch all the images, improving performance and making your map faster.
🔗 https://www.mapbox.com/help/define-sprite/ 🔗 https://www.mapbox.com/mapbox-gl-js/style-spec/#sprite
Your style requires the image sprites used for patterns and icons.
"sprite": "https://ta.webmapper.nl/wm/sprites/wm_sprite",
The link contains 2 files:
- a png file with the images
- a json file with the x and y location and reference name to the images.
The 2 files have the same file name.
Have a look at:
https://ta.webmapper.nl/wm/sprites/wm_sprite.json https://ta.webmapper.nl/wm/sprites/wm_sprite.png
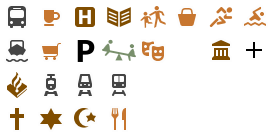
Example of an icon in the json file:
"airport-15": {
  "width": 42,
  "height": 42,
  "x": 76,
  "y": 300,
  "pixelRatio": 2,
  "visible": true
}
This means that you can reference an icon by name, such as "airport-15", and our map renderer will reference the JSON file to get data about the icon and then only show the sprite at that specific icon.
To use this sprite source in your style.json add the following line about the sources:
"sprite": "https://ta.webmapper.nl/wm/sprites/wm_sprite",
To make a icon in your map we need a layer with type symbol:
{
   "id": "poi-cafe-restaurant",
   "type": "symbol",
   "source": "cartiqo",
   "source-layer": "pois",
   "filter": ["==", "type", "food_drink"],
   "layout": {
       "icon-image": "cafe_11",
       "text-padding": 2,
       "text-font": [
           "Lato"
       ],
       "text-anchor": "bottom",
       "text-field": "{name}",
       "text-offset": [
           0,
           2
       ],
       "text-size": 10,
       "text-max-width": 9
   },
   "paint": {
       "text-halo-blur": 0.5,
       "text-color": "#79906c",
       "text-halo-width": 1,
       "text-halo-color": "#ffffff"
   }
},
ℹ️ In the layout we specify the "icon-image" to use. This is the reference name that is defined in the sprite.json file.
Do you want a pop-up when someone opens you application and does not have WebGL support? Add the following code to your JavaSript file:
    // Check for Mapbox gl support:
    if (!mapboxgl.supported()) {
        alert('Your browser does not support Mapbox GL');
    };
Workshop developed by: Niene Boeijen - Webmapper - for Aeres Hogeschool Geo Media Design