Statistics
🌐 English · Deutsch
The /stats page is a Statbot-style analytics view for your servers: messages, voice activity, member status, invites, activity heatmaps, command usage, and per-member/per-channel drilldowns — all rendered as interactive Chart.js charts. It requires the pdc_webdashboard_stats cog, which is what actually records and stores the data; the dashboard only visualizes it. Access requires at least guild_member.
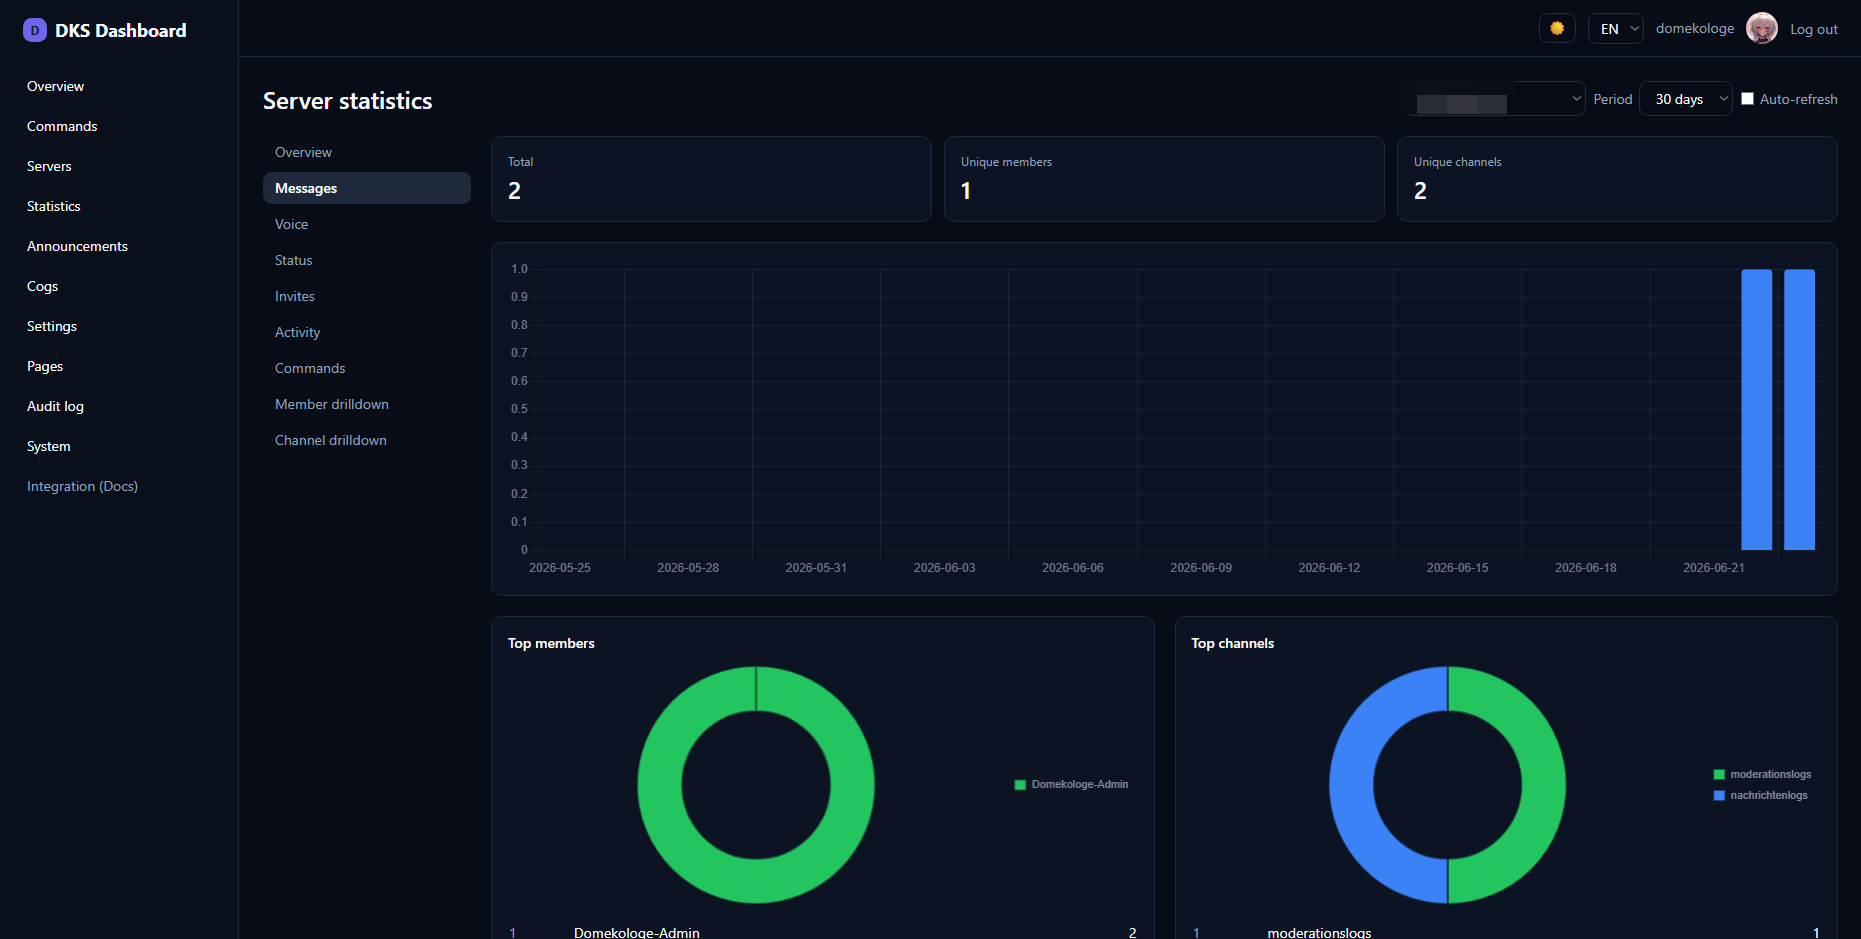
The statistics page is a front-end for the pdc_webdashboard_stats cog (formerly web_serverstats). Without it loaded, /stats reports that the cog is missing. Install and configure the cog first — its documentation lives in the cogs wiki:
➡️ Web-DashboardStats cog wiki
The cog tracks events over time, so meaningful charts appear only after it has been collecting data for a while.
| Control | Effect |
|---|---|
| Server dropdown | Choose which guild to analyze (limited to guilds you can see). |
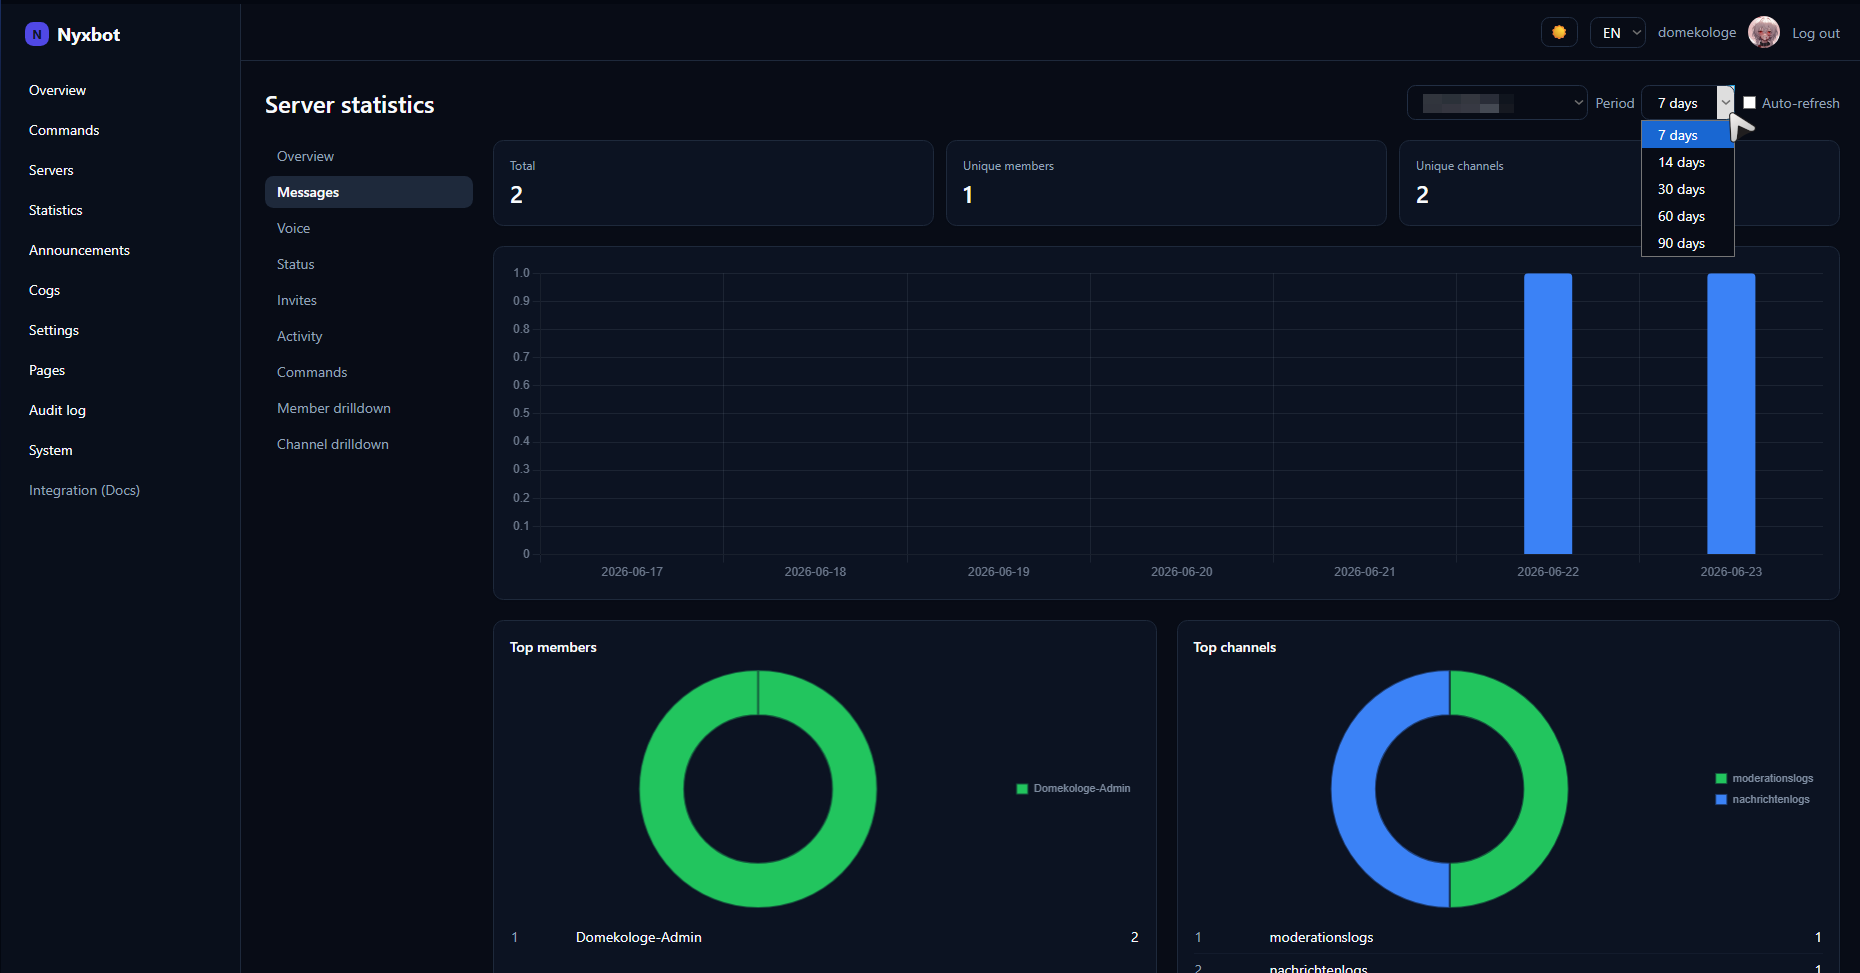
| Time filter | Window for the data (e.g. last 7 / 30 days). |
| Series toggles | Show/hide individual lines or bars within a chart. |
| Auto-refresh | Charts refresh on an interval so the view stays current. |
Each section maps to a serverstats.* RPC method backed by the cog.
| Section | Shows |
|---|---|
| Overview | Headline numbers and trends across the selected window. |
| Messages | Message volume over time. |
| Voice | Voice minutes / sessions over time. |
| Status | Online / idle / dnd / offline distribution. |
| Invites | Invite usage and who invited whom. |
| Activity | Activity patterns (e.g. by hour/day). |
| Command usage | Which commands were used and how often. |
| Member drilldown | Detailed stats for a single member. |
| Channel drilldown | Detailed stats for a single channel. |
Charts are built with Chart.js through thin wrapper components (line, bar, donut, plus a series-toggle control). Series can be turned on/off interactively, which is handy when one large series would otherwise flatten the rest. The same components power any cog widget that returns chart data.
- Web DashboardStats cog — the data-collecting cog (required)
- Web UI — the rest of the dashboard
-
API & Gateway — the
serverstats.*methods