Home
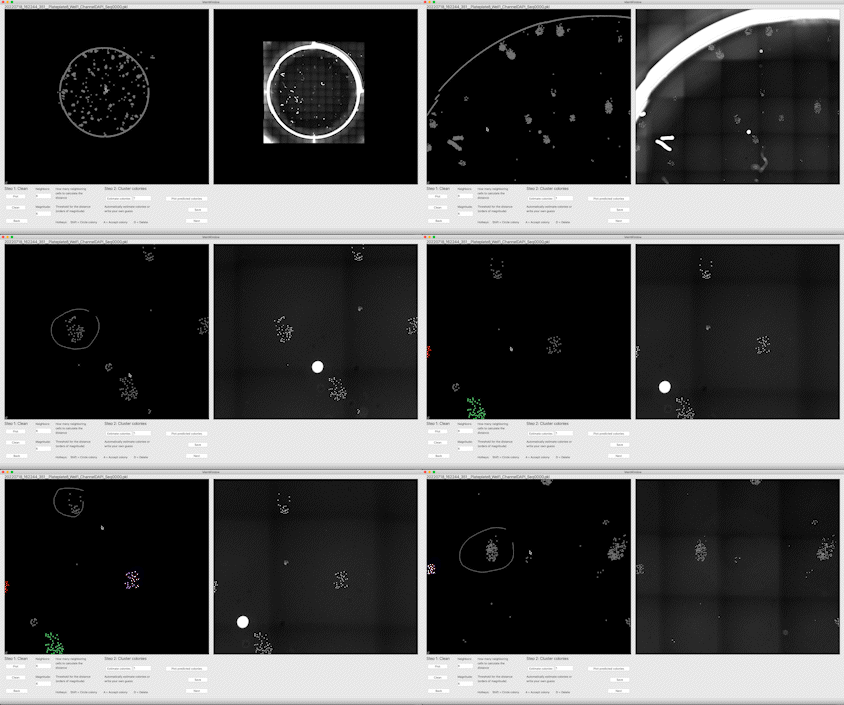
A Gui for semi-automated colony counting and also fixing the clustering by hand. It relies on PyQtGraph, a pure-Python graphics library, for fast manipulations of the data.
I recommend using CellQuant to get the XY positions of each cell in an image that will be necessary to run the GUI. For now, use the example data to get started.
All packages needed to run the Gui are in environment.yml. You can set up an environment for the Gui with the following command line: For Windows make sure you use the Anaconda Prompt.
conda env create -f path/to/environment.yml Now activate the environment:
conda activate ColonyEnvFor some reason PyQt5 needs to be pip installed: link
pip install PyQt5Make sure you are using Python 3.8+ (the environment create will satisfy this):
python --versionImages can be converted from .tif to .jpg to reduce the size and improve speed. To do this run convert_jpg.py by changing the path to path/to/tif/folder/*.tif. Viewing the image while selecting colonies is preferred but optional, as is explained in How to use?.
The data needs to be saved as a two column (x,y) dataframe with .pkl format. Some clear examples can be found in the pandas API reference here. Use the test_data to get the Gui running and as a template. Open the ColonySelector_Gui.py and go to the "User defined Paths:" and change the paths to the test_data. If you are on a Windows use "C:/path/to/test_data" format, this will avoid errors.
To run the Gui:
python path/to/ColonySelector_Gui.pyYou should now see the Gui! For information on how to use the Gui go to How to use?.

Here is a quick example of how the colony selection looks: