Repository navigation
MPI Diagnostics and HPC Analysis
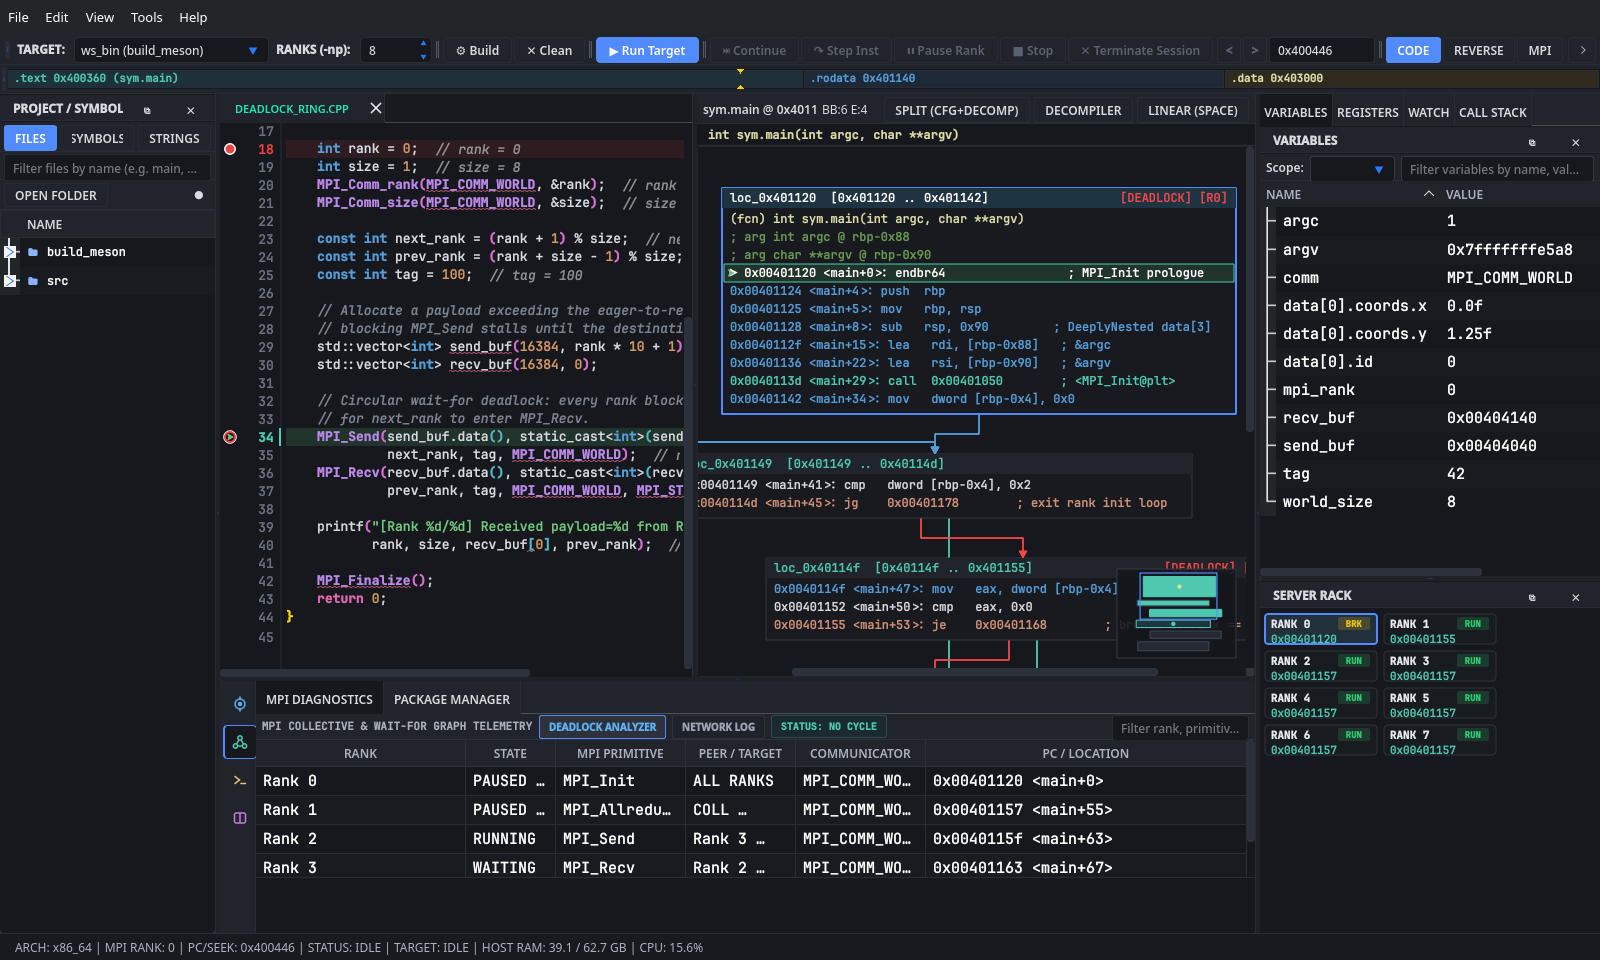
GridLock coordinates multi-rank MPI processes in real time, tracks per-rank execution states across ServerRackView and the 2D Control Flow Graph, detects collective mismatches and point-to-point stalls in DeadlockAnalyzer, highlights divergent variable values across ranks in DifferentialGrid, and queries installed HPC toolchains in HpcConsoleWidget.
-
MPMD
mpirunover Named Pipes (GdbRankCoordinator):- When launching
-np Nranks undergdb,cuda-gdb, orrocgdb,GdbRankCoordinatorcreates a private directory/tmp/gridlock_mi_<pid>_<seq>containing0600POSIX FIFOs (r0.in/r0.out..rN-1.in/rN-1.out) monitored via non-blockingQSocketNotifiers. - It invokes a single
mpirunjob with:-separated-np 1MPMD clauses so every MPI rank shares oneMPI_COMM_WORLDwhile talking over its own dedicated GDB/MI3 stream (--interpreter=mi3 --quiet --nx -iex "set debuginfod enabled off"). - During bootstrap, each GDB instance configures
pagination off,confirm off,breakpoint pending on,max-value-size unlimited, andnostop noprint passsignal dispositions for MPI transport signals (SIGPIPE,SIGUSR1,SIGUSR2,SIG32,SIG33,SIG34). IfTrap FPE (NaN/Overflow)is enabled inPreferences -> Debugger,LaunchCommandalso broadcastscatch signal SIGFPEacross all ranks.
- When launching
-
OpenMP Hybrid Thread Control:
- Unless
OMP_NUM_THREADSis already set in your environment orMPI Args,GdbRankCoordinatorsetsOMP_NUM_THREADS = max(1, idealThreadCount / rankCount)andOMP_WAIT_POLICY=PASSIVEso oversubscribed multi-rank + OpenMP jobs do not spin-lock host cores. - Within any stopped rank, use the
Thread:dropdown at the top ofCALL STACKto switch between OpenMP worker threads (-thread-info/-thread-select).
- Unless
-
Debug Adapter Protocol (
DapCoordinator):- Selecting
LLVM LLDB-DAP (lldb-dap)inPreferences -> DebuggerswitchesMainWindowtoDapCoordinator, communicating overContent-LengthJSON-RPC framing forlaunch,attach,setBreakpoints,dataBreakpointInfo/setDataBreakpoints,stackTrace,scopes,variables,evaluate,readMemory, andstepBack/reverseContinue.
- Selecting
-
Server RackDock (ServerRackView):- Renders a wrapping grid of compact blade cards (
RANK 0 .. RANK N-1). - Each card displays a color-coded state pill:
-
RUN(green#2ecc71): Rank is actively executing. -
BRK(amber#f1c40f): Rank is paused at a breakpoint, step, signal, orPause Rank. -
IDLE(gray#7f8c8d): Session is idle or the rank has exited.
-
- Below the rank title, each card shows the rank's live instruction pointer (
0x...) when stopped. -
Single-Click Rank Switching: Clicking any card sets the focused rank across
Variables,Registers,Call Stack,SourceCodeView(updating per-rank breakpoint defaults and inline ghost values),DisassemblyView, andMemory View.
- Renders a wrapping grid of compact blade cards (
-
CFG Basic-Block Rank Occupancy Badges (
DisassemblyView):- In 2D Control Flow Graph mode (
Space), every basic block displays pills on its header bar indicating which MPI ranks are currently stopped inside that block's address range (for example[R0]or collapsed[R0-R3 (4)]), plus a crimson[DEADLOCK]badge when a rank participates in a stall cycle.
- In 2D Control Flow Graph mode (
Press Alt+3 (or click MPI on the bottom tool rail via Alt+5) to open MPI Diagnostics (MpiDiagnosticsWidget).
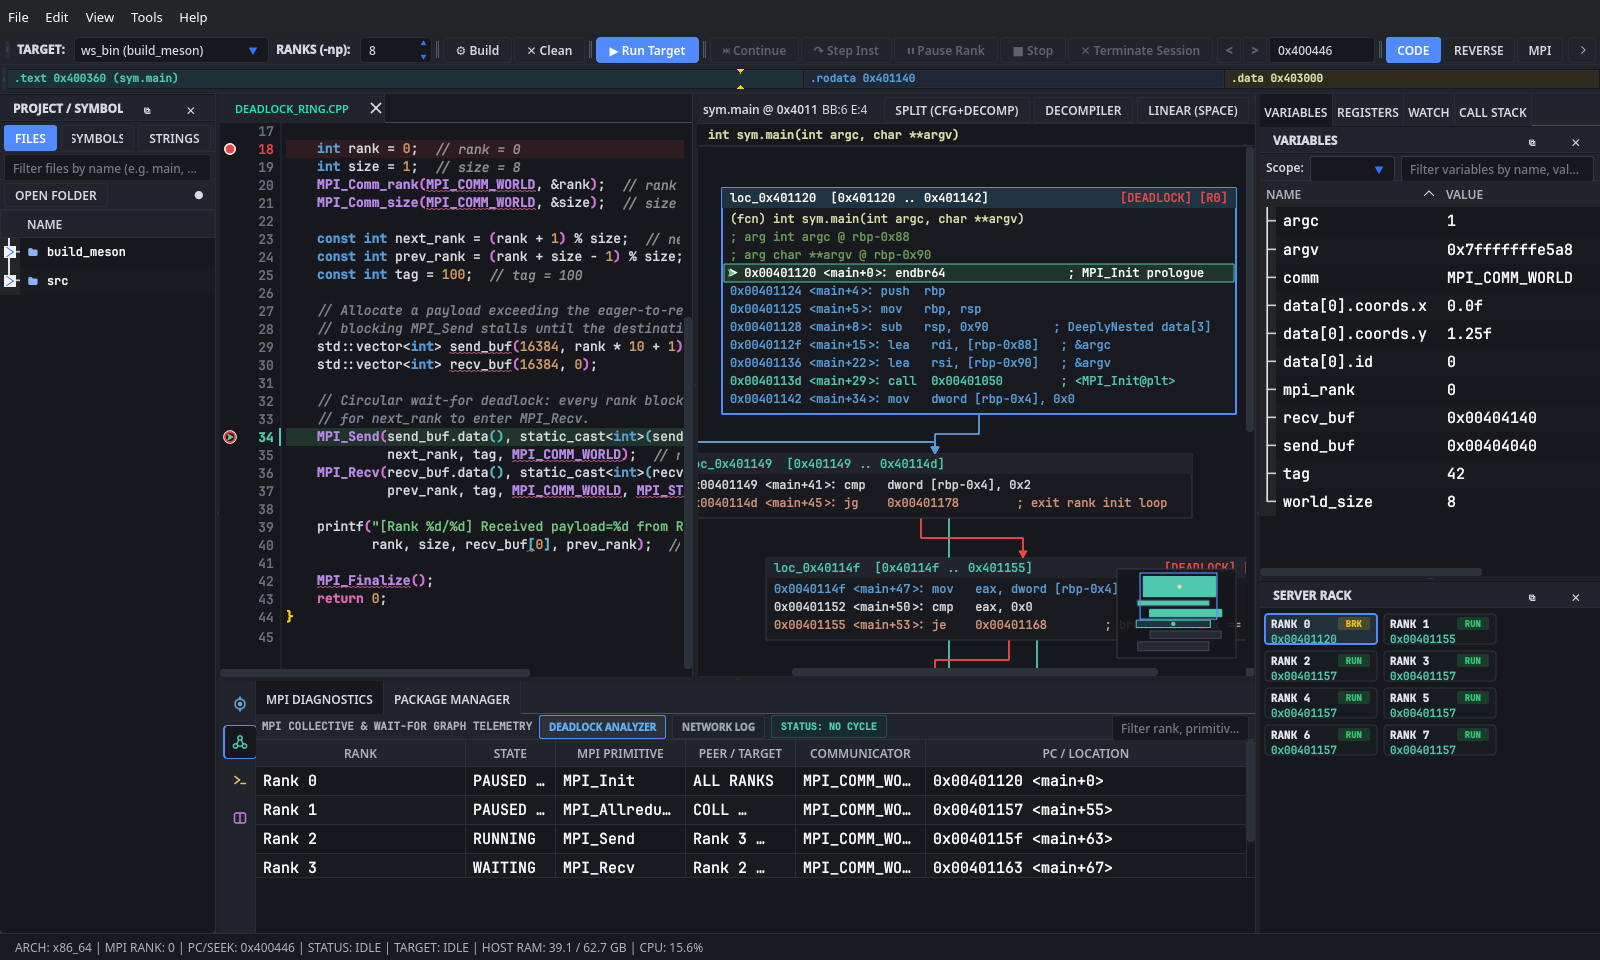
DeadlockAnalyzer inspects the innermost 8 stack frames (0..7) of every paused rank (normalizing PMPI_* profiling symbols to MPI_*) for 16 canonical blocking MPI calls:
-
9 Collective Routines:
MPI_Barrier,MPI_Bcast,MPI_Reduce,MPI_Allreduce,MPI_Gather,MPI_Scatter,MPI_Allgather,MPI_Alltoall,MPI_Scan. -
7 Point-to-Point and Wait Routines:
MPI_Send,MPI_Ssend,MPI_Sendrecv,MPI_Recv,MPI_Wait,MPI_Waitall,MPI_Waitany.
When a rank stops inside an internal MPI library frame without DWARF symbols (func="??"), DeadlockAnalyzer walks up to the first user C/C++ caller frame outside MPI_*/PMPI_* (and falls back to scanning the caller source line on disk) so table locations always point to your own source file and line.
The header badge (#mpiDeadlockStatusBadge) updates automatically as ranks pause or resume:
-
STATUS: NO CYCLE(teal): Fewer than two ranks are stalled in incompatible blocking MPI primitives. -
STATUS: COLL DIVERGENCE(crimson): Triggered when two or more paused ranks are blocked in different collective calls (for example Rank 0 inMPI_Bcastwhile Rank 1 is inMPI_Barrier), or when at least one rank is in a collective call while another rank is blocked in a point-to-point wait. -
STATUS: CYCLE DETECTED(crimson): Triggered when two or more ranks are simultaneously paused in blocking point-to-point orMPI_Wait*primitives (such as every rank blocked inMPI_Sendindeadlock_ring.cpp, or Rank 0/Rank 1 stalled on mismatched tags intag_mismatch_stall.cpp).
-
DEADLOCK ANALYZERTable (#mpiRankWaitTable): ShowsRANK(with live OS PID),STATE,MPI PRIMITIVE,PEER / TARGET,COMMUNICATOR, andPC / LOCATION(file:line), filtered live via the header search box. -
Jump to Stalled Rank: Double-click any row in the wait table or the bottom alert list to focus that rank and jump
SourceCodeViewandDisassemblyViewto its caller site.
Inside MPI Diagnostics, click NETWORK LOG in the header bar to switch from the wait-for table to the message event log:
-
Columns:
TIMESTAMP,SRC RANK,DST RANK,PRIMITIVE,TAG / COMM, andPAYLOAD BYTES. -
Controls: Substring search box (
Filter traffic / rank / tag...), traffic category dropdown (All Traffic,Point-to-Point,Collectives), andClear.
When debugging numerical drift, ghost-cell corruption, or rank-dependent branching across N processes, evaluating variables one rank at a time does not scale. Use the WATCH dock (DifferentialGrid):
-
Add Expressions:
- Type any C/C++ expression (such as
cfg.rank_branch_tag,left_ghost,stencil_center, ordata[1].coords.x) intoNew watch expression...at the top ofWATCHand click+ Watch(or pressEnter). - You can also right-click a row in
Variablesand chooseAdd to Watch Expressions, click+ WatchinsideEvaluator, orCtrl+LeftClick/DoubleClickan identifier inSourceCodeView.
- Type any C/C++ expression (such as
-
Consensus Outlier Highlighting:
- Rows correspond to
Rank 0 .. Rank N-1; columns correspond to watched expressions. - On every stop,
DifferentialGrid::updateHighlights()computes the modal (majority-vote) value string in each column across active ranks. Any rank cell whose value differs from the majority consensus is shaded light red (rgb(255, 200, 200)), immediately isolating a single diverged ornan-corrupted rank.
- Rows correspond to
Note on Multidimensional Array Heatmaps: In
v0.8.7, live auto-refreshing 1D line/stem and 2D colormapped heatmap plotting is built intoTools -> Array & Field Plotter...(Ctrl+Alt+G), cross-rank scalar and struct-member outlier comparison is handled byDifferentialGrid, and raw typed array slices (Int32,Float,Double) can be exported to.csvor.binfromMemory View(Export). Multi-rank 1D overlays and 3D tensor views are scheduled forv0.8.8(see Engineering Roadmap).
Click MPI on the bottom tool rail (Alt+5) and open the Package Manager tab to verify which MPI implementations, math libraries (hypre, petsc, fftw, hdf5), debuggers, and compilers are installed on your workstation or cluster login node.
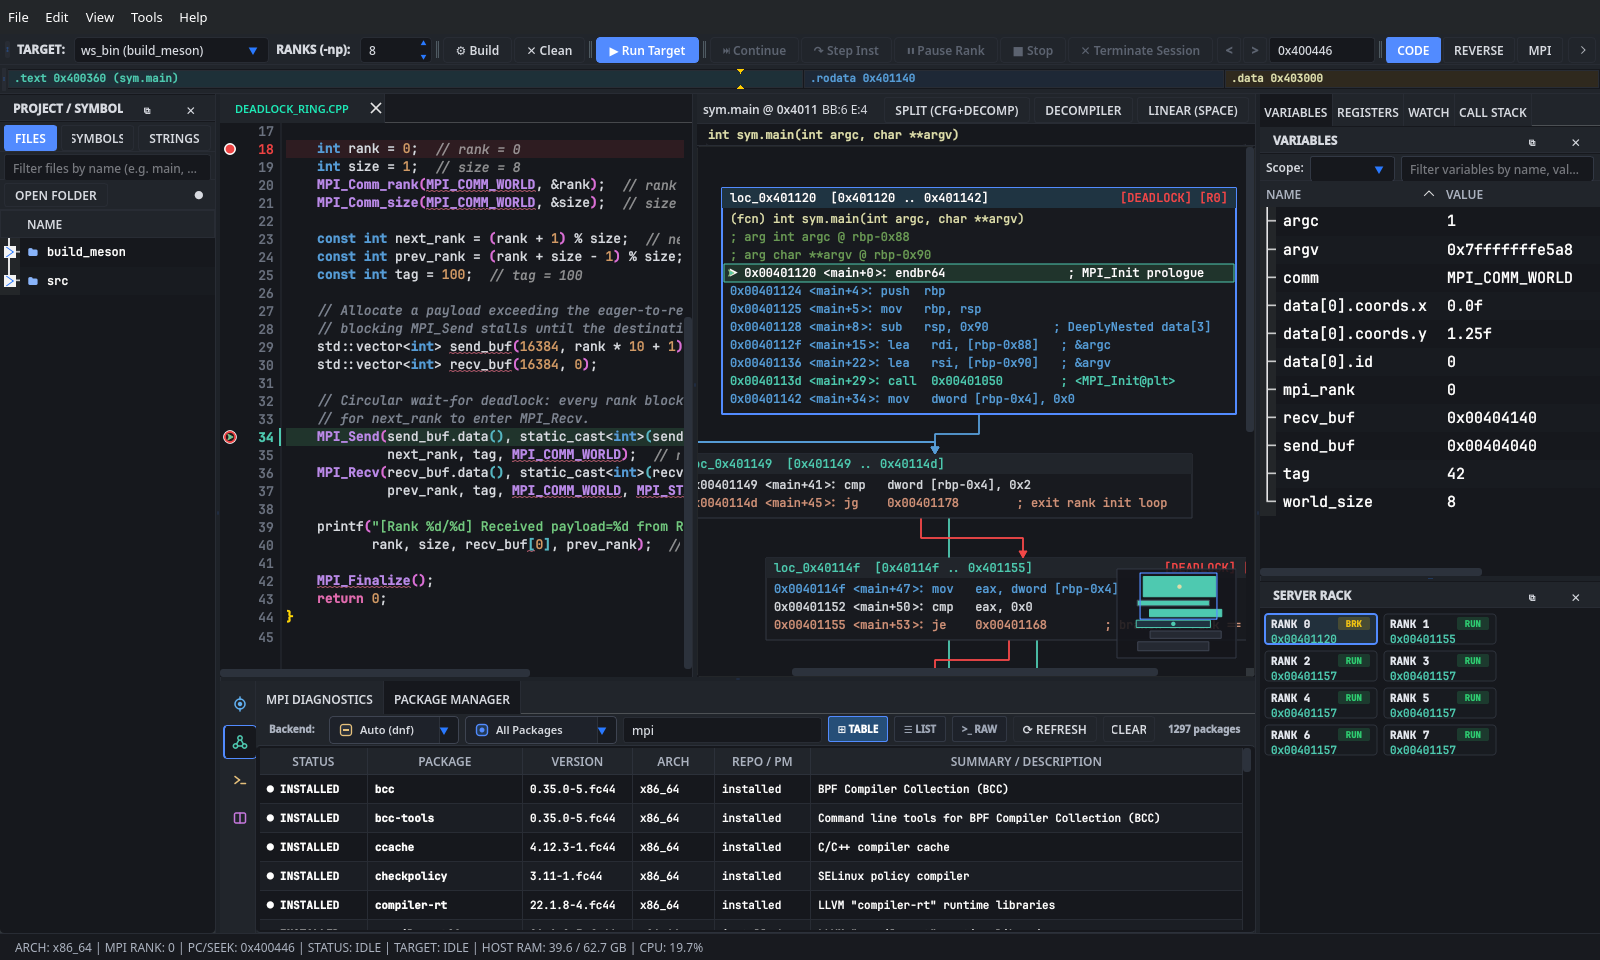
Sortable Table Mode (⊞ Table) |
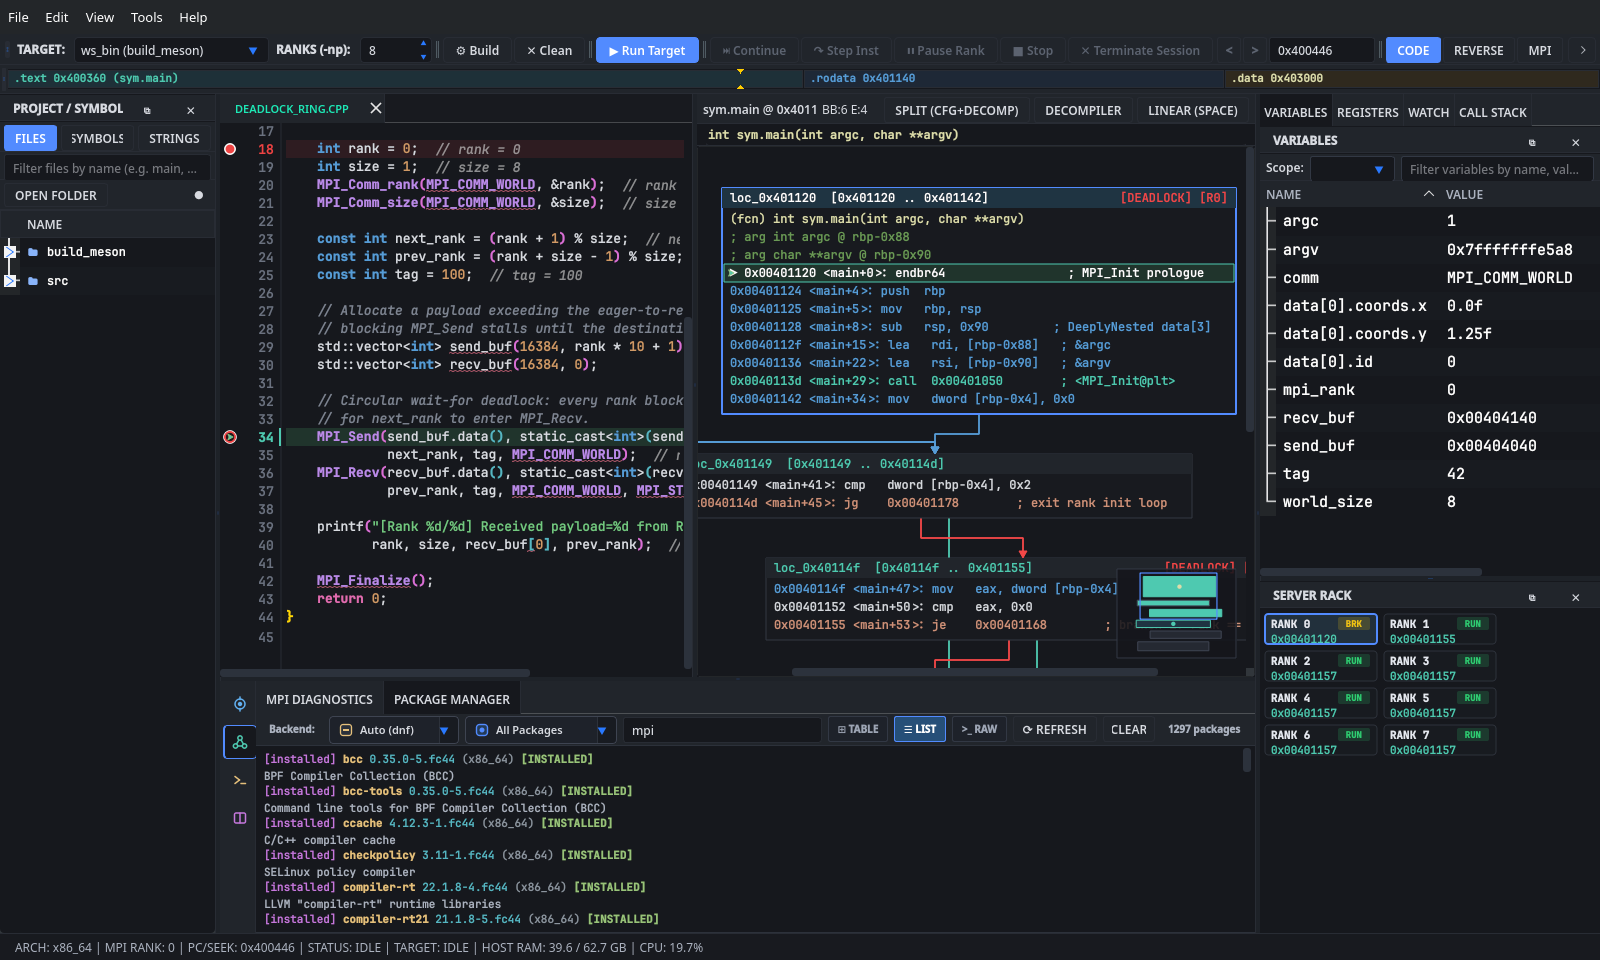
Rich Card Mode (☰ List) |
|---|---|
 |
 |
-
Auto-Detected Package Backends: Probes
PATHin order:spack,pacman,dnf(supports both DNF4 and DNF5 output formats),apt-cache/apt,zypper,rpm,dpkg-query, andeb. Override via theBackend:dropdown (Auto,spack,pacman,dnf,apt,zypper,rpm). -
Two-Stage Query Pipeline: Queries the local installed package database first (
rpm -qa,dpkg-query -W,pacman -Qs) for instant● INSTALLEDresults, then runs a debounced (300 ms) repository search (spack list -d,dnf --quiet search,pacman -Ss,apt-cache search,zypper --non-interactive se -s) to merge○ AVAILABLEpackages. -
Filters & Display Modes: Filter by
All Packages,Installed Only, orAvailable Only, and switch between⊞ Table(6 sortable columns),☰ List(two-line summary cards), and>_ Raw(unformatted CLI output).