Repository navigation
User Manual UI and Debugging
This manual documents every workspace perspective, menu action, toolbar control, dock widget, execution control, breakpoint lifecycle feature, signal/catchpoint manager, copy-on-write checkpoint tool, and keyboard shortcut in GridLock (v0.8.7). For a compact lookup table, see Keyboard Shortcuts and Quick Reference.
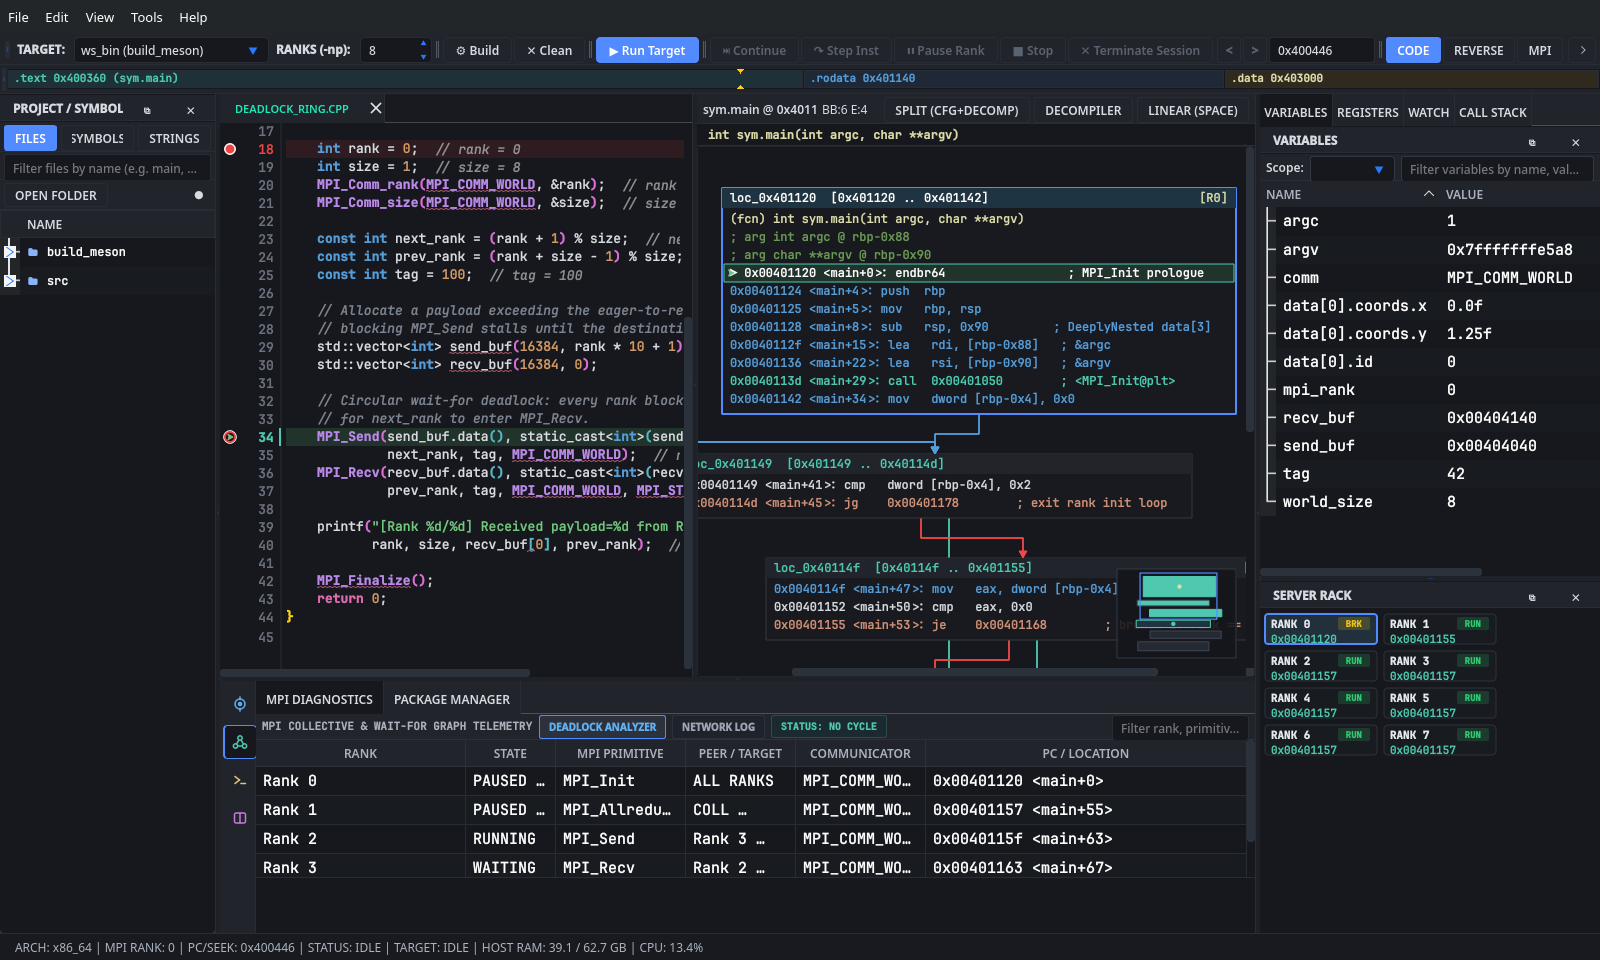
Switch perspectives from the right side of the main toolbar (CODE | REVERSE | MPI) or via keyboard shortcuts:
-
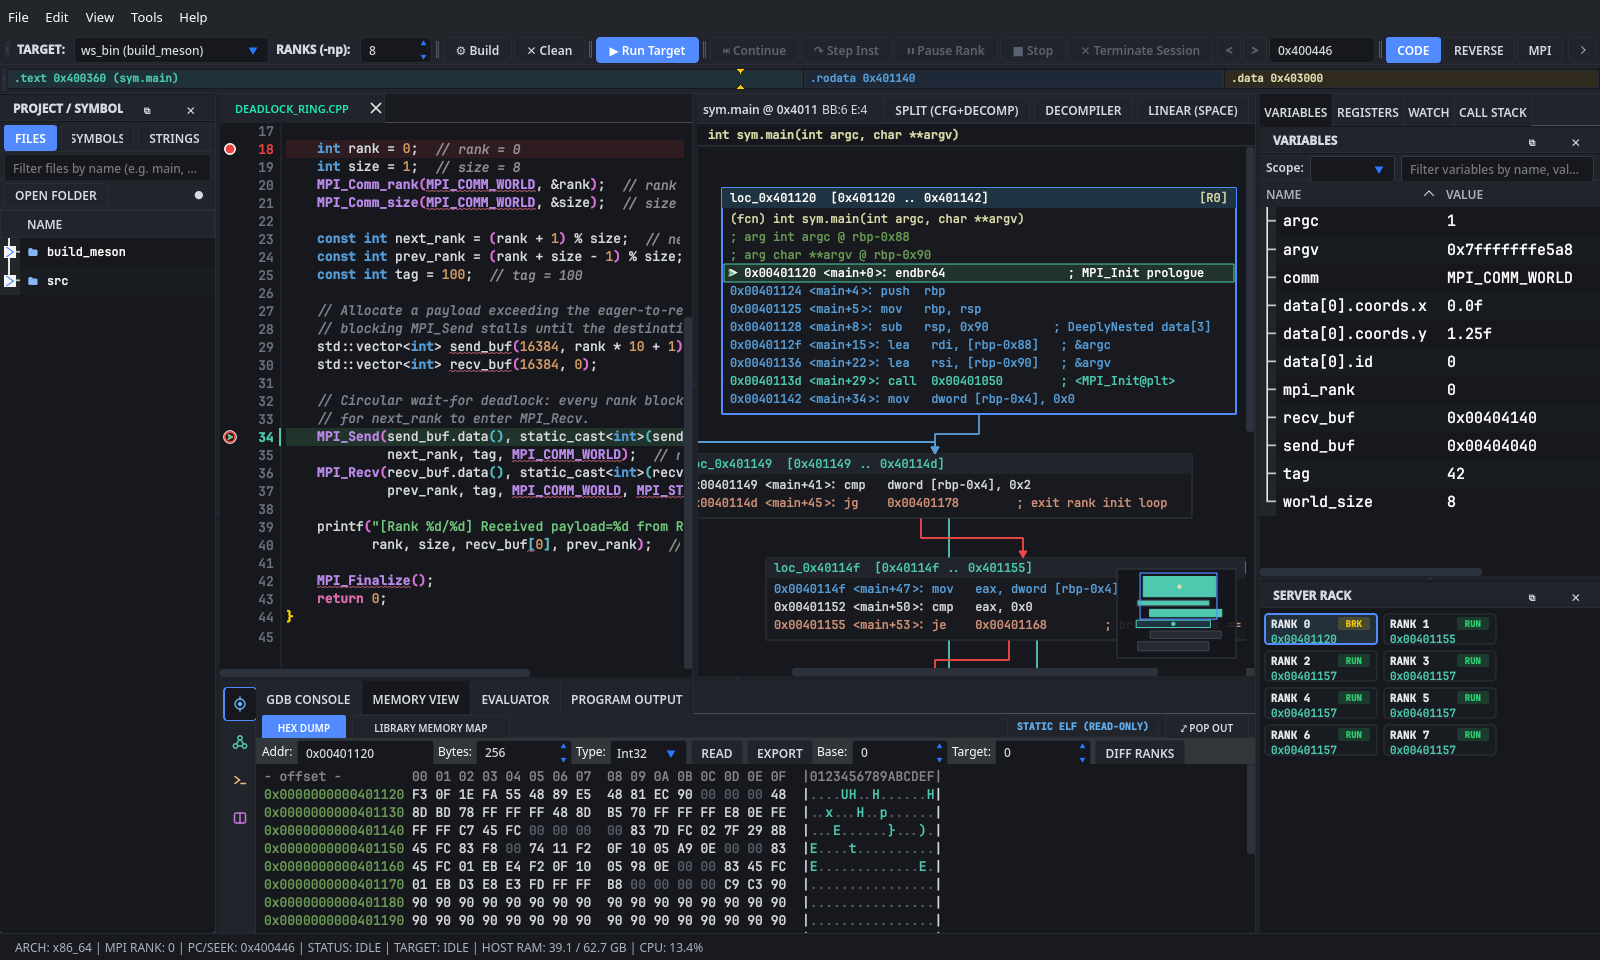
CODE(Alt+1): Default side-by-side layout pairing the multi-tab source editor (EditorTabManager/SourceCodeView) on the left withDisassemblyViewon the right, flanked byProject / Symbolson the far left andVariables,Registers,WATCH,CALL STACK, andServer Rackon the right. -
REVERSE(Alt+2): Collapses the source editor and gives the central viewport toDisassemblyViewin 50/50SPLIT (CFG+DECOMP)mode (2D basic-block Control Flow Graph paired with the pseudo-C/C++ decompiler). -
MPI(Alt+3): Activates theMPIgroup on the bottom tool rail, switchesBottomConsoleTabstoMPI Diagnostics, and expands the bottom dock for cluster stall inspection.
Press Ctrl+M at any time to toggle maximizing and restoring the height of the bottom console dock.
-
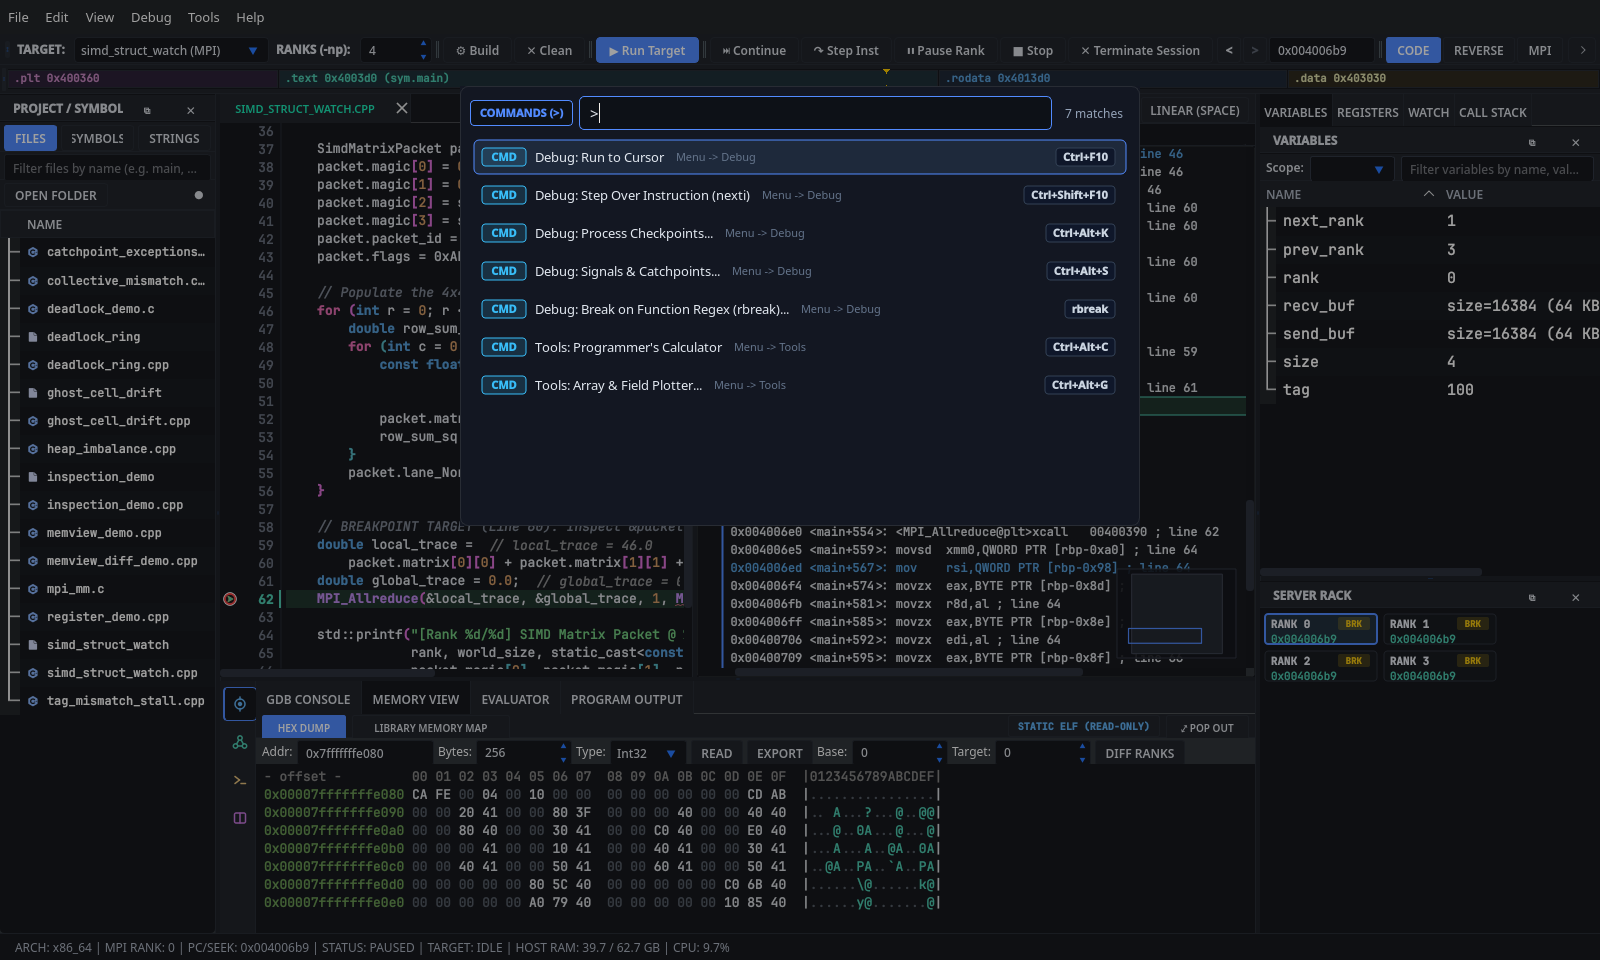
Ctrl+Shift+P(View -> Command Palette...): Opens the keyboard launcher pre-filtered with>for commands and actions (Debug: Run to Cursor,Debug: Break on Function Regex (rbreak)...,Process Checkpoints...,Signals & Catchpoints...,Programmer's Calculator,Array & Field Plotter..., perspective switches, and themes). -
Ctrl+P(File -> Quick Open): Opens the unified fuzzy palette across workspace files, commands, symbols, themes, and ranks. -
Domain Prefixes: Type
>for menu/shortcut actions,@forclangdand ELF64 symbols, or#to jump directly to a live MPI rank. Navigate results withUp/Down, execute withReturn, and close withEsc.
| Menu Action | Shortcut | Behavior |
|---|---|---|
New Project... |
- | Opens the 2-page ProjectWizard to configure workspace root, binary, arguments, -np ranks, and OpenMPI binding/output flags, then starts a session. |
Open Workspace... |
- | Switches active workspace root (switchWorkspaceDirectory), re-roots ProjectExplorerWidget, scans for ELF binaries and sources, and updates the embedded terminal CWD. |
Open Source File |
- | Opens a .cpp, .hpp, .h, or .c file in EditorTabManager. |
Quick Open... |
Ctrl+P |
Opens CommandPaletteDialog in unified fuzzy search mode. |
Save Source File |
Ctrl+S |
Saves the active modified buffer in SourceCodeView. |
Save All |
Ctrl+Shift+S |
Saves all dirty tabs (● indicator) in EditorTabManager. |
Switch Header/Source |
F10 |
Toggles between matching .cpp/.c and .hpp/.h/.hxx/.hh files in the same directory. |
Save Session / Save Session As... / Load Session...
|
- | Saves or restores watched variables, active breakpoints, and focused rank via .gridlock/workspace.toml. |
Recent Sessions |
- | Lists up to 10 recent workspace/session paths (debugger.conf) plus Clear Recent Sessions. |
Project Settings |
- | Opens ProjectSettingsDialog (Target Binary, Program Arguments, Working Directory, MPI Ranks (-np), MPI Args, and Programmer's Calculator defaults). |
Attach to Process... |
Ctrl+Alt+P |
Opens the two-tab AttachProcessDialog (Local Processes (/proc) and Remote Target (gdbserver / QEMU)). |
Submit SLURM Job |
- | Substitutes {FILE} in the configured SLURM template and dispatches a preview submission to MockHpcBackend. |
Exit |
- | Closes GridLock (prompts on unsaved editor tabs and, if Confirm Quit is Yes, confirms exit). |
| Menu Action | Shortcut | Behavior |
|---|---|---|
Edit -> Undo / Redo / Cut / Copy / Paste / Select All
|
Ctrl+Z / Ctrl+Shift+Z / Ctrl+X / Ctrl+C / Ctrl+V / Ctrl+A
|
Standard edit operations on the focused text editor. |
Edit -> Find in View... / Go to Line... / Toggle Comment
|
Ctrl+F / Ctrl+L / Ctrl+/
|
Seek bar focus, line jump, and // line comment toggle. |
Edit -> Go to Definition |
F12 (in editor)
|
Resolves the symbol under the cursor via ClangdLspClient (textDocument/definition). |
Edit -> Preferences |
Ctrl+, |
Opens the 8-page PreferencesDialog. |
View -> Command Palette... |
Ctrl+Shift+P |
Opens CommandPaletteDialog in command mode (>). |
View -> Toolbars (Main Toolbar, Address Space Navigation, Reset Toolbars) |
- | Toggles or resets top toolbars. |
View -> Split Editor Right / Split Editor Down / Close Split
|
- | Splits EditorTabManager horizontally or vertically and closes secondary panes. |
View -> Redock All Floating Panels |
Ctrl+Shift+R |
Docks all floating QDockWidget panels back into their home slots. |
View -> Project / Symbols, Variables, Registers, WATCH, Server Rack
|
- | Checkable visibility toggles for each dock panel. |
| Menu Action | Shortcut | Behavior |
|---|---|---|
Debug -> Step Over Instruction (nexti) |
Ctrl+Shift+F10 |
Steps over a single machine instruction (-exec-next-instruction), treating call instructions atomically. |
Debug -> Run to Cursor |
Ctrl+F10 |
Runs the focused rank until the active editor line (-exec-until "<file>:<line>") or focused disassembly address (-exec-until *0x<addr>). |
Debug -> Set Next Statement / Jump... |
- | Relocates execution PC (-exec-jump) to the active or prompted source line after running lexical scope safety checks. |
Debug -> Force Early Return... |
- | Forces immediate return from the active stack frame (-exec-return [expr]) with an optional return expression. |
Debug -> Break on Function Regex (rbreak)... |
- | Installs GDB regex function breakpoints (rbreak <pattern>) across matching symbols. |
Debug -> Process Checkpoints... |
Ctrl+Alt+K |
Opens floating CheckpointDialog for copy-on-write GDB checkpoint/restart snapshots with /proc safety checks. |
Debug -> Signals & Catchpoints... |
Ctrl+Alt+S |
Opens SignalCatchpointDialog for per-signal handle <SIG> dispositions and C++/syscall/dlopen catchpoints. |
Tools -> Build Target / Clean Target / Rebuild Target
|
Ctrl+B / - / - |
Auto-detects Meson, CMake, Make, or standalone mpicxx/mpicc. |
Tools -> Pointer & Struct Graph Visualizer... |
- | Opens floating PointerGraphDialog (1100x720) with persistent pinned roots. |
Tools -> Array & Field Plotter... |
Ctrl+Alt+G |
Opens floating ArrayPlotDialog for live auto-refreshing 1D/2D array and heatmap plotting. |
Tools -> Programmer's Calculator... |
Ctrl+Alt+C |
Opens floating ProgrammerCalculatorDialog (HEX/DEC/OCT/BIN/IEEE-754/64-bit grid). |
Tools -> Run Tests / Help -> About GridLock
|
- | Triggers --test-mode automation runner or displays version metadata. |
-
TARGET:(#toolbarTargetSelector): Lists the bundled MPI showcase programs (or workspace ELF/source targets) plusOpen ELF / Binary.... -
RANKS (-np):(#toolbarRankSpin): MPI world size (1..256, default8). -
⚙ Buildand✕ Clean: Compile or clean the selected target/workspace. -
▶ Run Target(changes to● Runningwhile active): Compiles on demand if needed and starts the debugging session. -
⏭ Continue,↷ Step Inst,⏸ Pause Rank,■ Stop,✕ Terminate Session: Session execution controls (enabled only when a debug session is active). -
<and>: Backward and forward address history navigation (Alt+Left/Alt+Right). -
Seek Bar (
Go to address / symbol (Ctrl+G)...): Accepts hex addresses (0x40113d), symbol names (main,MPI_Send), or register expressions ($rsp). -
CODE|REVERSE|MPI: Workspace perspective buttons (Alt+1/Alt+2/Alt+3). -
⏺ Record,↶ Step Back,⏮ Rev Continue: Time-travel reverse debugging controls (record full,-exec-next --reverse,-exec-continue --reverseon GDB;stepBack/reverseContinueon DAP).
-
Instruction Step-Over (
nexti,Ctrl+Shift+F10): Available in theDebugmenu, Command Palette, andDisassemblyViewtoolbar (nextialongsidestepi). Issues-exec-next-instructionon GDB (nextwith instruction granularity on DAP). -
Run to Cursor (
Ctrl+F10): Executes until the active cursor line inSourceCodeView(-exec-until "<file>:<line>") or the selected instruction address inDisassemblyView(-exec-until *0x<addr>). Also available via right-click in both views. -
Draggable Gutter PC Arrow & Set Next Statement / Jump (
-exec-jump): Drag the active execution▶arrow vertically insideSourceCodeView's gutter to another line (or useDebug -> Set Next Statement / Jump...or right-clickSet Next Statement / Jump Here). Before executing-exec-jump,MainWindow::checkJumpLexicalScopeHazardchecks whether the jump crosses function boundaries, enters/exits lexical{}scopes, or skips local variable declarations and asks for confirmation if a hazard is detected. -
Force Early Return (
-exec-return): ChooseDebug -> Force Early Return...or right-click any row inCALL STACKto force an immediate return from the active frame, optionally supplying a C/C++ return expression (leave empty forvoidfunctions).
Displays proportional clickable segments for the loaded ELF64 binary: .plt, .text (annotated with sym.main), .rodata, .data (or .bss), plus a live stack 0x<rsp> segment while a debugging session is active. Clicking any segment seeks both DisassemblyView and MemView to that section's base virtual address.
Switch between three modes at the top of the left dock, all sharing a live wildcard/substring filter bar:
-
FILES: Workspace file tree with"Open Folder"and Collapse-All buttons. Double-click a file to open it; pressF2to rename; right-click forNew Source File (.cpp)...,New Header File (.hpp)...(generates#pragma oncestub),New Folder...,Rename..., andDelete...(with optional automatic source registration inmeson.buildorCMakeLists.txt). -
SYMBOLS: Sortable 3-column table (SYMBOL,ADDRESS,SIZE) of up to 800STT_FUNCandSTT_OBJECTsymbols extracted byElfBinaryInspector. Double-click any row to seek to that symbol. -
STRINGS: Sortable 3-column table (ADDRESS,SECTION,STRING) of up to 500 printable ASCII strings (>= 4chars) from.rodata,.dynstr, and.interp.
-
Scope Breadcrumbs & Git Diff Gutter: Displays
File > Class/Struct > Functionabove the editor and marksAdded(green),Modified(blue), andDeleted(red triangle) lines againstHEADon the right edge of the line-number gutter. -
Multi-Language & Rainbow Bracket Highlighting (
EditorSyntaxHighlighter): Highlights C/C++/CUDA (including bold purpleMPI_*calls),TOML,YAML,Markdown, andCSV/TSV(6-color alternating column rotation), with 5-level cyclic rainbow brackets ((),{},[]) and red underlines on unmatched closing brackets. -
clangdLSP Integration (ClangdLspClient):- Automatically locates
compile_commands.jsonacross.,builddir/,build/,build_meson/, andbuild_cmake/. - Draws wavy error (
#f7768e) and warning (#e0af68) underlines fromtextDocument/publishDiagnostics. - Triggers
LspCompletionPopupon.,->,::, orCtrl+Space. - Shows type/Doxygen hover cards (
HoverWidget) after a400 mshover, jumps to definitions onF12, and supportsfindReferencesand AST-saferenameSymbol.
- Automatically locates
-
Inline Variable Ghost Values & Quick Watch Pinning: When paused, appends muted italic
// var = valannotations (toggle inPreferences -> Editing).Ctrl+LeftClickorDoubleClickany identifier to pin it toWATCH(DifferentialGrid).
-
Left-Click Gutter: Toggles an unconditional All-Ranks breakpoint (
●crimson circle with white ring). -
Shift+Right-ClickGutter: Opens a quick gutter context menu (Disable Breakpoint/Enable Breakpoint,Insert Temporary Breakpoint (tbreak),Run to Cursor,Set Next Statement / Jump Here). -
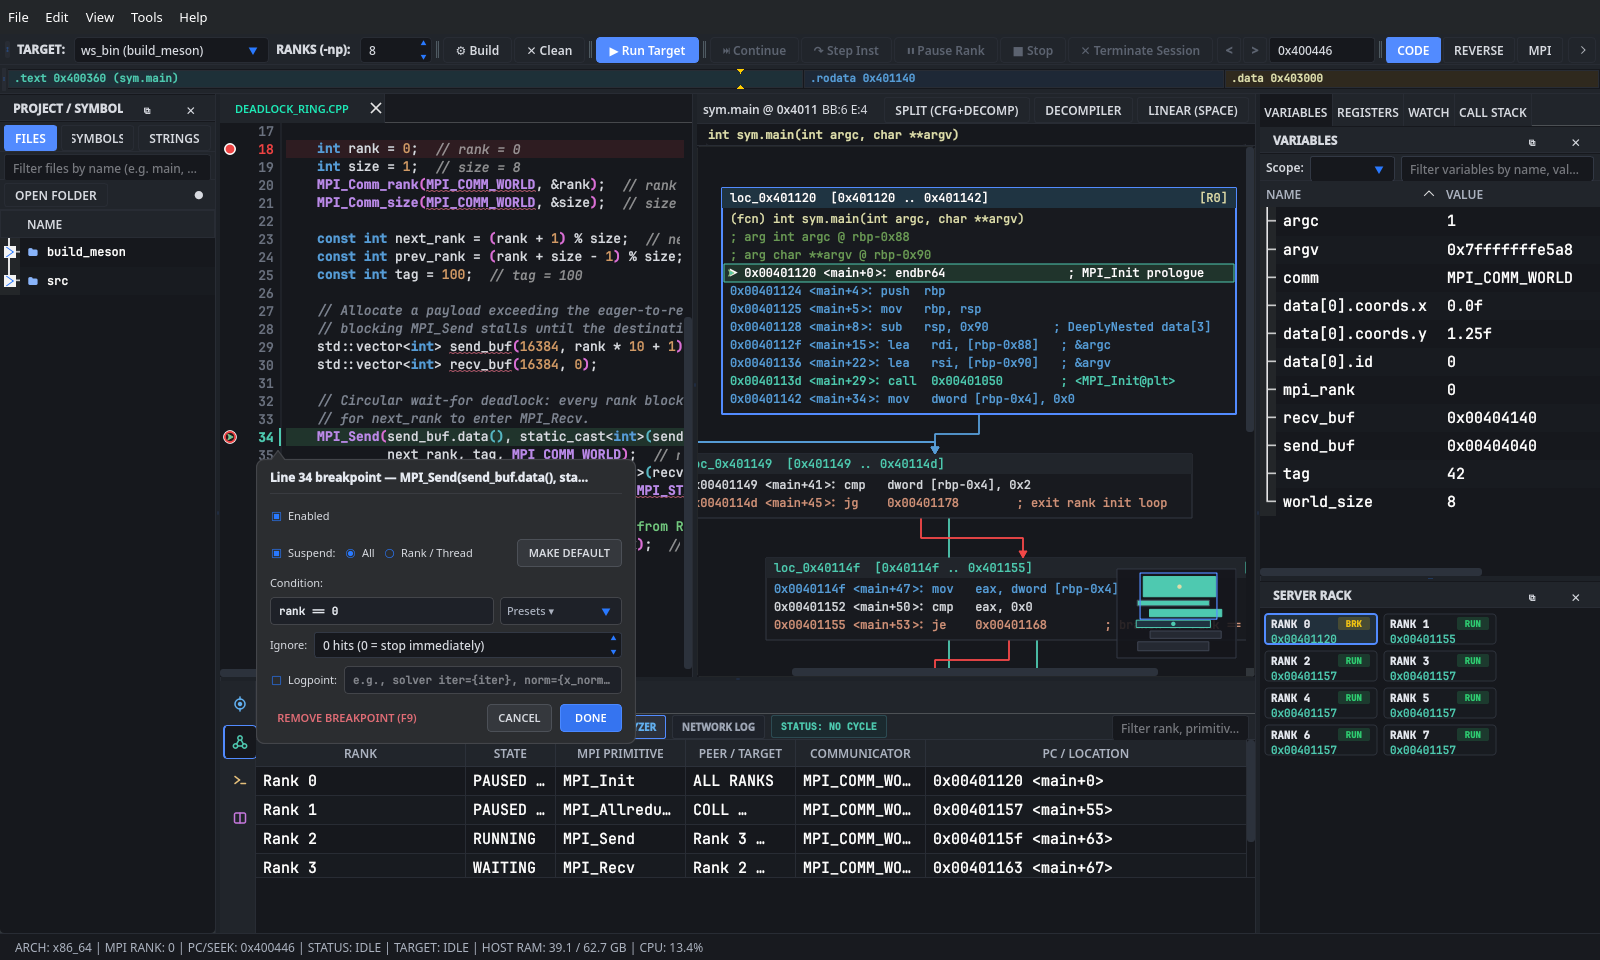
Right-Click Gutter: Opens the cursor-anchored
ConditionalBreakpointDialogpopover:-
Non-Destructive
EnabledToggle (-break-enable/-break-disable): UncheckingEnabledkeeps the breakpoint along with its condition, ignore count, rank filter, and command list, rendering a hollow red/amber ring marker ([DISABLED]in hover tooltip) instead of deleting it. UseRemove Breakpoint (F9)to permanently delete a breakpoint. -
Temporary One-Shot Breakpoints (
Temporary (one-shot tbreak)): Inserts-break-insert -t, renders a dashed cyan ring with aTglyph, and automatically removes the gutter marker when triggered (=breakpoint-deleted). -
Suspend: All | Rank / Thread: ChooseAll(rankFilter = -1) orRank / Thread(focused rank only, rendered with a per-rank badge). ClickMake Defaultto persist your preferred scope. -
Condition:&Ignore:: Enter any C/C++ boolean expression with liveclangdvirtual-buffer autocomplete (orPresets ▾), and optional ignore counts (0..10,000,000) via-break-insert -i N/-break-after. -
Logpoint:: Logs[LOGPOINT Rank r] ...with{identifier}substitution intoProgram Outputand immediately resumes (-exec-continue), rendered as an amber diamond with a cyan border. -
GDB Commands on Hit (commands ... end):: Multi-line script box dispatched via-break-commands <id> "cmd1" "cmd2"(clearing the editor sends-break-commands <id>to remove attached commands).
-
Non-Destructive
-
Regex Symbol Breakpoints (
rbreak): ChooseDebug -> Break on Function Regex (rbreak)...(or Command Palette> rbreak), enter a regex such asMPI_.*|Solver::step.*, and GridLock issues-interpreter-exec console "rbreak <pattern>"and tracks newly created=breakpoint-createdrecords.
Open Debug -> Signals & Catchpoints... (Ctrl+Alt+S) to manage runtime signal handling and event catchpoints across all active ranks:

-
Tab 1 (
Signal Disposition Matrix): Filterable table of standard POSIX and HPC fabric signals (SIGFPE,SIGPIPE,SIGUSR1,SIGUSR2,SIGBUS,SIGSEGV,SIGABRT,SIGALRM,SIGINT,SIGTERM,SIGCHLD,SIGURG,SIGILL,SIGTRAP) with liveStop,Print, andPasscheckboxes issuinghandle <SIG> <stop|nostop> <print|noprint> <pass|nopass>, plus 1-clickHPC Quiet DefaultsandTrap Faultspresets. -
Tab 2 (
Catchpoints):-
C++ Exceptions: Install
throw(-catch-throw),rethrow(-catch-rethrow), orcatch(-catch-catch) catchpoints with optional exception-type regex filtering (-r <regex>). -
Linux Syscalls: Quick-toggle preset chips (
mmap,openat,clone3,ioctl,munmap,brk,futex,socket) plus custom comma-separated syscall names (catch syscall ...). -
Shared Libraries: Install
dlopen(-catch-load) ordlclose(-catch-unload) catchpoints with optional library regex filtering.
-
C++ Exceptions: Install
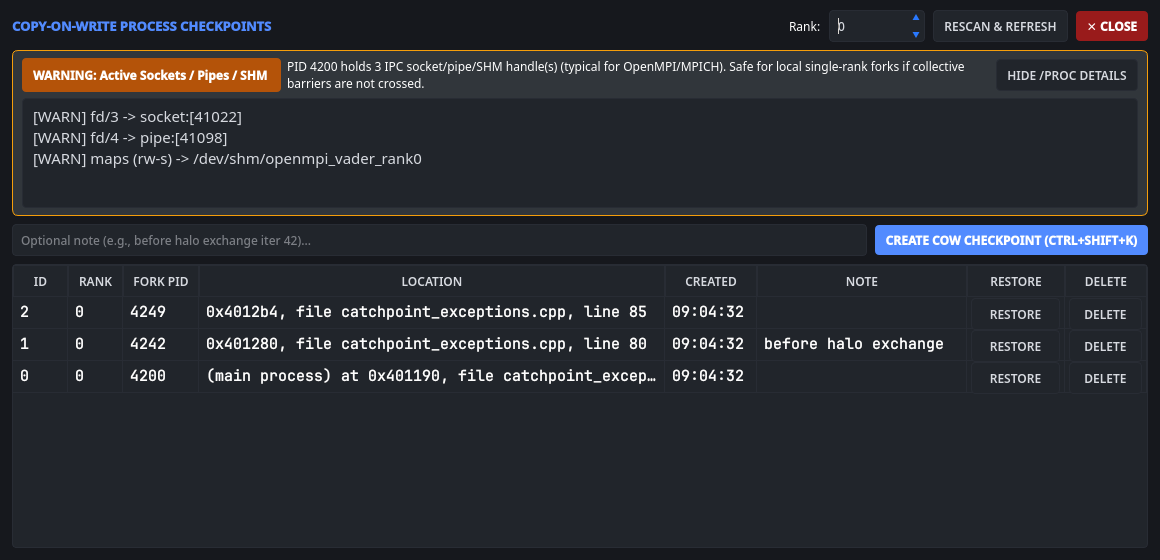
Open Debug -> Process Checkpoints... (Ctrl+Alt+K) to save and restore lightweight Linux copy-on-write process snapshots on a paused rank:
-
Pre-Checkpoint
/proc/[pid]/fd&/proc/[pid]/mapsSafety Scanner: Before creating a fork snapshot,inspectProcessCheckpointSafety()inspects open file descriptors and memory mappings for the focused rank's PID and displays a color-coded status banner plus expandable/procdiagnostics:-
SAFE(green): No external sockets, pipes, shared-memory IPC, RDMA verbs, or GPU device mappings detected. -
WARNING: Active Sockets / Pipes / SHM(amber): Activesocket:[...],pipe:[...],eventfd,/dev/shm/,SYSV, or writable file handles (typical for OpenMPI/MPICH ranks; safe for local single-rank forks if collective barriers are not crossed). -
UNSAFE: RDMA / GPU Device Mapping Detected(red): Active/dev/infiniband/*,uverbs,mlx5,/dev/nvidia*,/dev/kfd, or/dev/dri/device handles/VMAs wherefork()can triggerEFAULTor driver faults.
-
-
Create, Restore, and Delete: Enter an optional note and click
Create CoW Checkpoint (Ctrl+Shift+K)(prompts confirmation onWARNING/UNSAFE), then clickRestore(restart <id>) to jump backward in execution and refresh frames/variables/registers, orDelete(delete checkpoint <id>) to reclaim a snapshot.
Right-click any scalar variable, struct member, or array element in the Variables dock and choose Watch Memory Write, Watch Memory Read, or Watch Memory Read/Write (-break-watch [-r|-a] <expr> / DAP dataBreakpoints).
-
Variables(VariablesDockWidget): Sortable 3-column tree (Name,Value,Type) with aScope:rank selector and recursive filter box. Lazily expands C++ structs, base classes, andstd::vectorelements; highlights mutated scalars in coral (#f38ba8); left-clicking a0x...pointer reads 256 bytes inMemory View; right-clicking promotes toWATCH, opensPointerGraphDialog, opensArrayPlotDialog, opensProgrammerCalculatorDialog, or sets a hardware watchpoint. -
Registers(RegisterView): Sortable 2-column table (REG,VALUE / ROLE) pinningrip,rsp, andrbpat the top, highlighting changed registers in bold red, filtering by register name or hex/unsigned-decimal value, and jumping to pointer targets on double-click. -
WATCH(DifferentialGrid): Cross-rank expression matrix (Rank 0 .. Rank N-1rows by watched expression columns) highlighting minority-consensus outliers in light red (rgb(255, 200, 200)). -
CALL STACK(CallStackDockWidget): Displays an OS/OpenMPThread:selector (-thread-info/ DAPthreads) above a 4-column backtrace table (#,Function,Location,Address) up to 64 frames deep. Right-click any row forForce Early Return.... -
Server Rack(ServerRackView): Wrapping grid of rank cards showingRANK N, state pill (RUN,BRK,IDLE), and current PC (0x...).
| Rail Button | Shortcut | Hosted Bottom Tabs |
|---|---|---|
Debug |
Alt+4 |
GDB Console (target rank selector All Ranks / Rank N, stream filter, Raw MI toggle, MiSanitizer-validated gdb> prompt with readline ergonomics), Memory View (HEX DUMP and LIBRARY MEMORY MAP), Evaluator (DWARF / C++ EVALUATOR), and Program Output (launch command COPY, rank filter, stdout/stderr & [LOGPOINT] stream). |
MPI |
Alt+5 |
MPI Diagnostics (DEADLOCK ANALYZER and NETWORK LOG) and Package Manager (HpcConsoleWidget, lazy-loaded on first tab activation). |
Terminal |
Alt+6 |
Terminal (QTermWidget xterm-256color truecolor Linux PTY, lazy-started on first activation). |
Docs |
Alt+7 |
Reference Manual (DOCSETS SQLite3 Zeal viewer + MAN PAGES man -Thtml viewer, lazy-indexed on first activation or F1). |
-
Persistent Command History (
Up/Down): Deduplicated command history persists across sessions in~/.config/gridlock/gdb_history. PressingUp/Downwalks history while preserving any unsent draft line when returning to the bottom. -
Incremental Reverse Search (
Ctrl+R): Opens an inline(reverse-i-search)bar filtering command history live as you type; pressCtrl+Rrepeatedly to cycle older matches,Tab/Right/Enterto accept, orEsc/Ctrl+Gto cancel and restore your original input. -
Live
completeTab Completion (Tab): Queries GDB'scomplete <prefix>viaGdbRankCoordinator(with local fallback across common commands when offline) and opens an interactive completion popup (Up/Downto select,Enterto insert,Escto close).
See Keyboard Shortcuts and Quick Reference for the complete categorized tables covering execution (F5, F10, F11, Ctrl+F10, Ctrl+Shift+F10), palettes (Ctrl+Shift+P, Ctrl+P, >, @, #), floating tools (Ctrl+Alt+P/C/G/S/K), perspectives (Alt+1..3, Alt+4..7), editor/LSP (Ctrl+Space, F12, F9), GDB console readline (Up/Down, Ctrl+R, Tab), and disassembly/CFG (Space, X, Alt+P, Home).