Repository navigation
Memory Reverse Engineering and Profiling
This guide covers process memory inspection and cross-rank byte diffing (MemView), virtual memory and heap-caller profiling (MemoryProfilerWidget), persistent pointer and struct graph visualization (PointerGraphDialog), live 1D/2D array plotting (ArrayPlotDialog), floating base/bit conversion (ProgrammerCalculatorDialog), ELF64 disassembly, 2D Control Flow Graphs, decompilation (DisassemblyView), and CPU register telemetry (RegisterView).
Open the Memory View tab in the bottom dock (Alt+4 -> Memory View). Ensure HEX DUMP is selected in the top bar.
-
Source Status Badge: Shows
IDLE (NO BINARY),STATIC ELF (READ-ONLY)(reading virtual sections directly from disk viaElfBinaryInspector),LIVE RANK N (PID P), orREMOTE RANK N (...). -
Fast
process_vm_readvPath (NativeMemoryReader+MemoryBoundsValidator):- For local live processes, GridLock reads target memory directly via Linux
process_vm_readv, enforcingMIN_VALID_BASE_ADDRESS >= 0x1000, natural element/stride alignment, 64-bit overflow guards, and a64 MiBper-transfer cap before falling back to GDB/MI or DAP memory reads whenptrace_scoperestricts cross-process reads or when connected to a remotegdbserver/qemu-usertarget.
- For local live processes, GridLock reads target memory directly via Linux
-
Seeking to an Address or Expression:
- Enter a hex address (
0x404040), decimal literal (0d16384), symbol/pointer variable (send_buf.data()), or register ($rsp) inAddr:, setBytes:(1..4096, default256), and clickRead(or pressEnter). - Left-clicking any
0x...pointer value in theVariablesdock automatically reads 256 bytes from that address intoMemView.
- Enter a hex address (
-
Step Mutation Highlighting: Bytes that changed since the previous debugger stop are highlighted in bold red (
#f44747) across the 16-byte-per-row hex and ASCII columns. -
Standalone Pop-Out Window: Click
⤢ POP OUTin the top-right corner ofMemViewto detach the entire memory inspector (1280x820) onto a second monitor; click⤡ DOCK(or close the window) to snap it back into the bottom dock.
- Pause at least two MPI ranks at a synchronization point (for example before
MPI_AllreduceorMPI_Barrier). - Enter the buffer address or expression (such as
&packetordomain.data()) inAddr:and setBytes:. - Set
Base:(for example0) andTarget:(for example1or2), then clickDiff Ranks. -
MemViewcomparesBaseagainstTargetbyte-by-byte (usingMemoryDiffer::compareMemoryoverprocess_vm_readvwhen addresses match, or per-rank debugger evaluation when ASLR/stack addresses differ). Every differing byte is highlighted in bold red (#f44747); hover over any red byte to see a tooltip showingBaseline: 0x.. | Target: 0x...
- Read the desired buffer into
MemView(Addr:andBytes:). - Select the element type in
Type::Int32(int32_t),Float(float), orDouble(double). - Click
Exportand choose an output path:-
CSV Files (*.csv): Unpacks the buffer as a typed row-major CSV slice (std::setprecision(9)) viaMemoryExporter::exportToCsv. -
Binary Files (*.bin): Writes the exact raw byte slice verbatim viaMemoryExporter::exportToBinary.
-
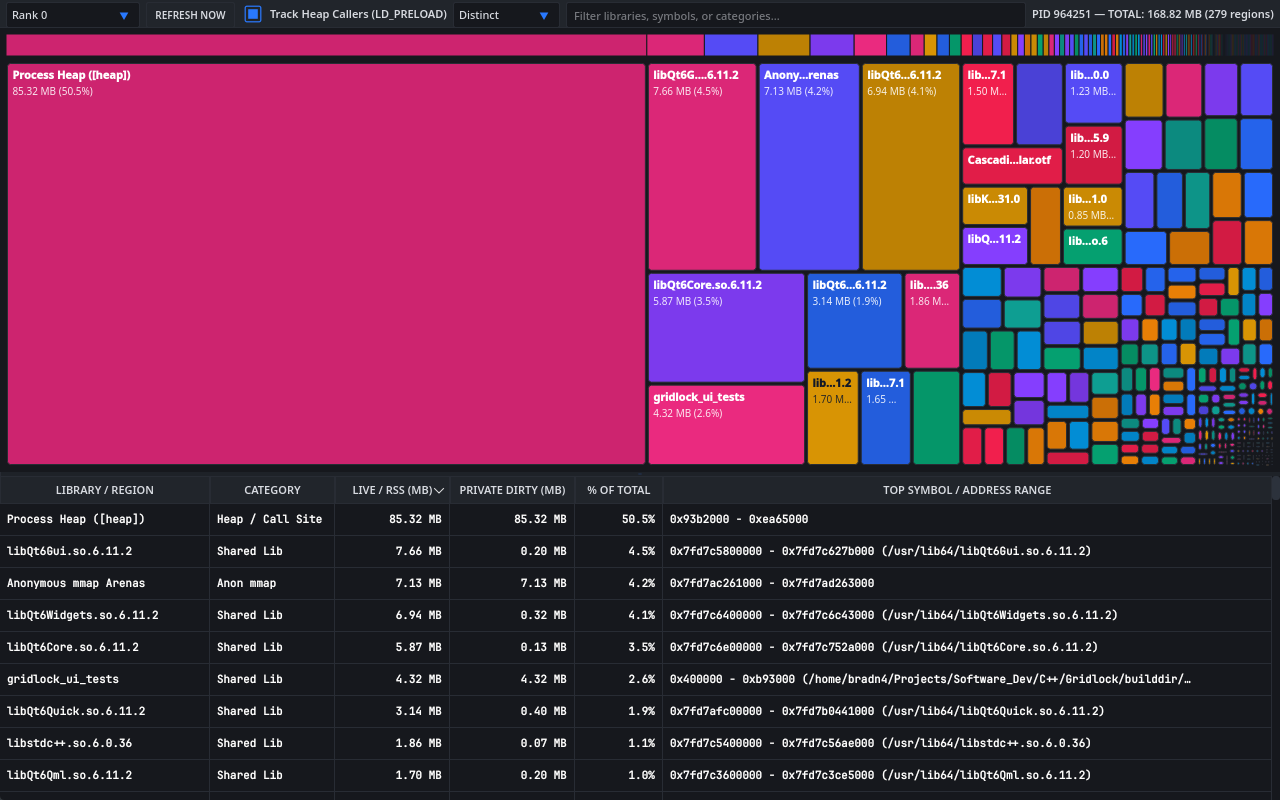
Inside Memory View, click LIBRARY MEMORY MAP in the top bar to switch from the hex dump to the virtual memory profiler.
-
/proc/<pid>/smapsVMA Categorization: ParsesSize,Rss, andPrivate_Dirtyacross all mapped regions of the selected rank (Rank 0 .. Rank N-1orAll Ranks Overview) and classifies each region into five categories:-
Shared Lib: Loaded.solibraries (libmpi.so,libc.so,libstdc++.so, CUDA/ROCm runtimes). -
Heap / Call Site: Process[heap]and attributed dynamic allocations. -
Anon mmap: Anonymousrw-pmappings outside[heap]. -
MPI /dev/shm: Shared-memory transport segments (/dev/shm/*, POSIX shm, XPMEM/Vader buffers). -
Stack: Thread[stack]mappings.
-
-
LD_PRELOADHeap Caller Attribution (Track Heap Callers (LD_PRELOAD)):- Checked by default. When
gccorccis available, GridLock compiles a small interposition library (/tmp/gridlock_memtrack_v2_<uid>.so) and injects it viaLD_PRELOADinto GDB-spawned ranks. - Allocations
>= 4 KBviamalloc,calloc,realloc, andfreeunwind pastlibstdc++operator newframes using_Unwind_Backtrace,dladdr, andaddr2line, writing live call-site totals to/tmp/gridlock_mem_<pid>.tsvand deducting attributed heap bytes from the raw[heap]bucket so totals are never double-counted.
- Checked by default. When
-
Proportional Bar & 2D Treemap (
MemoryTreemapCanvas): Hover over any tile to inspectCategory,Live / RSS,Private Dirty, and symbol/range details. Single-click a tile to select its row in the breakdown table; double-click any tile or table row to jump straight back toHEX DUMPat that mapping's start address. -
Sortable Breakdown Table: 6 columns (
Library / Region,Category,Live / RSS (MB),Private Dirty (MB),% of Total,Top Symbol / Address Range) with numeric MB/% sorting and instant substring filtering (Filter libraries, symbols, or categories...). -
5 Color Schemes (synced with
Edit -> Preferences -> Appearance -> Memory Map Color Scheme):-
Distinct(category and library distinct hues, default) -
Viridis(perceptually uniform sequential green-blue-yellow) -
Plasma(perceptually uniform purple-orange-yellow) -
Ocean(cool-to-warm blue-cyan) -
High-Contrast(Okabe-Ito colorblind-safe palette)
-
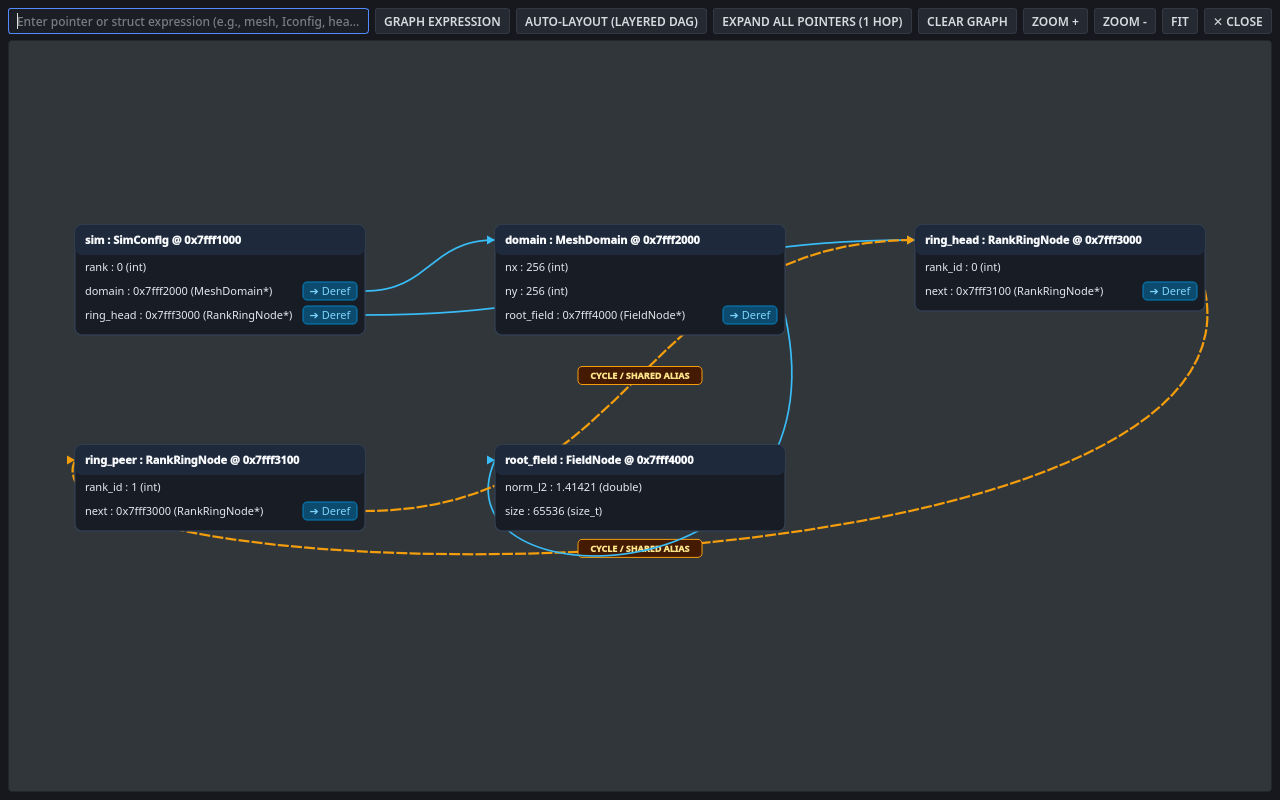
Open Tools -> Pointer & Struct Graph Visualizer... from the menu bar, or right-click any struct/pointer variable in the Variables dock and select Visualize in Pointer / Struct Graph....
-
Graph and Pin Root Expressions: Type a C/C++ struct or pointer variable (such as
sim,pkt,cfg, orhead) into the top input box and clickGraph Expression(or pressEnter). -
Persistent Auto-Updating Roots & Mutation Diffs (
v0.8.7):- Enable
Auto-Refresh on Stop(checked by default) to keep pinned root expressions live across every step or breakpoint stop without re-typing them. - On each stop,
PointerGraphDialogre-evaluates every pinned root, diffs every scalar and pointer field against its previous-stop value, and highlights changed fields with an inline"old -> new"mutation badge. - Click
Refresh Nowat any time to re-query all pinned roots on demand.
- Enable
-
Interactive Dereferencing (
➔ Deref):- Each card displays
expression : Type @ 0xAddressand lists its member fields (name : value (type)). - Non-null pointer and composite fields show a clickable
➔ Derefpill badge (null pointers display a mutednullptrbadge and are guarded against dereferencing). - Click
➔ Deref(or double-click a field row) to expand that child node live viaIBackendCoordinator::requestVariableChildren, or clickExpand All Pointers (1 Hop)on the toolbar to expand every visible frontier pointer by one level.
- Each card displays
-
Cycle and Shared-Alias Detection:
- Cards are deduplicated by normalized virtual address (
0x...), so multiple pointers referencing the same heap object converge onto the same card. - Forward tree edges render as solid cyan (
#38bdf8) cubic Bezier curves. Back-edges (linked-list rings, parent pointers) and multi-parent shared aliases render as dashed amber (#f59e0b) curves labeledCYCLE / SHARED ALIAS.
- Cards are deduplicated by normalized virtual address (
-
Layout and Navigation: Drag cards freely on the canvas, pan with mouse drag, click
Auto-Layout (Layered DAG)to arrange nodes left-to-right by depth, useZoom +,Zoom -,Fit,Clear Graph, and✕ CLOSE.
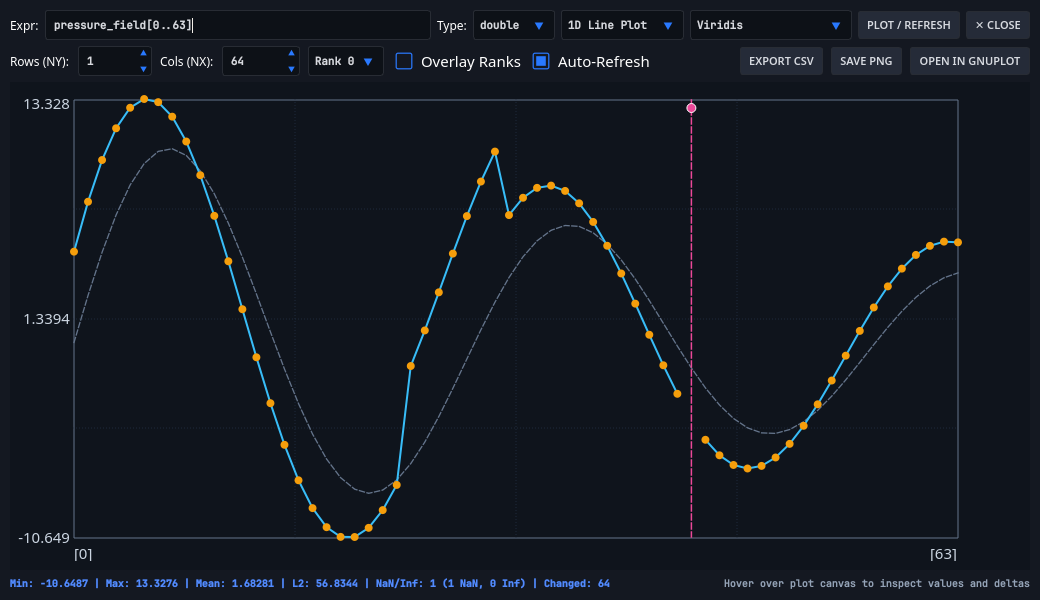
Open Tools -> Array & Field Plotter... (Ctrl+Alt+G) or right-click an array/pointer expression in Variables to plot live numerical arrays and 2D matrices directly from inferior memory.
-
Data Types & Plot Modes:
- Supports
double,float,int32_t,int64_t, anduint8_tslices read viaIBackendCoordinator::readMemory(process_vm_readv/ GDB / DAP). - Switch between
1D Line Plot,1D Bar / Stem, and2D Heatmap(Rows x Colsdimensions) with 4 selectable colormaps:Viridis,Plasma,Diverging Cool-Warm, andGrayscale.
- Supports
-
Numerical Telemetry & Anomaly Flagging:
- Computes live
Min,Max,Mean,L2 Norm, and IEEE-754NaN/Infcounts on every refresh, flagging non-finite samples visually on the plot canvas. - When
Auto-Refreshis enabled, each step retains the previous stop's 1D curve as a translucent ghost overlay and reports how many elements mutated since the previous stop.
- Computes live
-
Export & External Plotting: Click
Export CSV,Save PNG, orOpen in gnuplotto save slices or hand off to an externalgnuplotwindow.
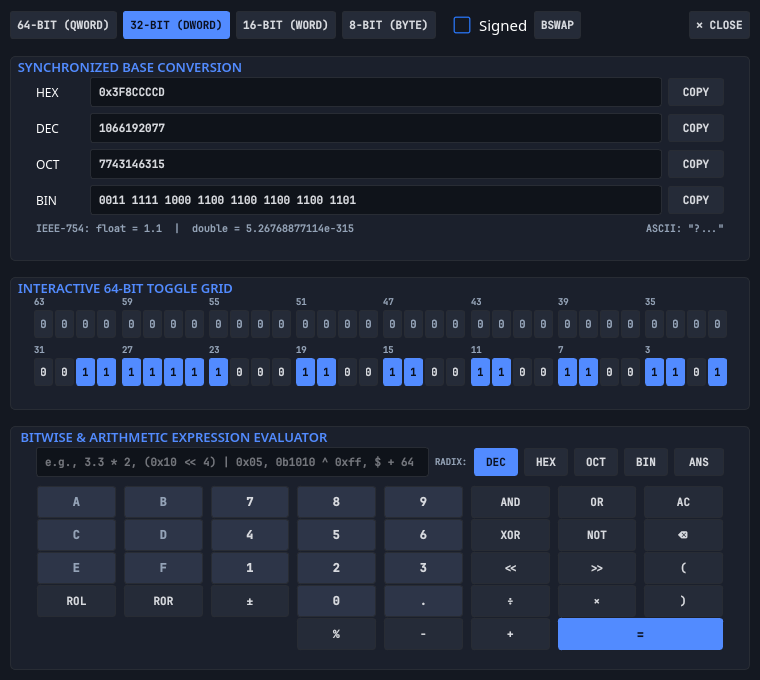
Open Tools -> Programmer's Calculator... (Ctrl+Alt+C), launch > Programmer's Calculator from the Command Palette, or right-click any value/address/selection in SourceCodeView, Variables, Registers, Memory View, or DisassemblyView and select Open in Programmer's Calculator.
-
Synchronized Multi-Base Readouts: Edit
HEX,DEC(signed or unsigned),OCT, orBINand watch all four bases update immediately, alongside live IEEE-754float/doublehex bit-pattern decoding and ASCII byte readout. -
Word Width, Endianness & Bit Grid:
- Switch word width between
8-bit,16-bit,32-bit, and64-bit(with automatic masking and default width/signedness configurable inProject SettingsandPreferences). - Click
BSWAPto reverse byte order for inspecting little-endian vs. big-endian network/MPI payloads. - Click any bit (
63..0) in the 64-bit interactive toggle grid to flip individual flag/mask bits in place.
- Switch word width between
-
Radix-Aware Keypad & Expression Evaluator: Includes a full clickable
0-9/A-F/ bitwise (AND,OR,XOR,NOT,<<,>>) / arithmetic / floating-point keypad plus a free-form C expression bar (such as(0x10 << 4) | 0x05or3.3 * 2).
Press Alt+2 for the full-width REVERSE perspective, or inspect assembly alongside C/C++ code in the CODE perspective (Alt+1).
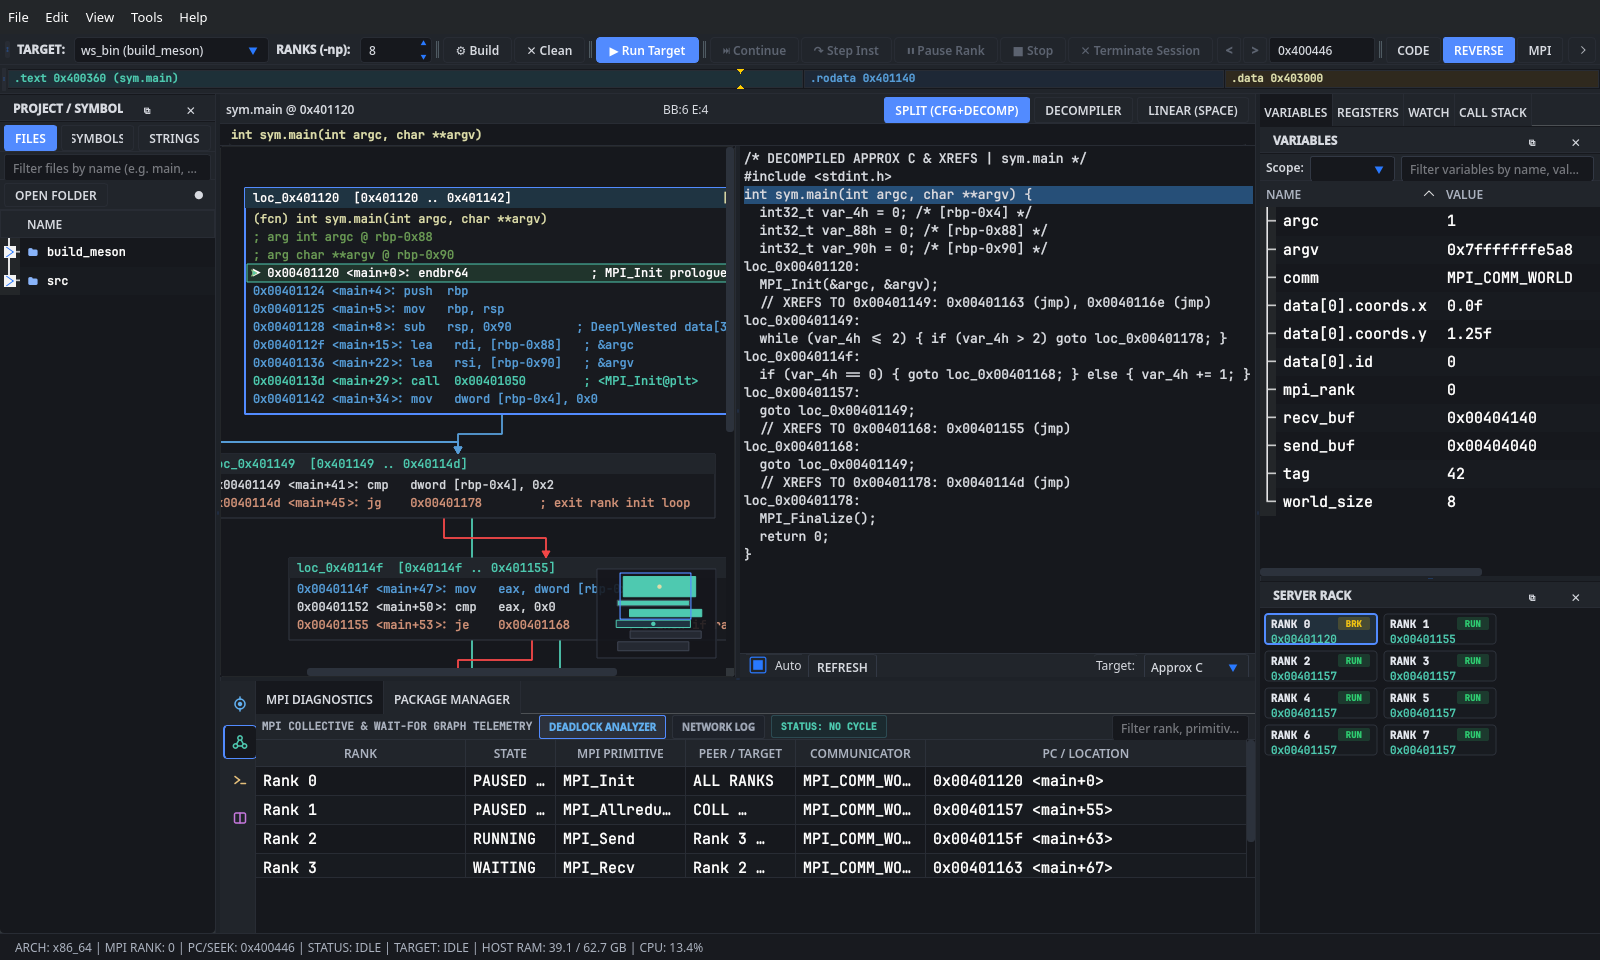
-
CFG (Space)/Linear (Space): PressSpace(or click the top-right toggle button) to switch between:-
Linear Assembly: Intel-syntax disassembly (
objdump -d -l -C -M intel) with a46pxleftBranchFlowGutterdrawing multi-lane forward/backward conditional and unconditional jump arcs, emerald▶PC chevrons, and amber◆bookmark diamonds. -
2D Control Flow Graph (
CfgGraphView): Basic-block cards connected by orthogonal true (green), false (red), and unconditional (blue) edges, annotated with live MPI rank badges ([R0],[R0-R3 (4)]),[DEADLOCK]alerts, and a120x90bottom-right minimap. Pan with middle-drag,Space+left-drag, orLeft/Rightarrow keys; pressHometo snap back to the active block.
-
Linear Assembly: Intel-syntax disassembly (
-
Toolbar Stepping (
stepi/nexti): Step into (-exec-step-instruction) or step over (-exec-next-instruction,Ctrl+Shift+F10) individual machine instructions directly from the disassembly header bar. -
DECOMPILERandSPLIT (CFG+DECOMP):- Generates structured
Approx C,C++ / MPI, orPseudocode(selectable in the footerTarget:dropdown, withAutorefresh and manualRefresh). - Clicking any line in the decompiler or
SourceCodeViewjumps the linear disassembly, CFG, andMemViewto the corresponding DWARF instruction address; selecting any identifier token (2..32chars) highlights every occurrence across assembly, CFG blocks, and decompiled output. - By default, the decompiler pane hides automatically when
SourceCodeViewalready shows matching DWARF source; enableShow Pseudo-C Decompiler when Source Editor is visibleinPreferences -> Debuggerto keep all three panes open together.
- Generates structured
-
Cross-Reference Inspector (
XrefInspectorDialog): PressX(or right-click ->Inspect Cross-References (X)) to inspect incoming callers/branches (XREFS TO) and outgoingCALL,CJMP,JMP, and RIP-relativeDATAreferences (XREFS FROM) with a live filter bar and assembly preview pane. Double-click any row to jump to that address. -
Right-Click Context Menu: Provides
Run to Instruction Address,Jump / Set PC to Address,Open Address in Programmer's Calculator,Seek in Memory View,Inspect Cross-References (X),Lookup in Reference Manual (F1),Toggle Bookmark(auto-synced with source breakpoints), andPatch Instruction(nop). -
Instruction & ELF64 Patching: Press
Alt+PinDisassemblyViewto assemble/patch an instruction at the current address (splicing; [PATCHED]into the listing and updatingElfBinaryInspector's in-memory section image viawriteVirtualMemory, which can be written out as an executable ELF64 binary viaElfBinaryInspector::savePatchedBinary).
-
RegistersDock (RegisterView):- Pins
rip,rsp, andrbpat the top, color-coding instruction pointers, stack pointers, andeflags. - Changed register values highlight in bold red on each step.
- The search bar (
Filter registers by name or hex/dec value...) matches register names, hex strings (401125), and converted unsigned decimal values. Double-clicking any register seeksDisassemblyViewandMemViewto its pointer value; right-clicking sends its value toProgrammer's Calculator.
- Pins
-
Bottom Status Bar Telemetry (
ElfBinaryInspector):- Displays
ARCH, focusedMPI RANK, activePC/SEEK, sessionSTATUS, per-rankSTACK(active frame deltastackTop - $rspplus mapped[stack]RSS) andHEAP([heap]RSS from/proc/<pid>/smaps), plus hostRAM(/proc/meminfo) and deltaCPU %(/proc/stat), configurable asGB,%, orBothinPreferences -> Behavior.
- Displays