Repository navigation
Quickstart and Workflows
This guide covers the four main debugging workflows in GridLock (v0.8.7):
- Launching a local multi-rank MPI program or standalone ELF64 binary.
- Attaching to a running Linux process or live
mpirun/ SLURM MPI job (Ctrl+Alt+P). - Connecting to
qemu-user -gcross-architecture stubs andgdbserverinstances (target remote/extended-remote). - Importing
#SBATCHcluster scripts and configuring MPI hostfiles and SSH settings.
-
Choose a Target (
TARGET:):- Select one of the 7 bundled MPI showcase programs (
inspection_demo (MPI)throughsimd_struct_watch (MPI)), pick a discovered workspace target afterFile -> Open Workspace..., or chooseOpen ELF / Binary...to load any C/C++ source file or ELF64 executable.
- Select one of the 7 bundled MPI showcase programs (
-
Set the Rank Count (
RANKS (-np):):- Set the spinbox (
1..256, default8). While idle,ServerRackViewupdates immediately to show that number ofIDLErank cards.
- Set the spinbox (
-
Select a Debugger Engine (Optional):
- Open
Edit -> Preferences(Ctrl+,) ->Debugger->Debugger Engineto pickGNU GDB (gdb)(default, usesGdbRankCoordinator),LLVM LLDB-DAP (lldb-dap)(usesDapCoordinator),NVIDIA CUDA-GDB (cuda-gdb), orAMD ROCm GDB (rocgdb).
- Open
-
Set Breakpoints (Optional):
- Left-click any line in the
SourceCodeViewgutter to toggle an all-ranks breakpoint, or right-click a line in the gutter to set a rank-filtered condition, hit ignore count, or non-suspending logpoint.
- Left-click any line in the
-
Start Execution (
▶ Run TargetorAlt+R):- If a standalone
.cppor.csource file is selected and its binary is missing or older than the source, GridLock compiles it withmpicxx -g -O0(ormpicc -g -O0). -
GdbRankCoordinatorcreates per-rank POSIX named pipes (/tmp/gridlock_mi_<pid>_<seq>/r<i>.inandr<i>.out) and spawns a single MPMDmpirunjob running onegdb --interpreter=mi3instance per rank. Ifmpirun/mpiexecis not installed on the host, it falls back to launching Rank 0 directly undergdb. - OpenMP thread counts are auto-tuned to
OMP_NUM_THREADS = max(1, idealThreadCount / rankCount)withOMP_WAIT_POLICY=PASSIVEunless overridden in your environment orMPI Args.
- If a standalone
-
Step, Inspect, and Reverse:
- Click any card in
SERVER RACK(RANK 0 .. RANK N-1) to focus that rank acrossVariables,Registers,Call Stack,DisassemblyView, andMemory View. - Use
⏭ Continue(F5),F10(Step Over),F11(Step Into),↷ Step Inst(single machine instruction),⏸ Pause Rank, and■ Stop/✕ Terminate Session. - To step backward in GDB sessions, toggle
⏺ Recordon the toolbar (enablesrecord fullwithscheduler-locking onand a 200,000-instruction ring buffer), then click↶ Step Back(-exec-next --reverse) or⏮ Rev Continue(-exec-continue --reverse).
- Click any card in
-
File -> New Project...(ProjectWizard): Two-page wizard that configures the workspace directory, target binary, program arguments, rank count (-np), and OpenMPI topology flags (--bind-to core,--map-by node,--use-hwthread-cpus,--oversubscribe,--report-bindings,--display-map,--tag-output,--timestamp-output), saves.gridlock/settings.toml, and launches the session. -
File -> Project Settings(ProjectSettingsDialog): EditsTarget Binary,Program Arguments,Working Directory,MPI Ranks (-np)(1..256), and extraMPI Argsfor the current workspace.
Open File -> Attach to Process... (or press Ctrl+Alt+P) and stay on the first tab: Local Processes (/proc).
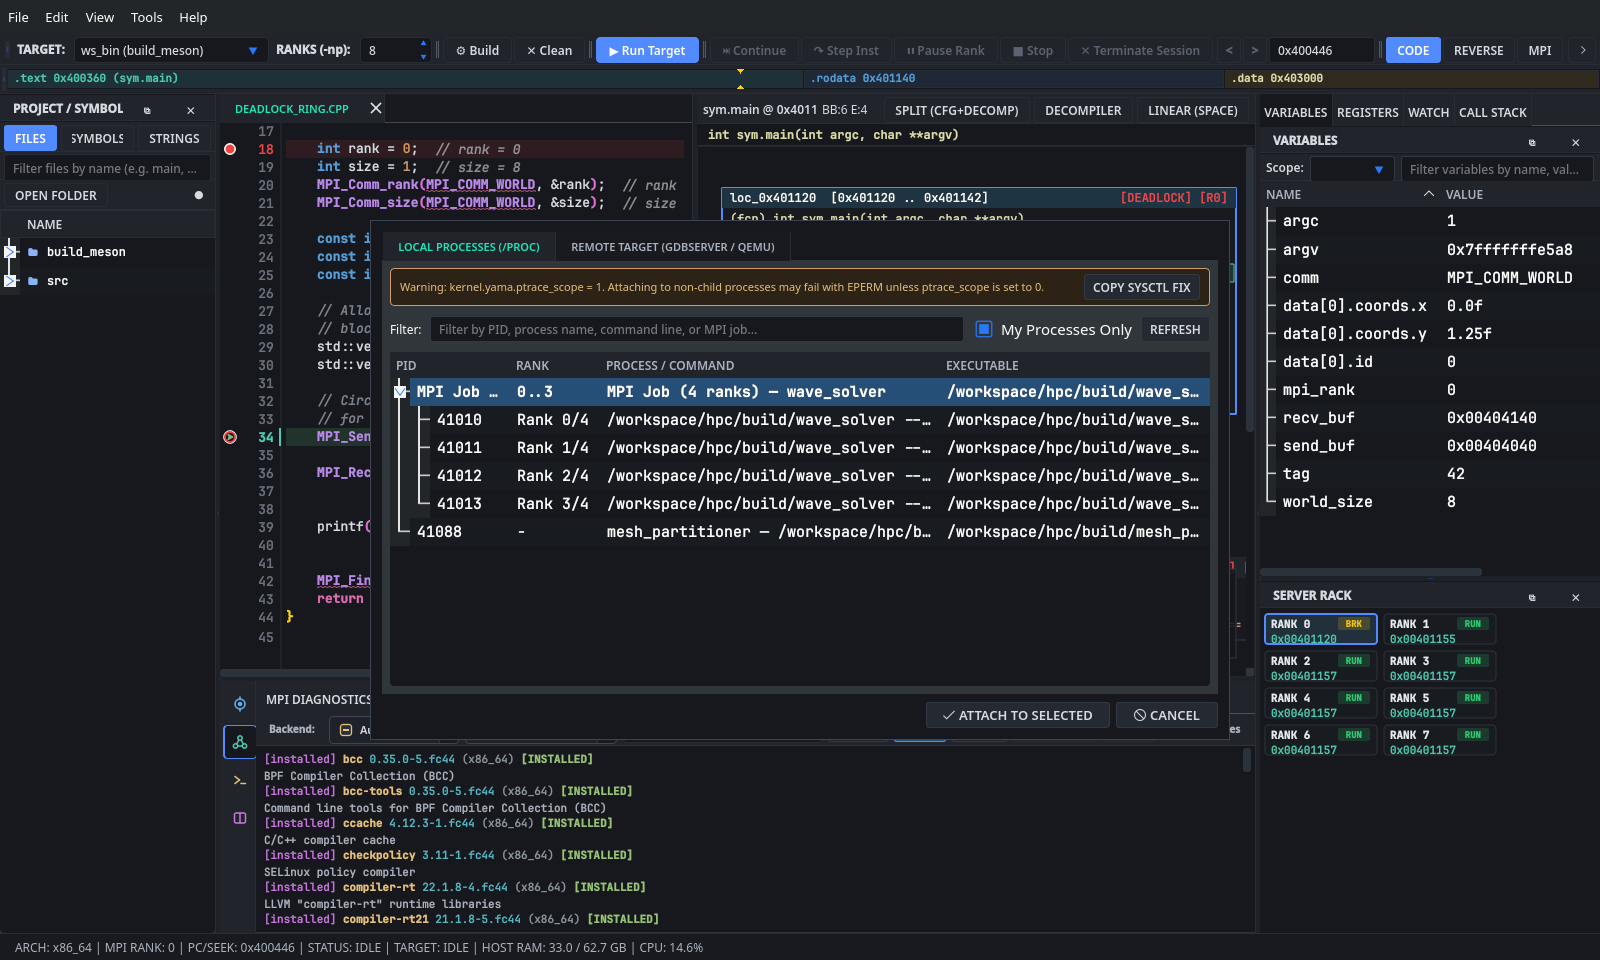
ProcessScanner::scanRunningProcesses reads /proc/<pid>/{comm,status,cmdline,exe,environ} (filtering to your UID by default when My Processes Only is checked) and checks MPI/scheduler environment variables in priority order:
-
World Rank:
OMPI_COMM_WORLD_RANK,PMI_RANK,PMIX_RANK,SLURM_PROCID,MV2_COMM_WORLD_RANK. -
World Size:
OMPI_COMM_WORLD_SIZE,PMI_SIZE,SLURM_NTASKS,MV2_COMM_WORLD_SIZE. -
Job Grouping Tag:
OMPI_MCA_ess_base_jobid,PMIX_NAMESPACE,PMI_JOBID,SLURM_STEP_ID,SLURM_JOB_ID, or parent launcherppid_<PPID>.
All sibling ranks belonging to the same job appear under an expandable MPI Job (N ranks) header sorted by world rank (Rank 0/N .. Rank N-1/N). Non-MPI processes appear below, sorted newest-PID-first.
- Start your target in an external terminal (for example,
mpirun -np 4 ./wave_solveror a hung MPI job). - Press
Ctrl+Alt+Pin GridLock. - Check the top of the dialog for the
kernel.yama.ptrace_scopebanner:- On many Linux distributions,
/proc/sys/kernel/yama/ptrace_scopedefaults to1, which blocks non-parentptraceattaches withEPERM. - Click
Copy sysctl Fixand run the copied command in a root-capable shell:echo 0 | sudo tee /proc/sys/kernel/yama/ptrace_scope
- Alternatively, grant
CAP_SYS_PTRACEdirectly to your localgdbbinary (sudo setcap cap_sys_ptrace=eip /usr/bin/gdb) or setkernel.yama.ptrace_scope = 0in/etc/sysctl.d/10-ptrace.conf.
- On many Linux distributions,
- Filter the list using the
Filter:box (matches PID, rank label, binary name, command line, or MPI job tag) and clickRefreshif you started the process after opening the dialog. - Select what to attach:
-
Entire MPI Job: Click the top-level
MPI Job (N ranks)row.AttachProcessDialog::selectedProcesses()expands all child rank PIDs in world-rank order. -
Subset or Single Process:
Ctrl+Click/Shift+Clickspecific rank rows or select any standalone PID row.
-
Entire MPI Job: Click the top-level
- Click
Attach to Selected(or double-click the row):-
GdbRankCoordinator::attachToProcessesresolves/proc/<pid>/exeintoElfBinaryInspector, spawns onegdb --interpreter=mi3process per selected rank, issues-target-attach <pid>, syncs active breakpoints, and populatesServerRackView. - When you later click
■ Stopor✕ Terminate Session, attached GDB sessions issue-target-detachbefore-gdb-exitso the external process is not killed withSIGKILL.
-
Open File -> Attach to Process... (Ctrl+Alt+P) and switch to Tab 2: Remote Target (gdbserver / QEMU).
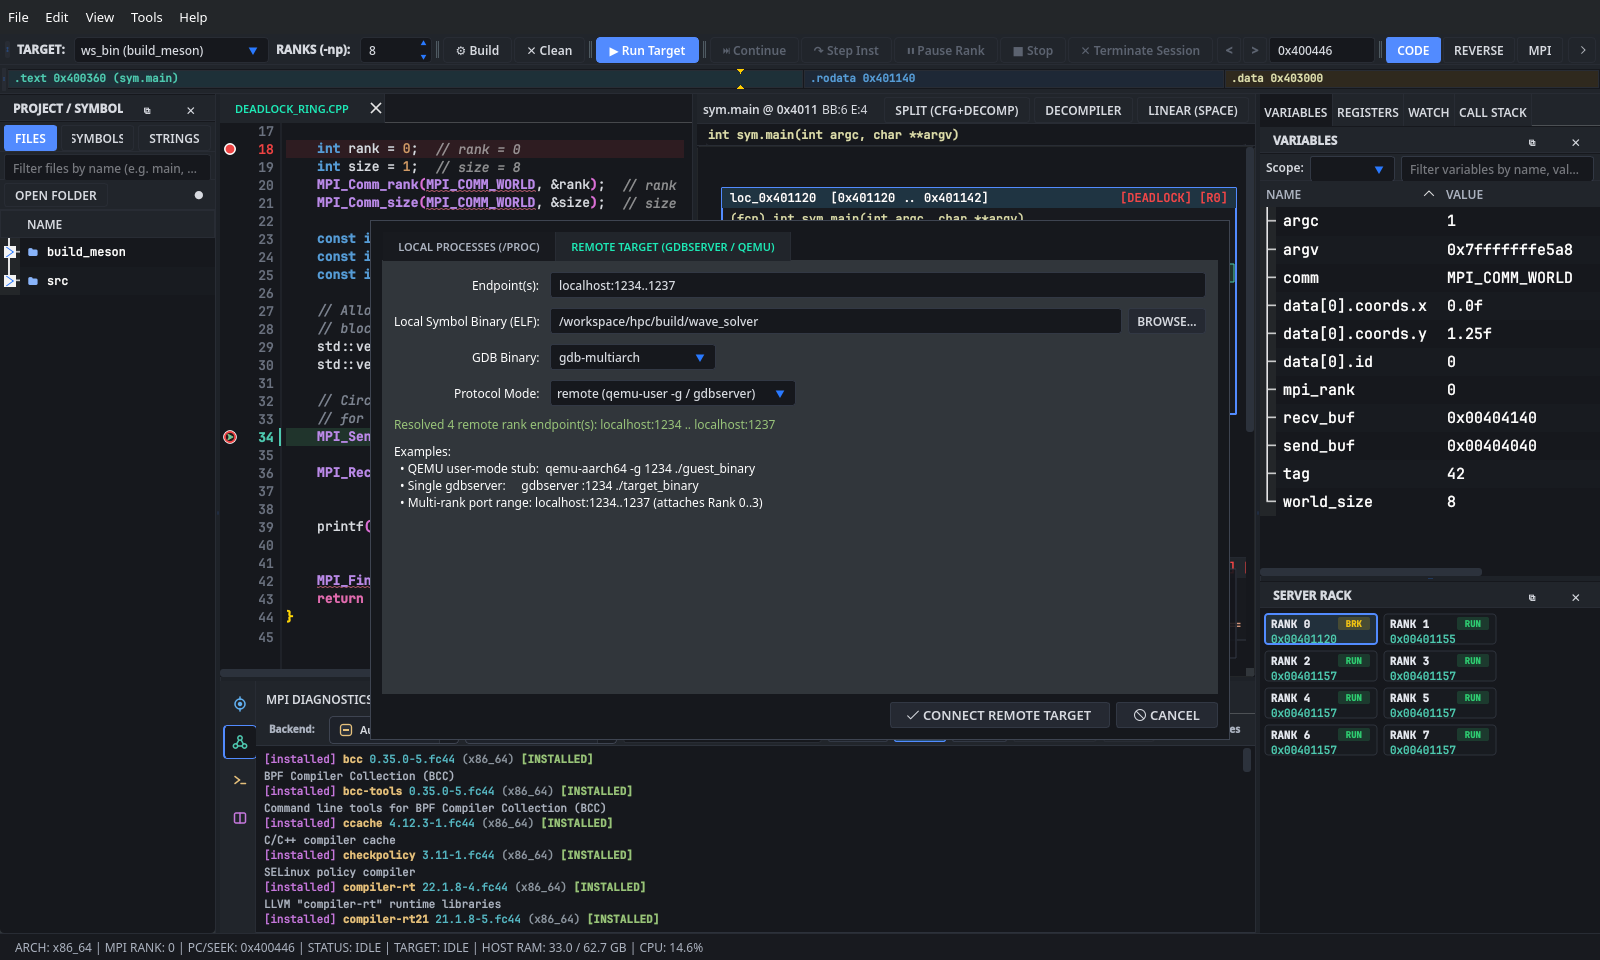
The Endpoint(s): field accepts three forms (ports must satisfy 1 <= start <= end <= 65535, up to 1025 ports per range):
-
Single Endpoint:
localhost:1234,:1234(normalizes tolocalhost:1234), or192.168.122.50:2222-> attaches asRank 0. -
Contiguous Port Range:
localhost:1234..1237orlocalhost:1234-1237-> expands into 4 endpoints assigned toRank 0 .. Rank 3. -
Comma-Separated Endpoints:
node0:1234, node1:1234, node2:1234, node3:1234-> assigns eachhost:porttoRank 0 .. Rank N-1in order.
-
Start the Remote Stub(s):
-
QEMU User-Mode Cross-Architecture Stub (
AArch64/RISC-V):qemu-aarch64 -g 1234 ./build-arm64/solver # or for RISC-V: qemu-riscv64 -g 1234 ./build-rv64/solver -
Single
gdbserver(Local, Container, or QEMU System VM):gdbserver :1234 ./solver --mesh wing.msh
-
Multi-Rank
mpirun+ Per-RankgdbserverPort Range (1234..1237):mpirun -np 4 bash -c 'gdbserver :$((1234 + OMPI_COMM_WORLD_RANK)) ./wave_solver'
-
QEMU User-Mode Cross-Architecture Stub (
-
Configure Tab 2 in
AttachProcessDialog:-
Endpoint(s):: Enterlocalhost:1234(single target) orlocalhost:1234..1237(4-rank job). Verify the green validation line readsResolved N remote rank endpoint(s): .... -
Local Symbol Binary (ELF):: ClickBrowse...and select the unstripped ELF binary on your workstation.GdbRankCoordinatorloads DWARF symbols and disassembly locally viaElfBinaryInspectorand sends-file-exec-and-symbols "<path>"to GDB before connecting. -
GDB Binary:: Pickgdb(native x86_64),gdb-multiarch(recommended for cross-architecture QEMU targets),aarch64-linux-gnu-gdb,riscv64-linux-gnu-gdb, or type a custom path. -
Protocol Mode::-
remote (qemu-user -g / gdbserver): Sends-target-select remote <host:port>. Required forqemu-user -gstubs and standard single-processgdbserver. -
extended-remote (gdbserver --multi): Sends-target-select extended-remote <host:port>for persistentgdbserver --multilisteners.
-
-
- Click
Connect Remote Targetto attach all resolved ranks and inspect disassembly, registers, stack frames, and memory.
Open Edit -> Preferences (Ctrl+,) to configure MPI hostfiles, environment variables, SSH credentials, and SLURM batch scripts.

-
MPI Hosts File: Passed as--hostfile <path>byGdbRankCoordinatorwhen launchingmpirun. -
MPI Env Vars: OneKEY=VALUEper line, injected into the spawned MPI process environment. -
Strict Node Affinity: Appends--map-by nodetompirun.
- Click
Load & Auto-Detect .sbatch Script...(or paste an existing batch script into theScript Templateeditor). -
PreferencesDialog::parseSlurmBatchScriptextractsmodule loadstatements, the launcher (srun,srun --mpi=pmix,mpirun,mpiexec), and 16 SLURM flags (--job-name/-J,--account/-A,--partition/-p,--qos/-q,--time/-t,--mem/--mem-per-cpu,--nodes/-N,--ntasks-per-node/--ntasks/-n,--cpus-per-task,--constraint/-C,--gres=gpu:.../--gpus,--output/-o,--mail-type,--mail-user). - Edit any form field and click
Sync Fields -> Script Previewto regenerate a clean#SBATCHscript using{FILE}as the binary placeholder. -
Scope Note on
File -> Submit SLURM Job: SelectingFile -> Submit SLURM Jobsubstitutes{FILE}in yourScript Templateand submits it to the built-inMockHpcBackendpreview log in thePackage Manager(>_ Raw) view. Live SSH queue submission to remote SLURM head nodes is not performed directly by GridLock; copy the generated.sbatchscript to your cluster or tunnel remotegdbserverports over SSH (ssh -L 1234:compute01:1234 login.cluster.edu) and attach viaRemote Target (gdbserver / QEMU).