Microbiome Analysis
Upon completion of the main NanoMetaPipe, Kraken/bracken containing identified taxonomic features have been generated. These would have also been used to generate a visual representation of the taxa in the form of Krona HTML files.
However further investigations can be carried out using dedicated R statistical packages designed for metagenomic microbial analyses. In the MicrobiomeAnalysis.R script, two such packages mia and phyloseq are used to carry out some relatively basic analyses.
IMPORTANT: The script MUST be run in a GUI environment like Rstudio!!!!
flowchart TD
a[Input arguments]
b[Load in biom file]
c[Calculate relative abundance]
c1[[All_Dataset_Abundance.png]]
c2[[All_Dataset_Abundance_Location.png]]
c3[[All_Classification.csv]]
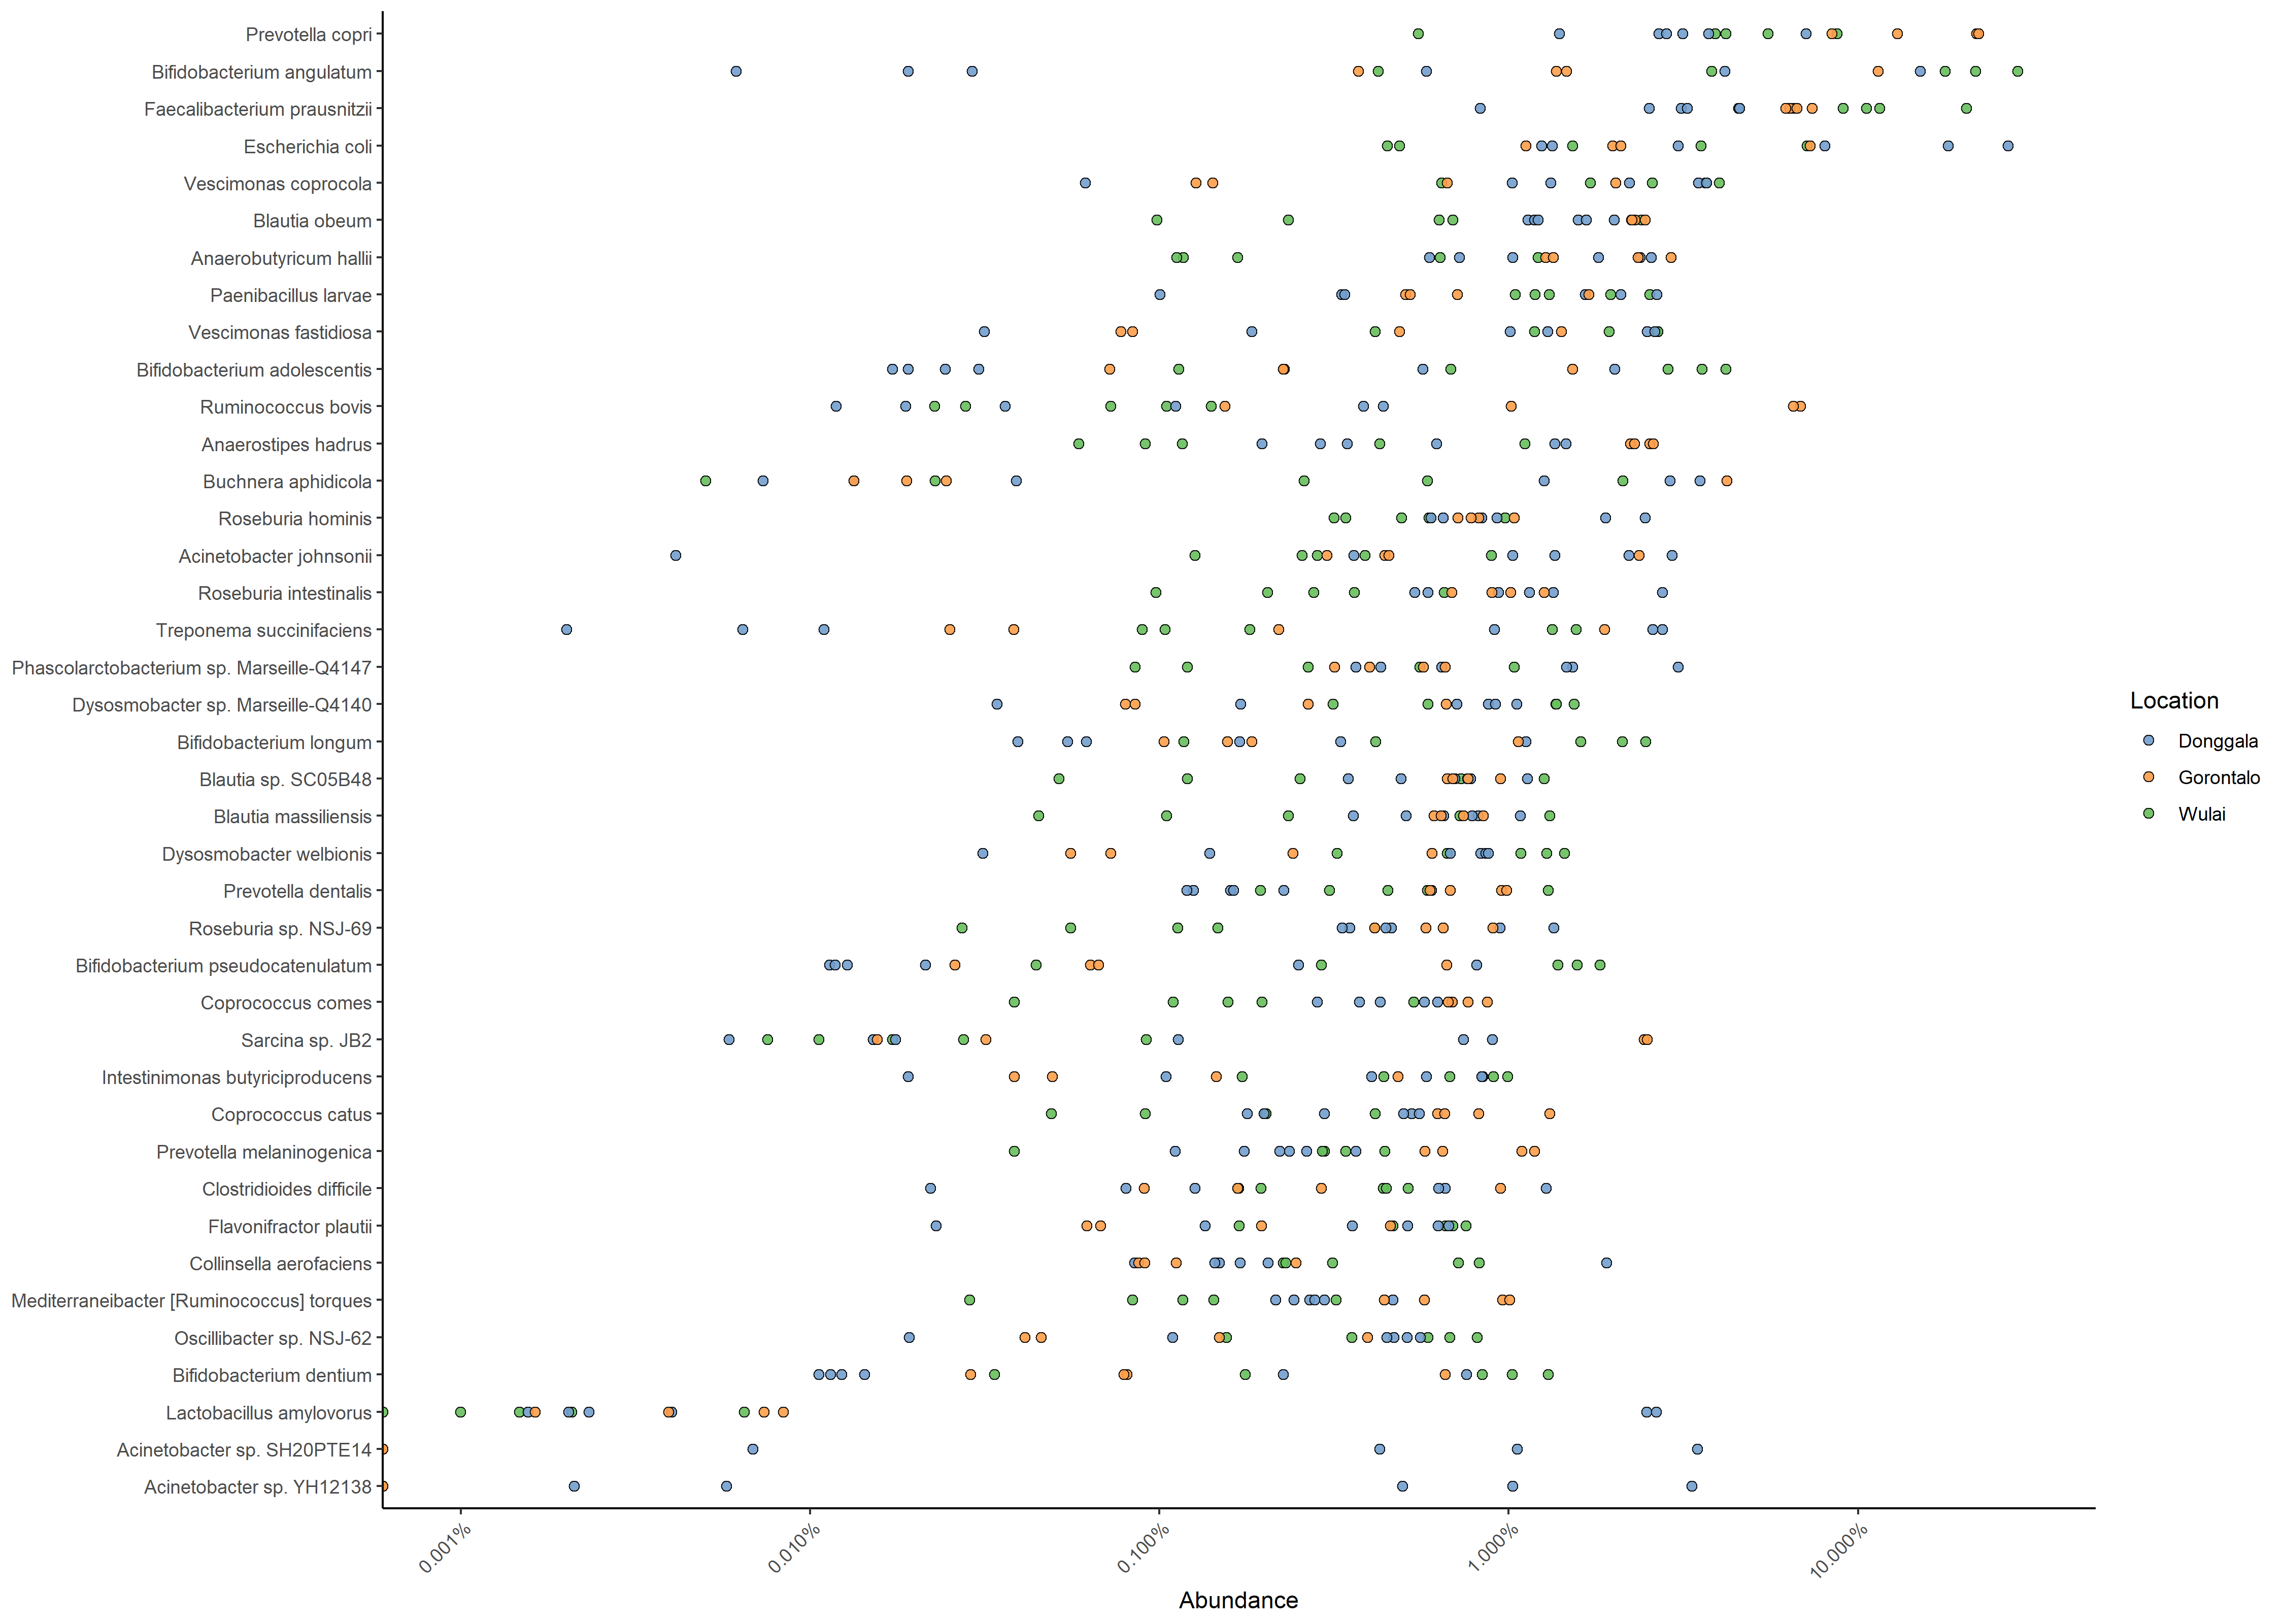
c4[[Top40_All_Dataset_Abundance.png]]
c5[[Top40_All_Dataset_Abundance_Location.png]]
d[Construct taxonomic tree]
e[Root tree with random outgroup]
f[Calculate simple metrics]
f1[[Reads_per_Sample_per_taxa.csv]]
f2[[Reads_per_taxa.csv]]
f3[[KingdomFeatureCount.csv]]
f4[[PhylumFeatureCount.csv]]
f5[[Taxonomy_AbsoluteAbundance.png]]
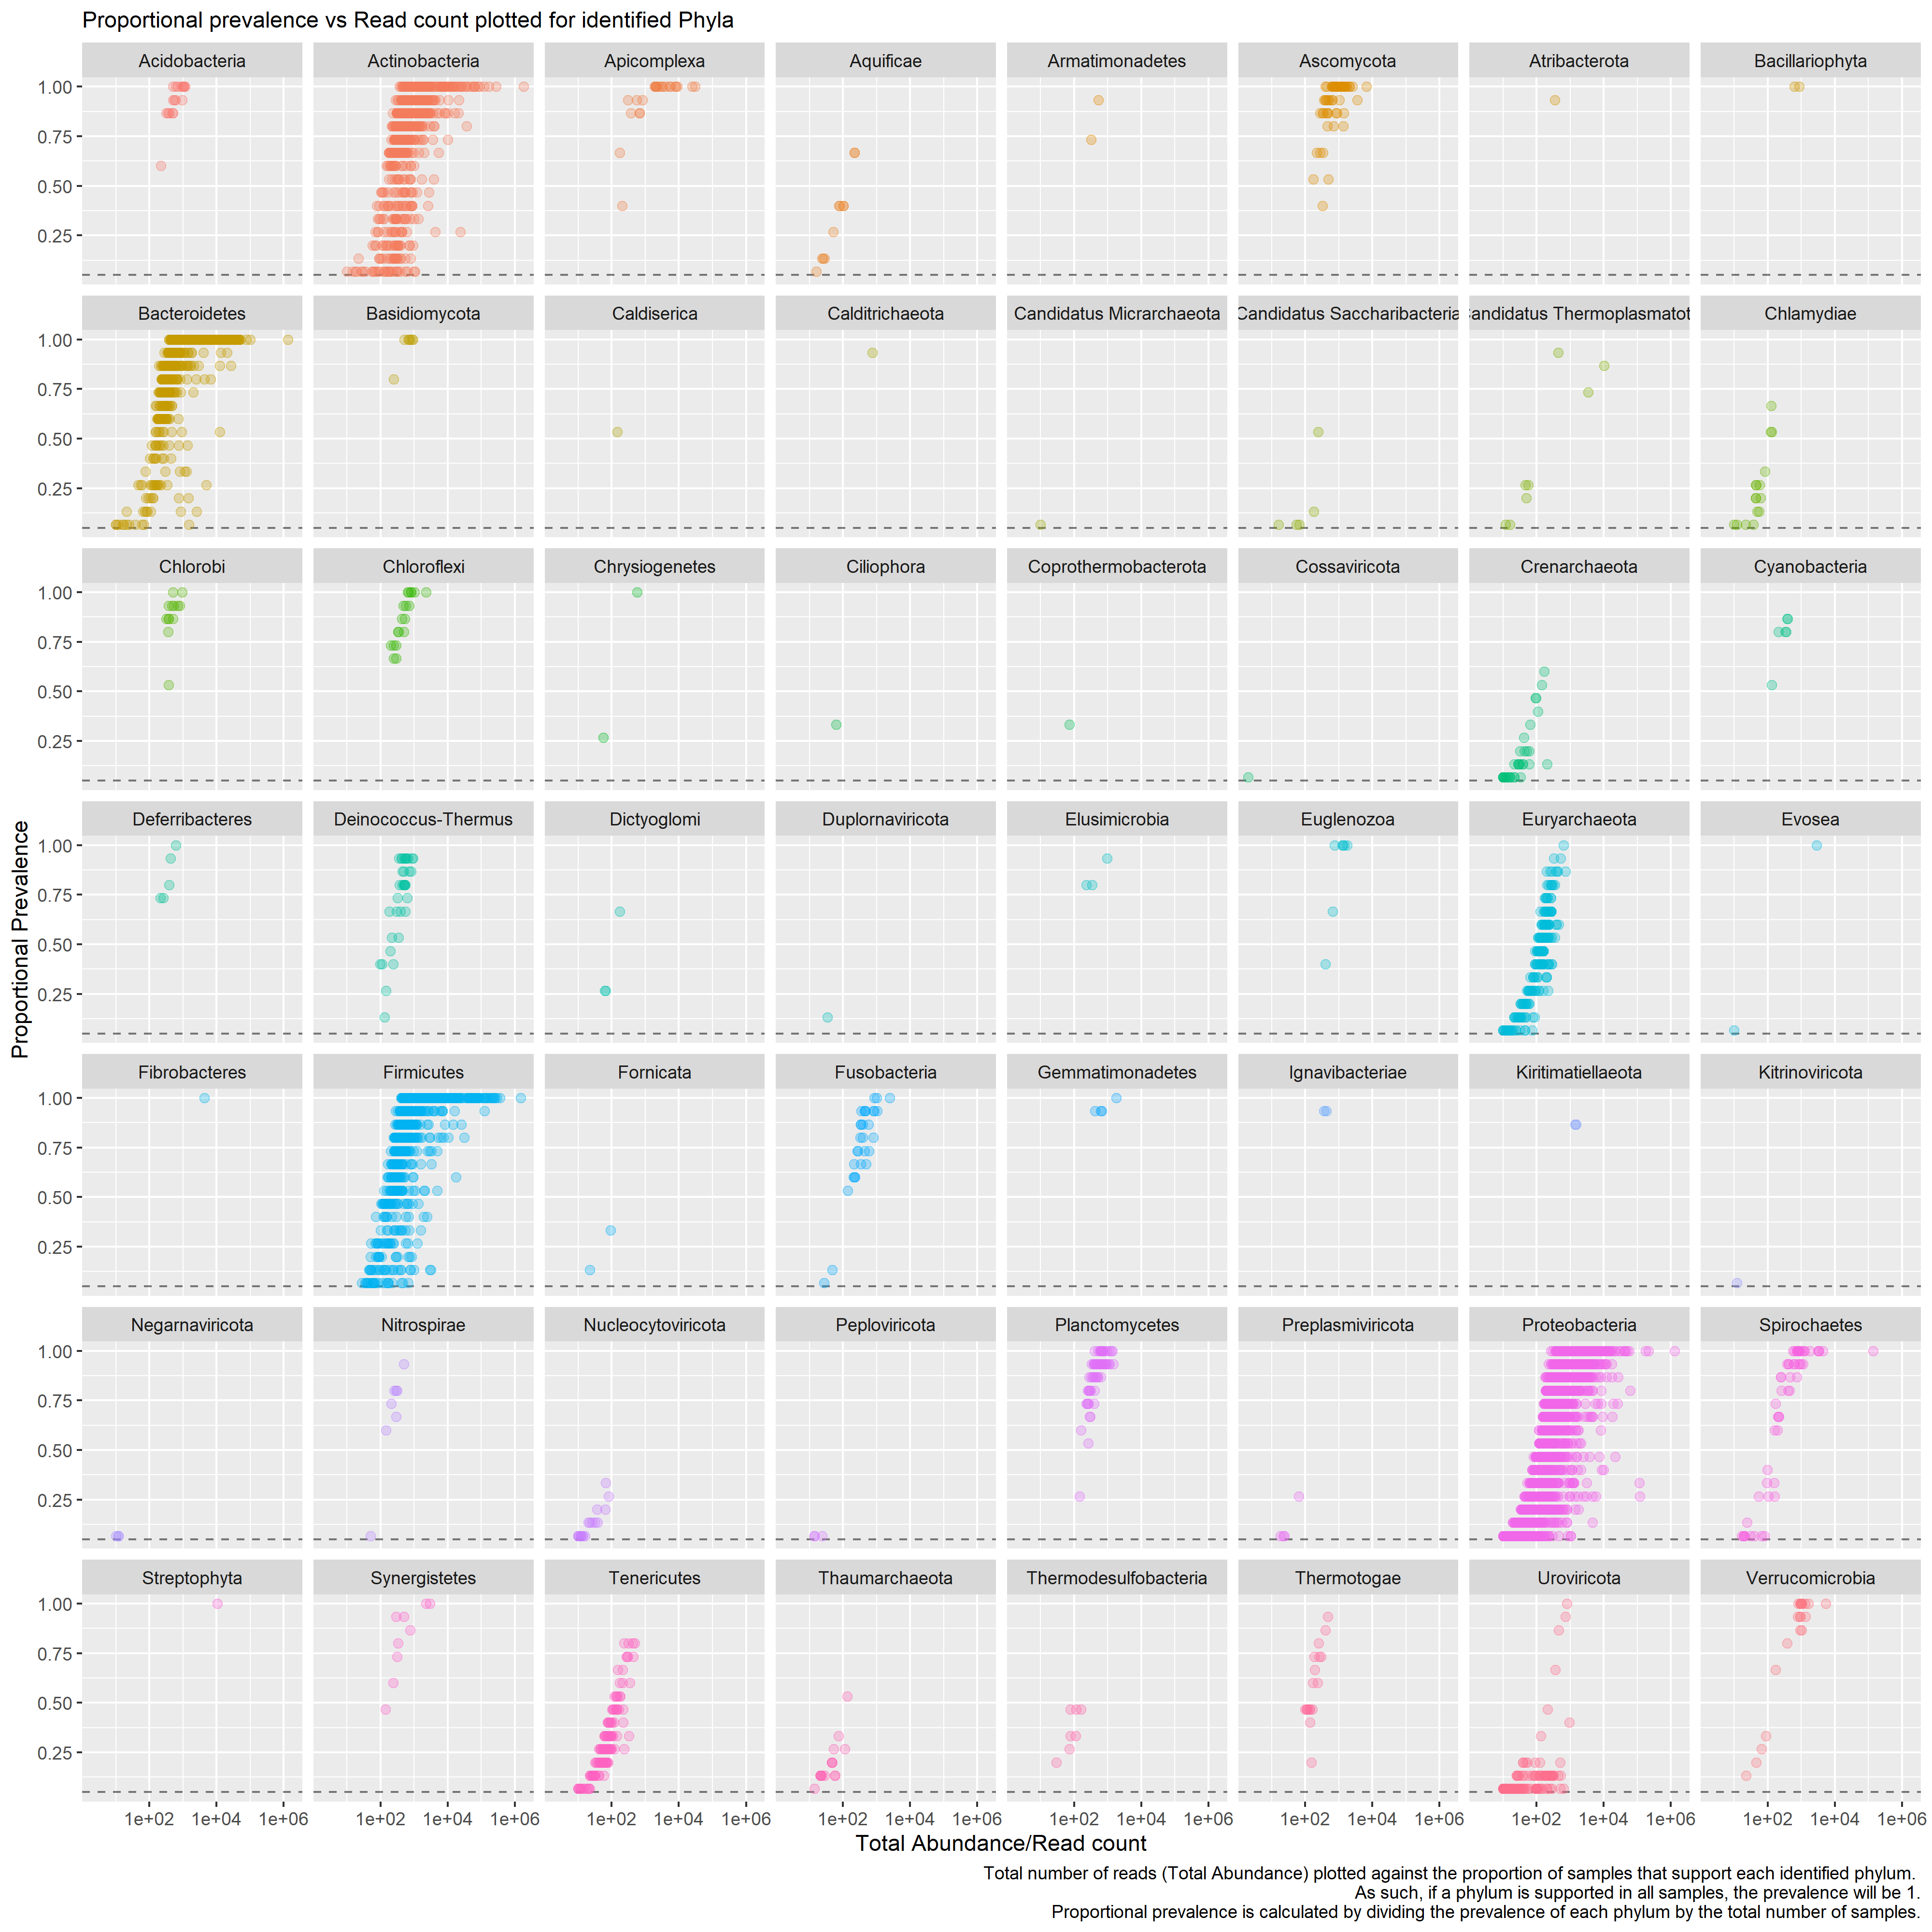
g[Calculate prevalence]
g1[[Prevelance_of_all_Taxa.csv]]
g2[[Average_Prevalence_perPhylum.csv]]
g3[[Prevalence_TotalAbundance.png]]
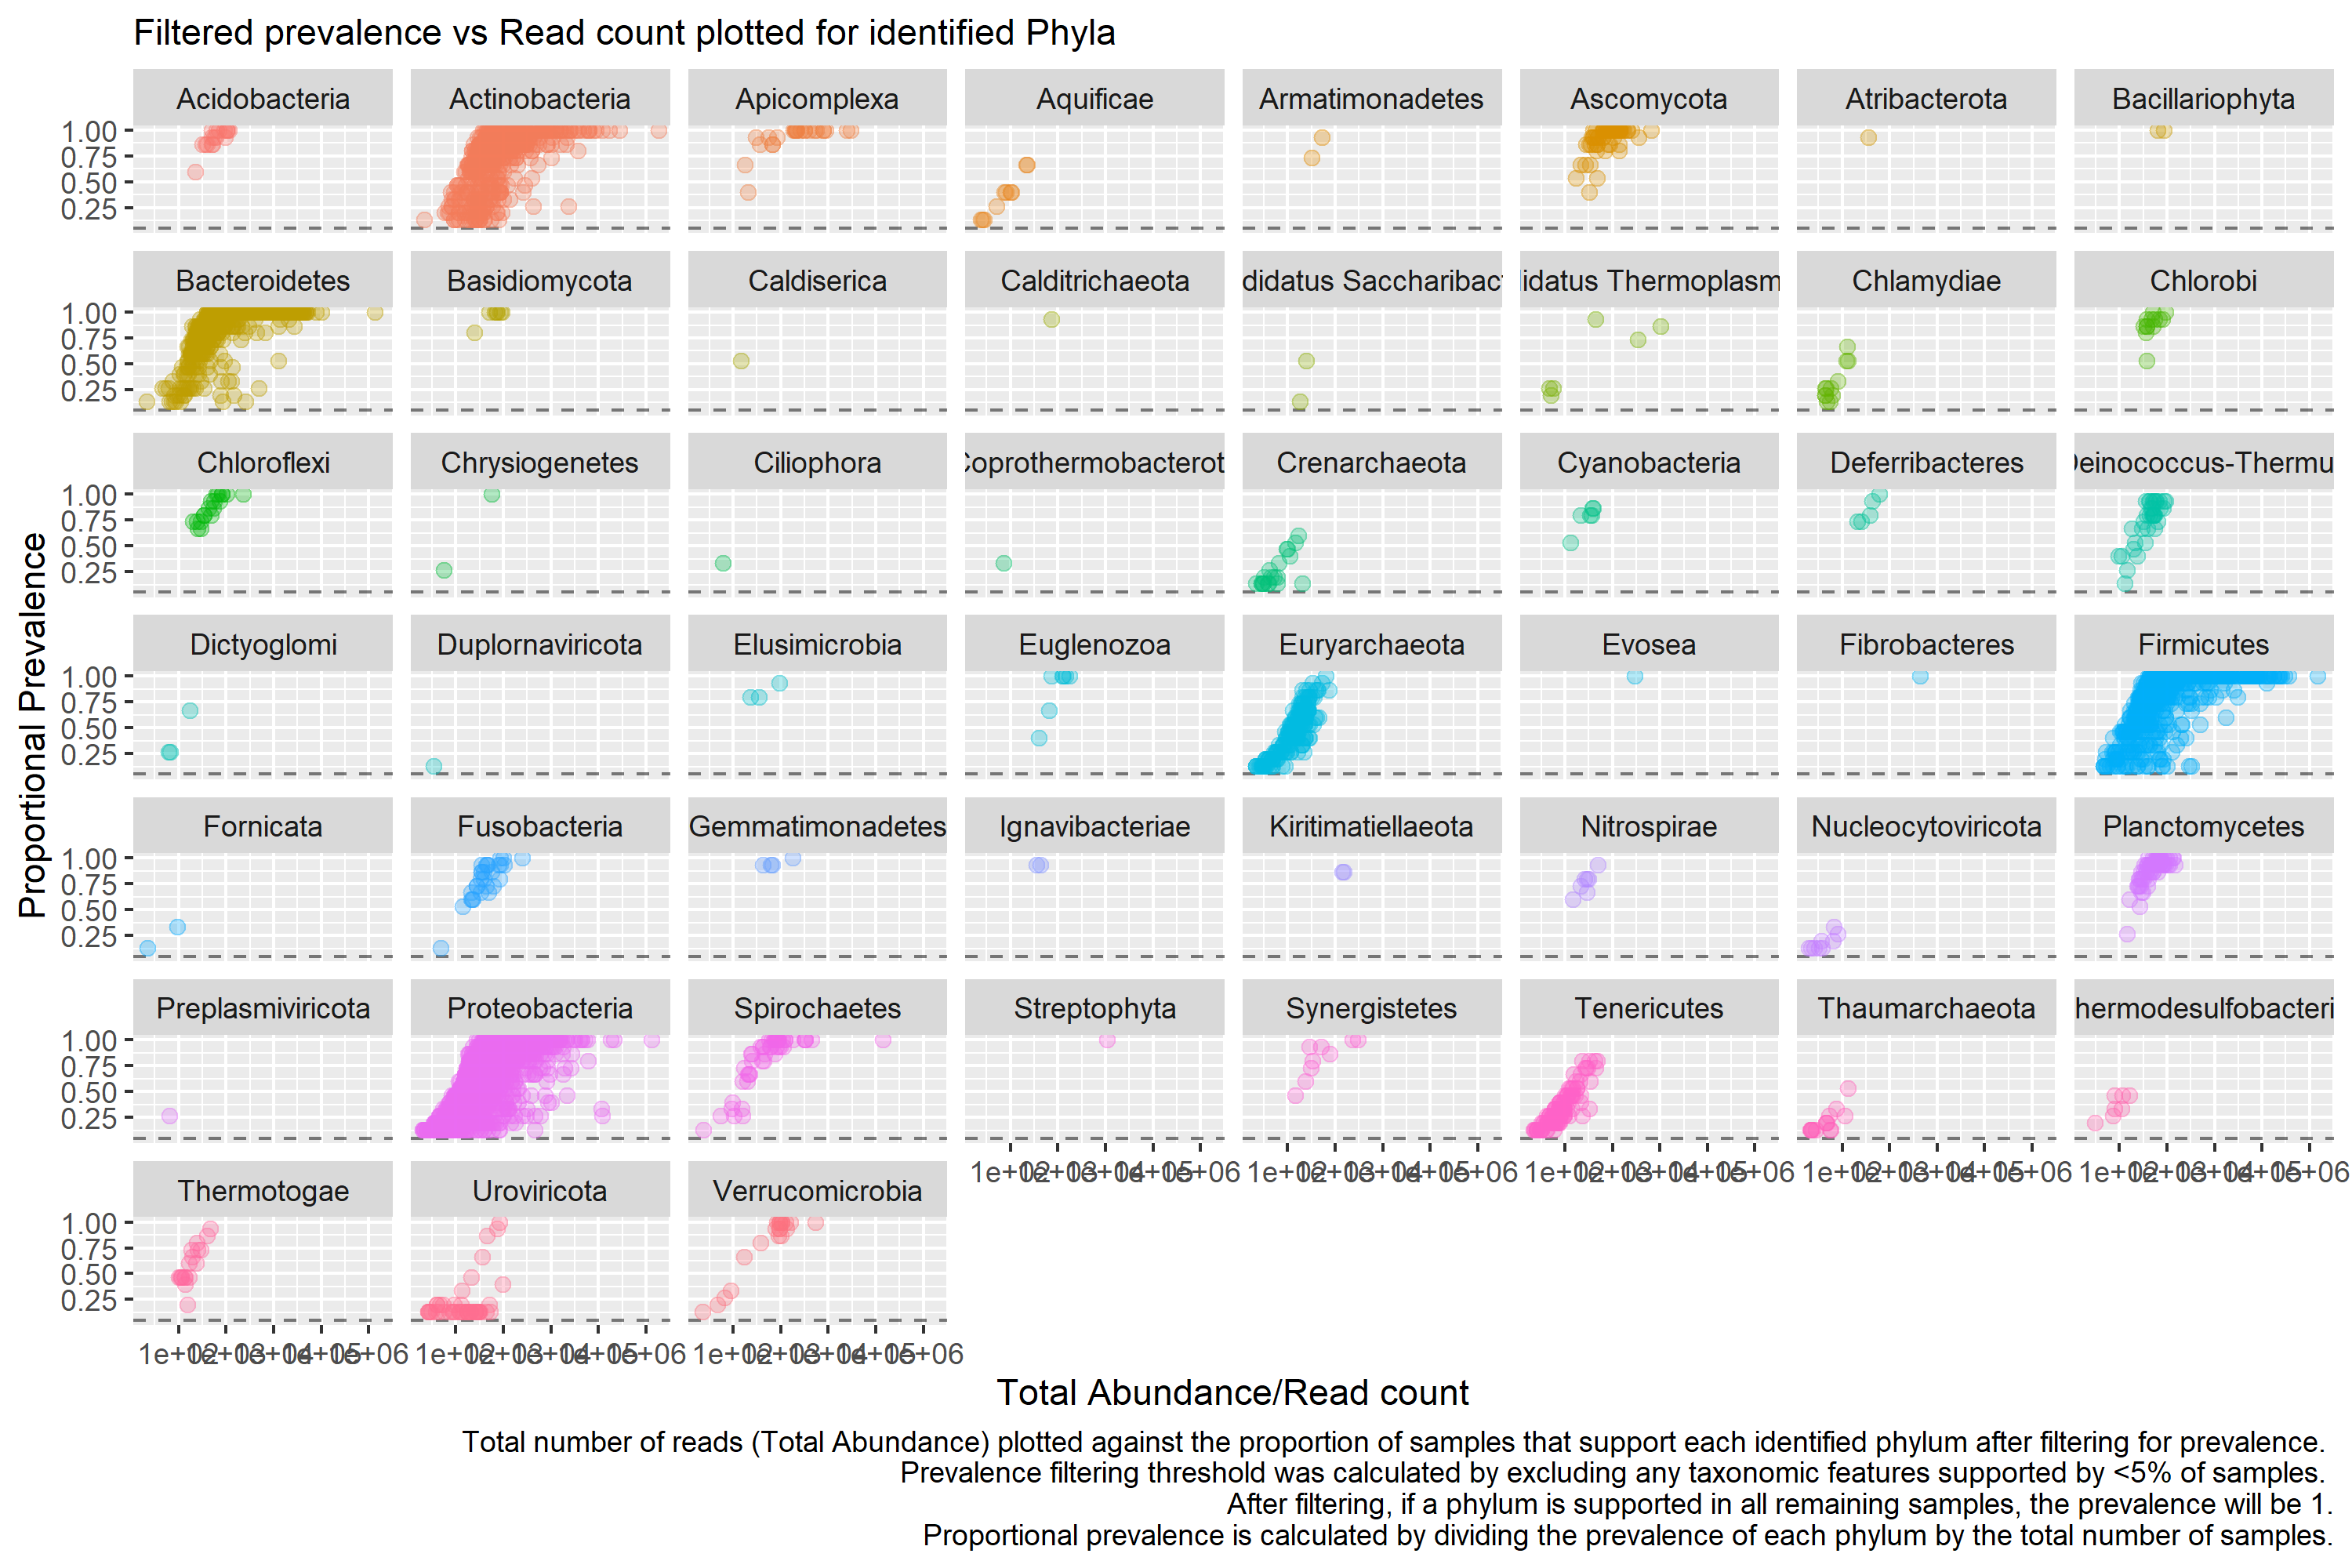
g4[[Filtered_Prevalence_of_all_Taxa.csv]]
h[Agglomerate data]
h1[[Pre_and_Post_Agglomeration_ByGenus_byPhylum.png]]
h2[[Pre_and_Post_AbundanceValueTransformation.png]]
h3[[Pre_and_Post_RelativeAbundance.png]]
h4[[Combined_PerPhylum_RelativeAbundance.png]]
i[Calculate alpha diversity]
i1[[AlphaDiversity.csv]]
i2[[AlphaDiversity.png]]
j[Calculate beta diversity]
j1[[BetaDiversity_multiMethod.png]]

a --> b --> c --> d --> e --> f --> g --> h --> i --> j
c -.-> c1
c -.-> c2
c -.-> c3
c -.-> c4
c -.-> c5
f -.-> f1
f -.-> f2
f -.-> f3
f -.-> f4
f -.-> f5
g -.-> g1
g -.-> g2
g -.-> g3
g -.-> g4
h -.-> h1
h -.-> h2
h -.-> h3
h -.-> h4
i -.-> i1
i -.-> i2
j -.-> j1

linkStyle 0 stroke: #008000
linkStyle 1 stroke: #008000
linkStyle 2 stroke: #008000
linkStyle 3 stroke: #008000
linkStyle 4 stroke: #008000
linkStyle 5 stroke: #008000
linkStyle 6 stroke: #008000
linkStyle 7 stroke: #008000
linkStyle 8 stroke: #008000
linkStyle 9 stroke: magenta
linkStyle 10 stroke: magenta
linkStyle 11 stroke: magenta
linkStyle 12 stroke: magenta
linkStyle 13 stroke: magenta
linkStyle 14 stroke: magenta
linkStyle 15 stroke: magenta
linkStyle 16 stroke: magenta
linkStyle 17 stroke: magenta
linkStyle 18 stroke: magenta
linkStyle 19 stroke: magenta
linkStyle 20 stroke: magenta
linkStyle 21 stroke: magenta
linkStyle 22 stroke: magenta
linkStyle 23 stroke: magenta
linkStyle 24 stroke: magenta
linkStyle 25 stroke: magenta
linkStyle 26 stroke: magenta
linkStyle 27 stroke: magenta
linkStyle 28 stroke: magenta
linkStyle 29 stroke: magenta
As the microbiome analysis is optional, the conversion of the Kraken/Bracken reports to the needed biom file format was not added to the pipeline.
So this will be done manually as described in the example commands below. These commands must be run in the main conda environment -- described as metagenomics_env in the Installation page.
# activate the conda environment
conda activate metagenomics_env
# make the directory to hold the output
# in this example, I will use the example that I have taken 'isolate_334' and 'isolate_556' through the NanoMetaPipe pipeline as part of a 'PulseFGR' project
# So I will already have a larger project folder named `PulseFGR` which has further folders names 'isolate_334' and 'isolate_556' with the subsequent outputs from the main NanoMetaPipe workflow
# So I want to place the outputs of the microbiome analysis within the larger 'PulseFGR' project folder but create a folder to hold JUST the outputs of the MicrobiomeAnalysis.R script from all the isolates
# I have also carried out kraken taxonomic classification of the reads and the generated metagenomes
#
# So first make the folders to hold the output of the MicrobiomeAnalysis.R
mkdir -p path/to/PulseFGR/MicrobiomeAnalysis
# Next make the folder to hold the biom files that will be used in the Rscript
mkdir path/to/PulseFGR/MicrobiomeAnalysis/BiomFiles
# make folders to hold the biom files of the metagenomes and the reads separately
mkdir path/to/PulseFGR/MicrobiomeAnalysis/BiomFiles/Assembly
mkdir path/to/PulseFGR/MicrobiomeAnalysis/BiomFiles/Reads
# copy the kraken/bracken reports to the newly made folders
## copy the bracken report for the isolate metagenomes
cp path/to/PulseFGR/isolate_334/Kraken/Assembly/isolate_334_DNA/bracken_KrakenReport.txt > path/to/PulseFGR/MicrobiomeAnalysis/BiomFiles/Assembly/isolate_344.txt

cp path/to/PulseFGR/isolate_556/Kraken/Assembly/isolate_556_DNA/bracken_KrakenReport.txt > path/to/PulseFGR/MicrobiomeAnalysis/BiomFiles/Assembly/isolate_556.txt
## copy the bracken report for the isolate reads
cp path/to/PulseFGR/isolate_334/Kraken/Reads/isolate_334_DNA/bracken_KrakenReport.txt > path/to/PulseFGR/MicrobiomeAnalysis/BiomFiles/Reads/isolate_344.txt

cp path/to/PulseFGR/isolate_556/Kraken/Reads/isolate_556_DNA/bracken_KrakenReport.txt > path/to/PulseFGR/MicrobiomeAnalysis/BiomFiles/Reads/isolate_556.txt

# to make individual isolate biom files
kraken-biom path/to/PulseFGR/MicrobiomeAnalysis/BiomFiles/Reads/isolate_344.txt -o path/to/PulseFGR/MicrobiomeAnalysis/BiomFiles/Reads/isolate_344.biom

# to make combined isolate biom files
kraken-biom path/to/PulseFGR/MicrobiomeAnalysis/BiomFiles/Reads/*.txt -o path/to/PulseFGR/MicrobiomeAnalysis/BiomFiles/Reads/CombinedIsolates.biom
# note that the *.txt means that all files with '.txt' files within that BiomFiles/Reads folder will be used to make a single biom file- Another important file that is necessary for this workflow is the
sampleData.csvwhich will need to be populated with some metadata about your isolates. - While the file asks for some extensive information, not all the columns will be relevant to your dataset and thus can be left blank.
- The most important columns that MUST not be left empty are:
-
Exp_Number: which you can also use a sampleID if you would prefer. It simply must be a unique identifier which no spaces or underscores or special characters -
Sample_Type: which must be DNA -
Location: which provides the most information when populated with collection location information
-
- The other columns are present for the expansion of the
MicrobiomeAnalysis.Rscript if you wish to do so. - Once populated, remember to save the file as a .csv file. This is extremely IMPORTANT!!!!
- Open
MicrobiomeAnalysis.Rin RStudio - Populate the
argsvariable with the appropriate information-
First argument: Enter the path to the biom file to be analysed
- The biom file can be made from a single isolate or from multiple isolate's kraken/bracken report
- Second argument: Enter the path to output the files and images made by this script
- Third argument: Enter the path to the sample metadata csv file
-
Fourth argument: Choose what format you want plots to be saved in. You have a choice between
pngandtiff -
Fifth argument: Enter the detail if the sequences used for kraken classification are reads or assemblies. Choice are between
AssemblyorReads - Example:
 # example of how to fill in the args variable
 args = c("my/path/to/put/outputs",
 			"my/path/to/the/Combined_Isolate.biom",
 			"my/path/to/the/sample_metadata.csv",
 			"png",
 			"Assembly")
 ### Note that here, a Combined_Isolate.biom is being used however, a single Isolate.biom can also be used, although this may not be that most informative means of investigation for that type of dataset
- If you are running the Rscript for the first time, you will likely also need to install the packages. To install the packages, you will have to uncomment the currently commented lines. Commented lines have a '#' at the beginning of them. Think of them as 'personal notes' which the program does not see as 'commands'.
- This means that the commented lines for installation which look like this:
 # BiocManager::install(c("microbiome/mia", "devtools","tidyr", "remotes",
 # "tidyverse","dplyr","cowplot","knitr","phyloseq",
 # "vegan","ape", "ggplot2","ggplotify", "magrittr",
 # "data.table","scater","plyr"))
- Will need to be uncommented to look this:
 BiocManager::install(c("microbiome/mia", "devtools","tidyr", "remotes",
 "tidyverse","dplyr","cowplot","knitr","phyloseq",
 "vegan","ape", "ggplot2","ggplotify", "magrittr",
 "data.table","scater","plyr"))
- Note the removal of the '#' in front of the lines
- !!!! IMPORTANT: Unless specifically mentioned in this tutorial, no other commented lines should be changed!!!!!
- When you run the script with the installation section active (uncommented), you may be prompted if you want to update packages, with three choices:
[a],[s],[n]representingall,someandnone - Here, either enter
aorn. Sometimes, choosing[a]does not update all the package due to some permissions, hence sometimes, you can simply choose not to update. It should not stop the script from working!
- Once installed, remember to re-apply the comments as you do not have to always install the packages each time you run the script. You only need to install them once!
- To comment, simply add
#in front all the lines you uncommented above
- To comment, simply add
- Once this is done, you are ready to run the script.
- To run the script, you can either:
- Click on
Sourcein the upper right of the window containing the R code. OR - Press
Ctrl+Shift+S. OR - In the menu bar at the top of the window, click:
Code>Source
- Click on
- After the script completes, look in your designated output folder for the generated files and plots
-
First argument: Enter the path to the biom file to be analysed
Here are some examples of outputs that can be generated from this workflow.
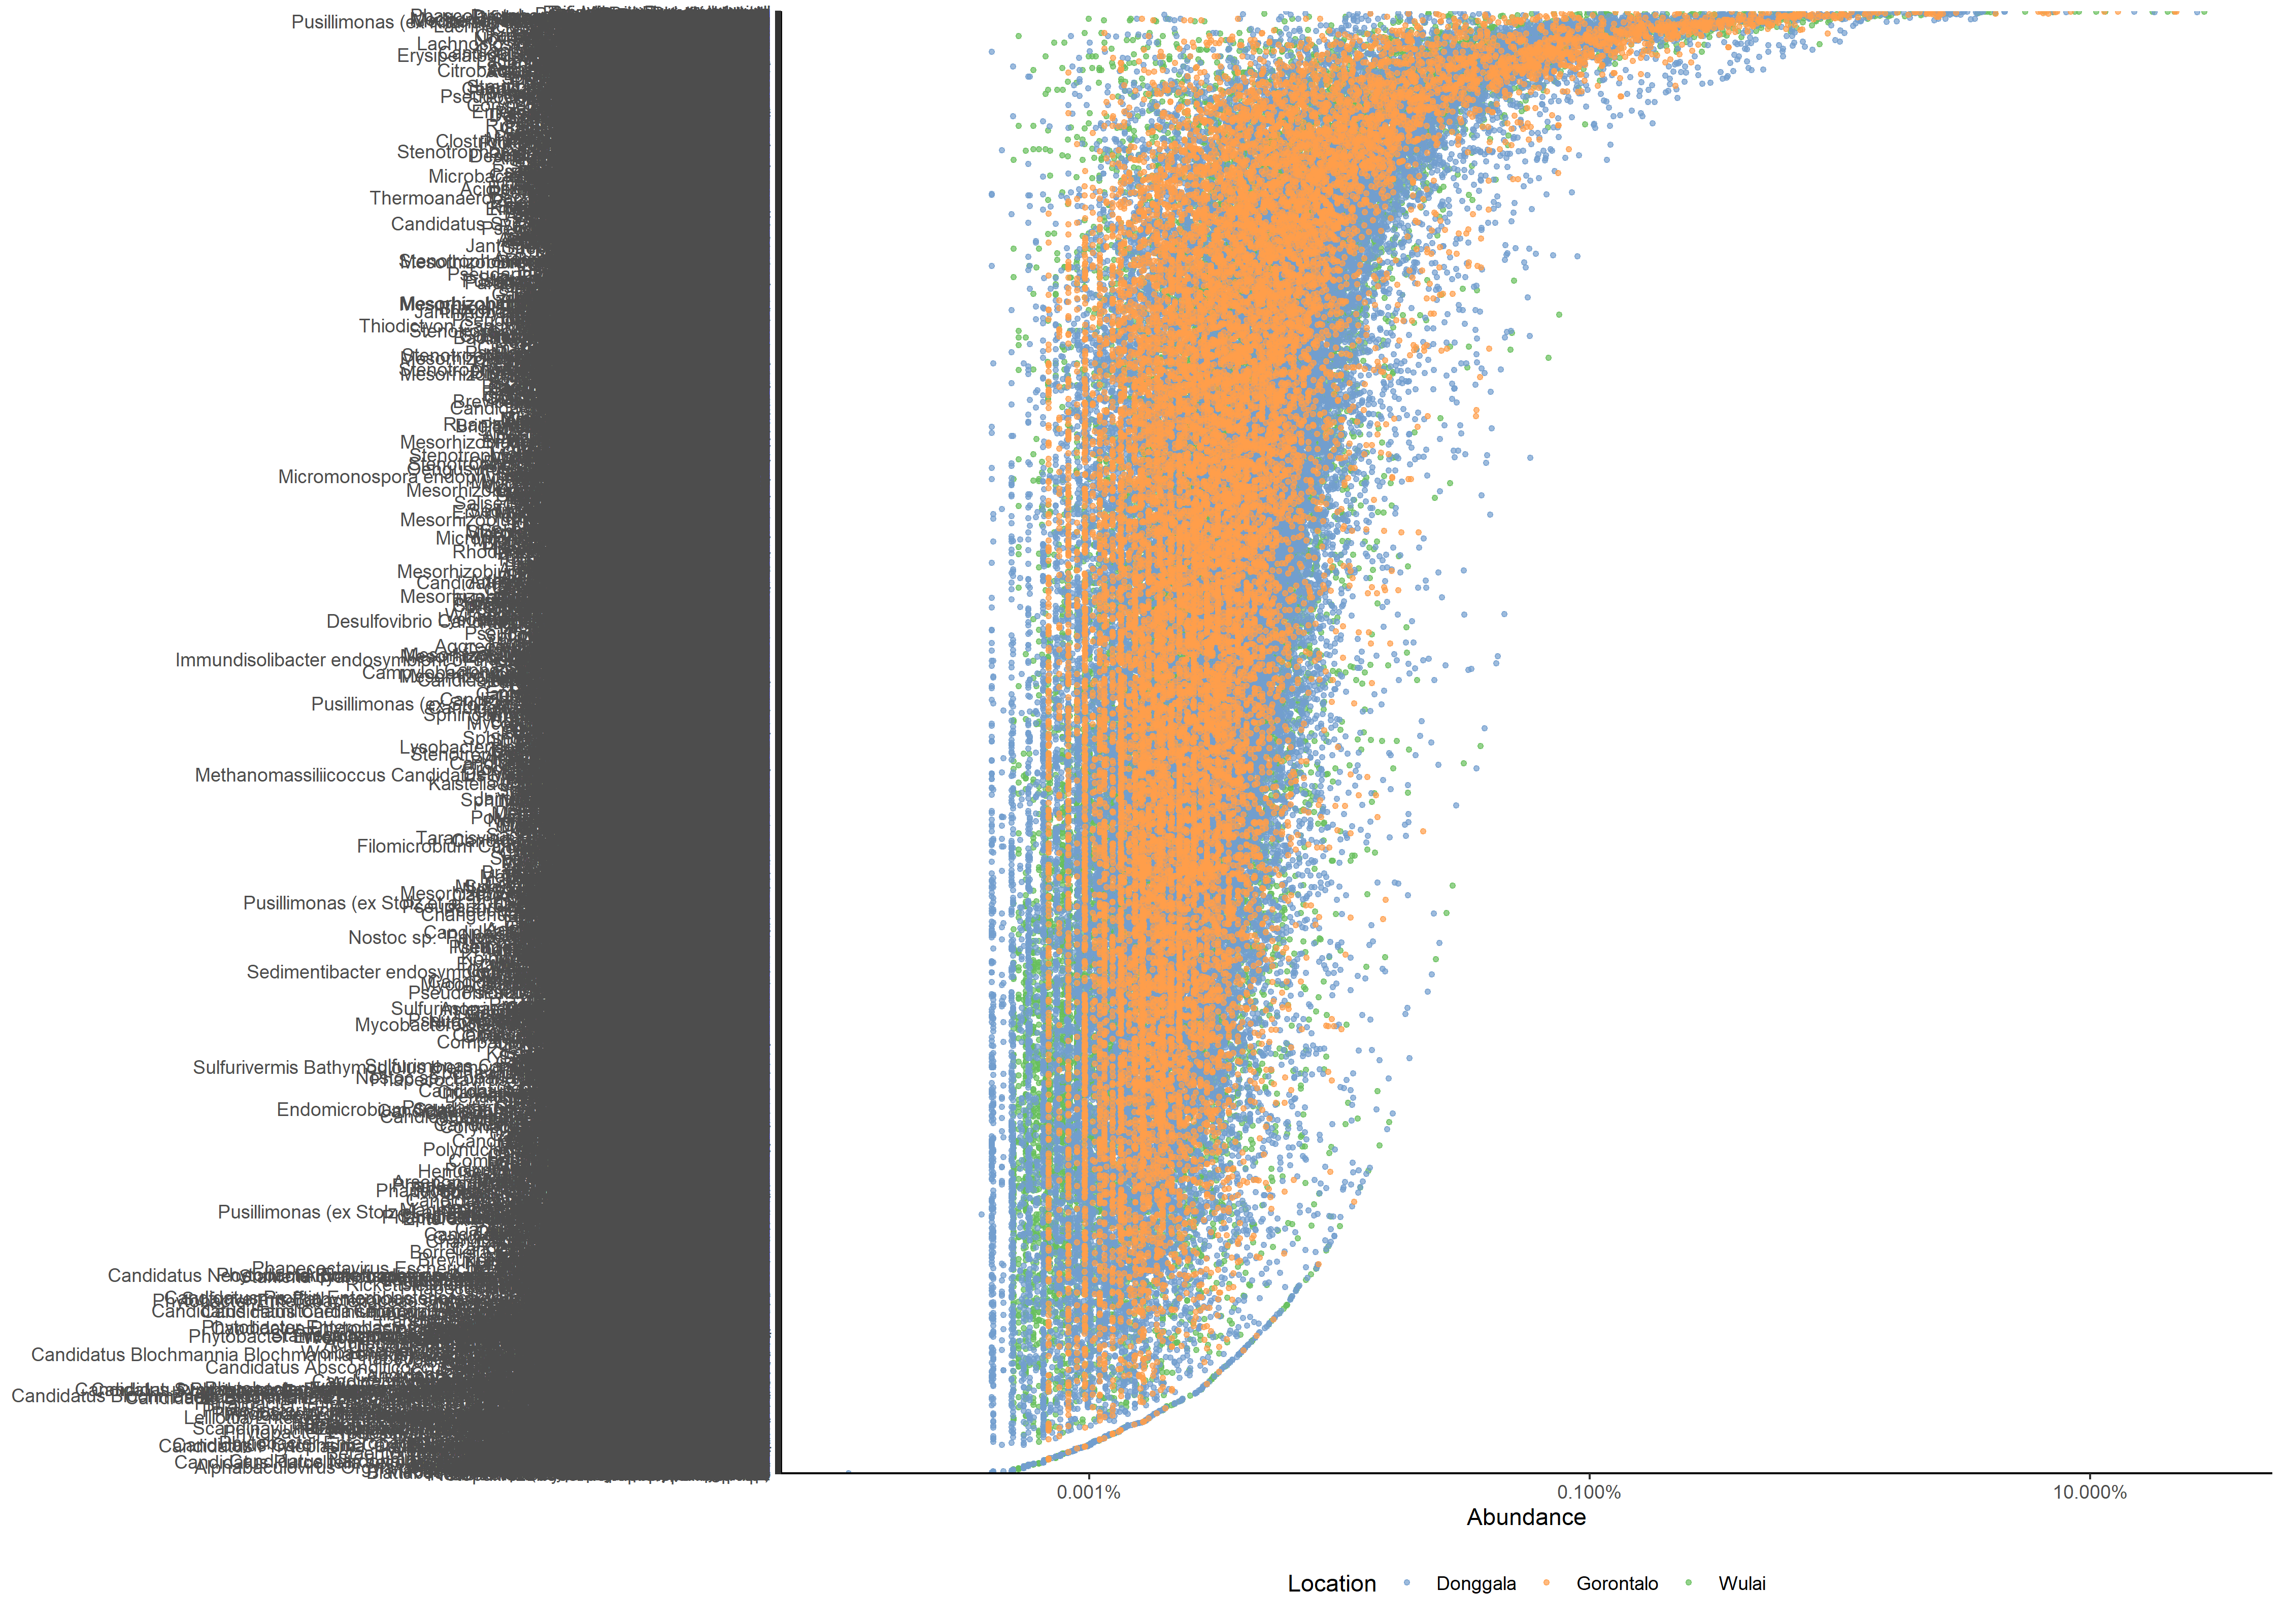 Legend: Plot of the abundance of all identified taxa within an imported BIOM file. Taxa are coloured based on the location information provided in the sample metadata file. The y-axes could not be rendered large enough to delineate individual names of taxa. Further agglomeration (or filtration) must be done for further clarification