An intelligent test reporter with AI-powered failure analysis, flakiness detection, performance regression alerts, and a modern interactive dashboard. Free and open source (Apache-2.0) — every feature included.
Works with any automation technology — Playwright (native), plus JUnit XML, TRX, and Postman/Newman results via the generate CLI. One report format for your entire test estate.
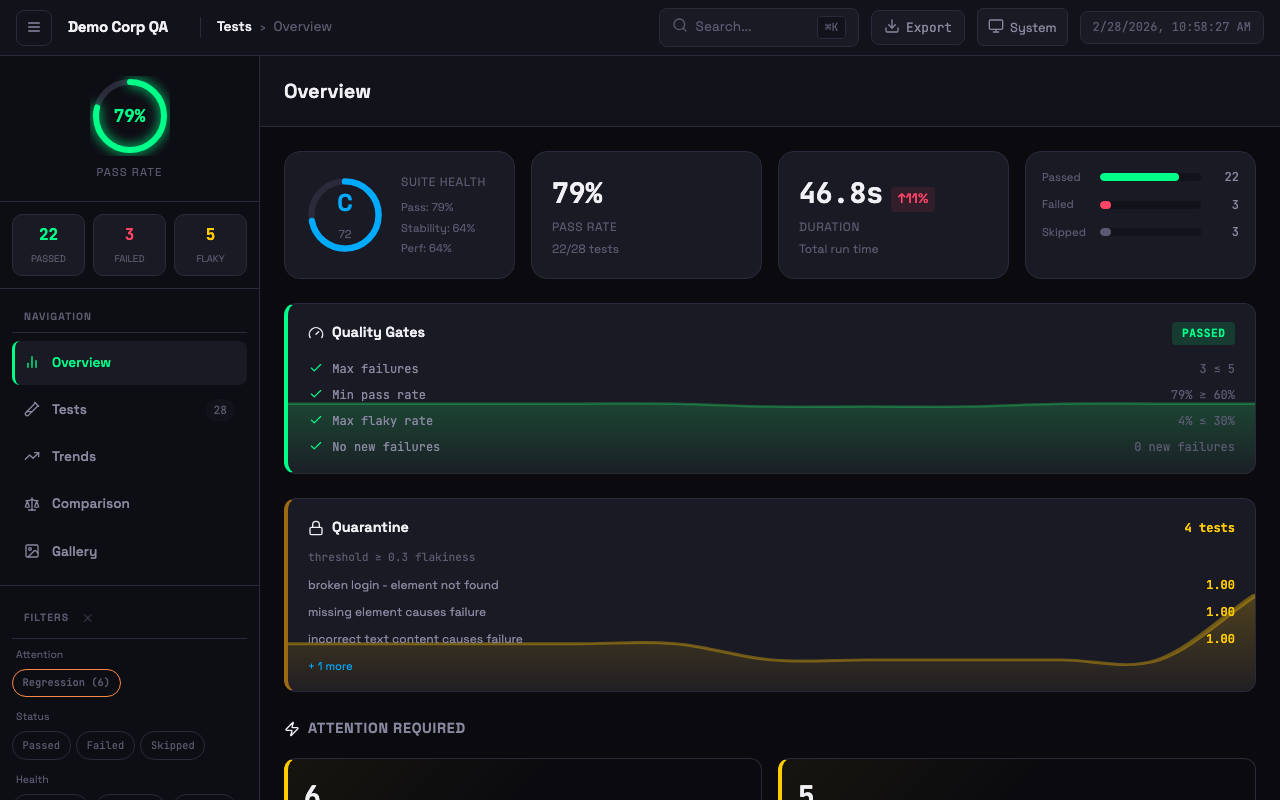 Dashboard with quality gates, quarantine, suite health grade, attention alerts, and failure clusters
| Playwright | Cypress | .NET (TRX) | Postman | Selenium | SoapUI |
|---|---|---|---|---|---|
|
 |
 |
 |
 |
 |
Framework screenshots (click to expand)
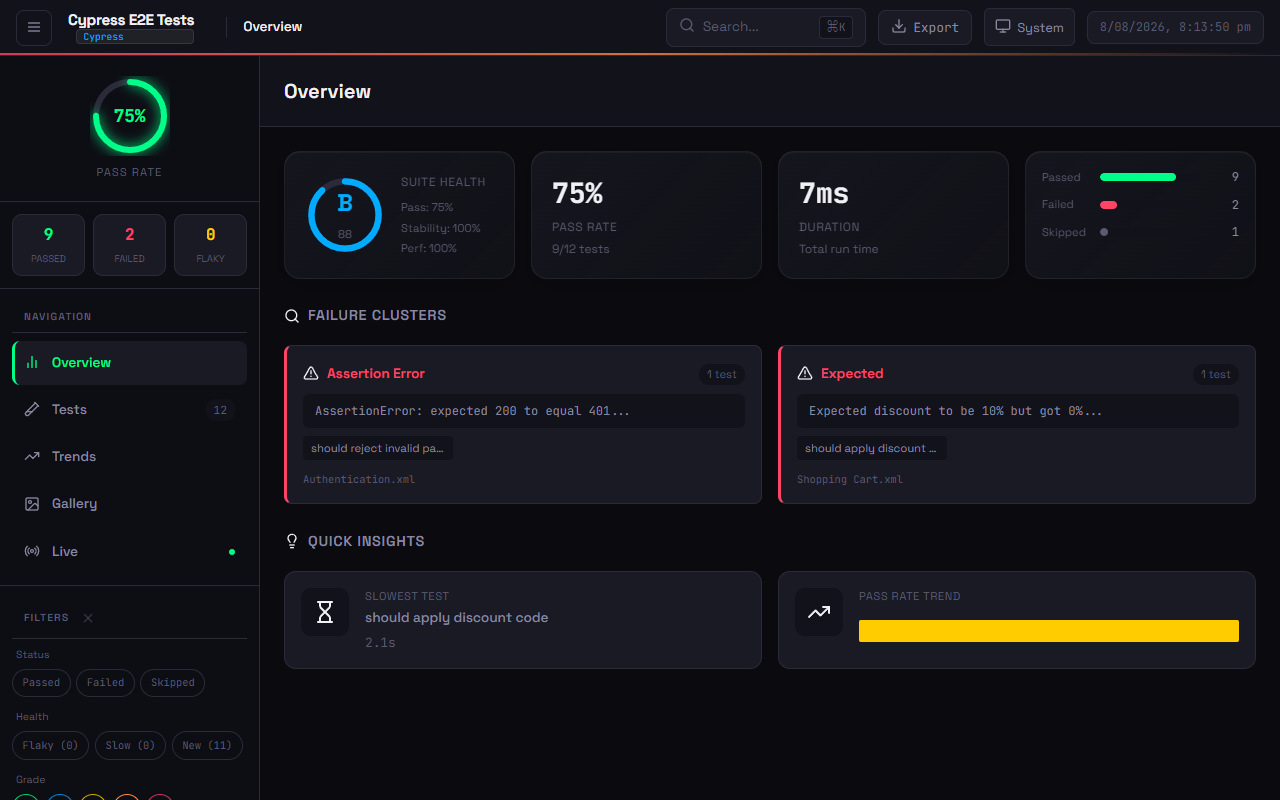
 Cypress E2E test results — 12 tests across Auth, Cart, and API suites
Example:
Cypress E2E test results — 12 tests across Auth, Cart, and API suites
Example: examples/multi-framework/cypress-junit.xml
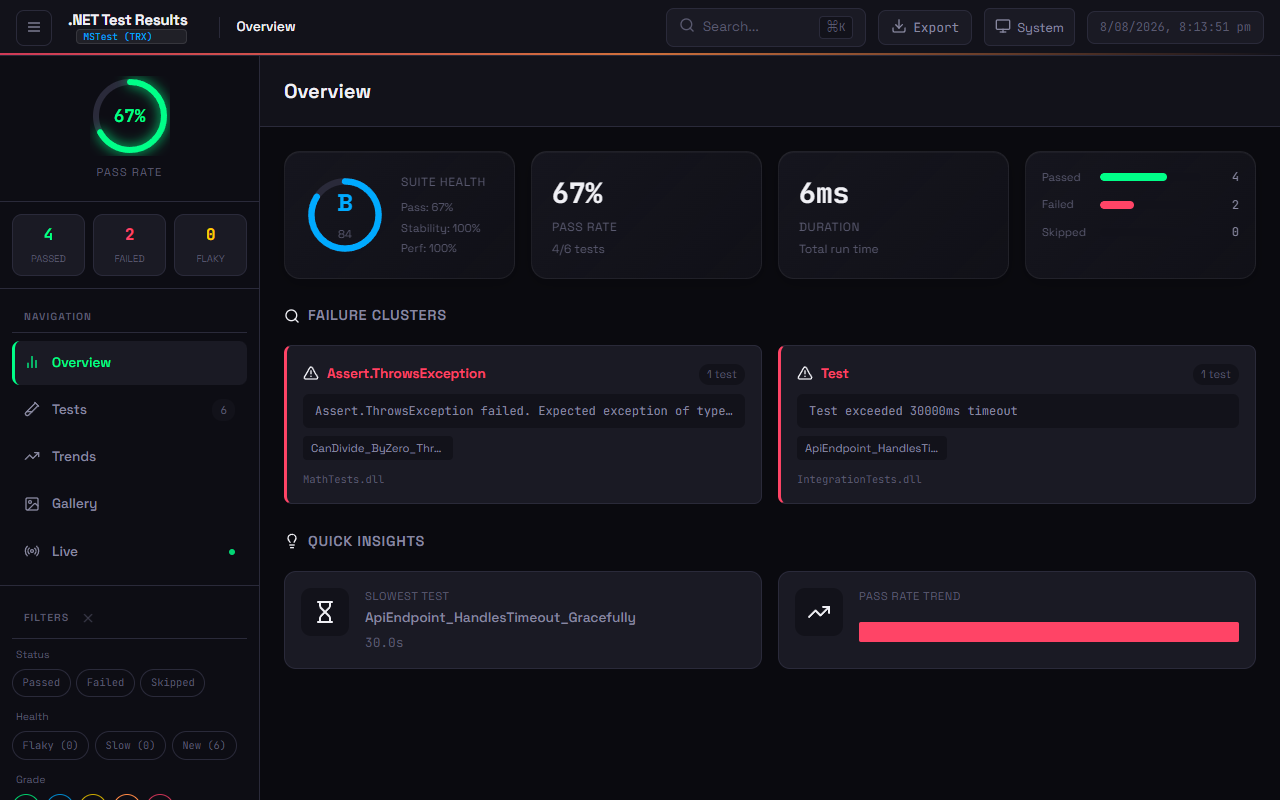
 .NET test results via
 dotnet test --logger trx — MSTest, xUnit, NUnit, RestSharp
Example: examples/multi-framework/dotnet-trx.trx
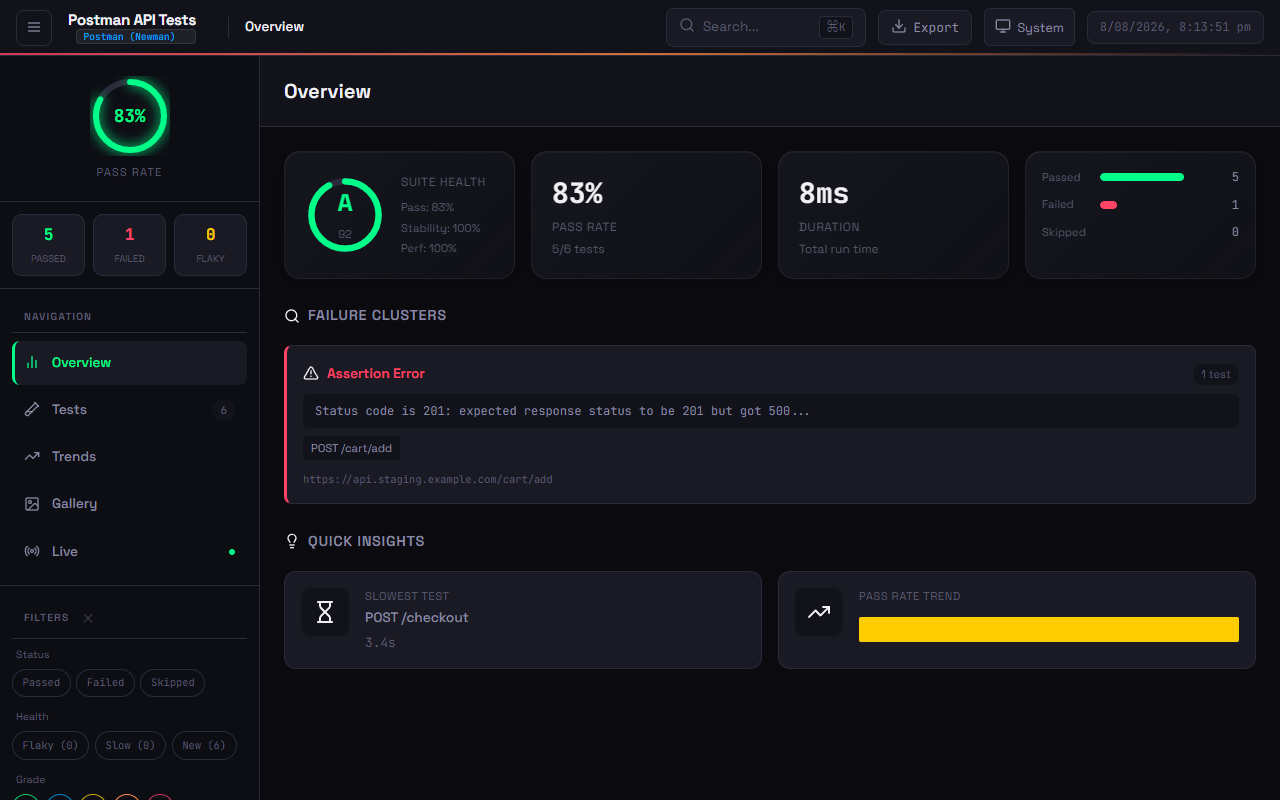
 Postman/Newman API collection results — 6 requests with assertion-level pass/fail
Example:
Postman/Newman API collection results — 6 requests with assertion-level pass/fail
Example: examples/multi-framework/postman-newman.json
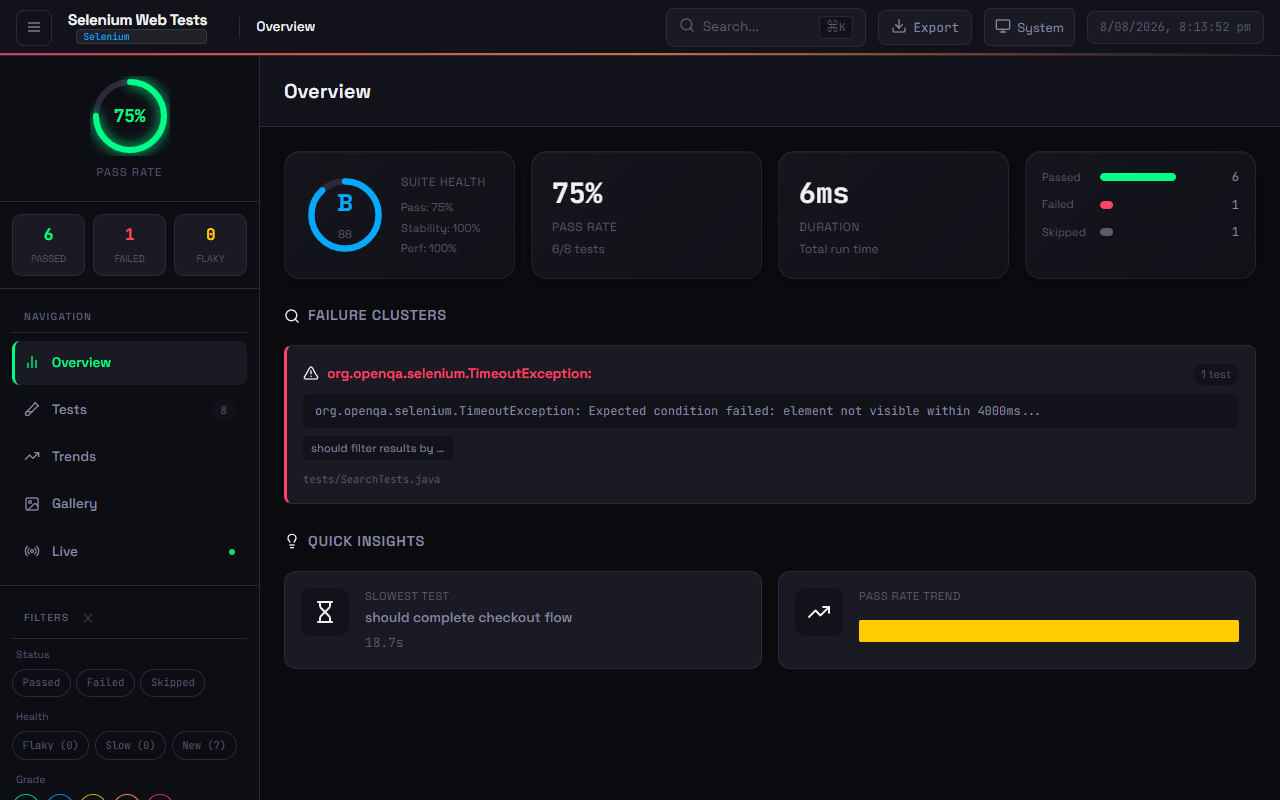
 Selenium WebDriver test results — 8 tests across Login, Navigation, Search, Cart, Checkout
Example:
Selenium WebDriver test results — 8 tests across Login, Navigation, Search, Cart, Checkout
Example: examples/multi-framework/selenium-generic.json
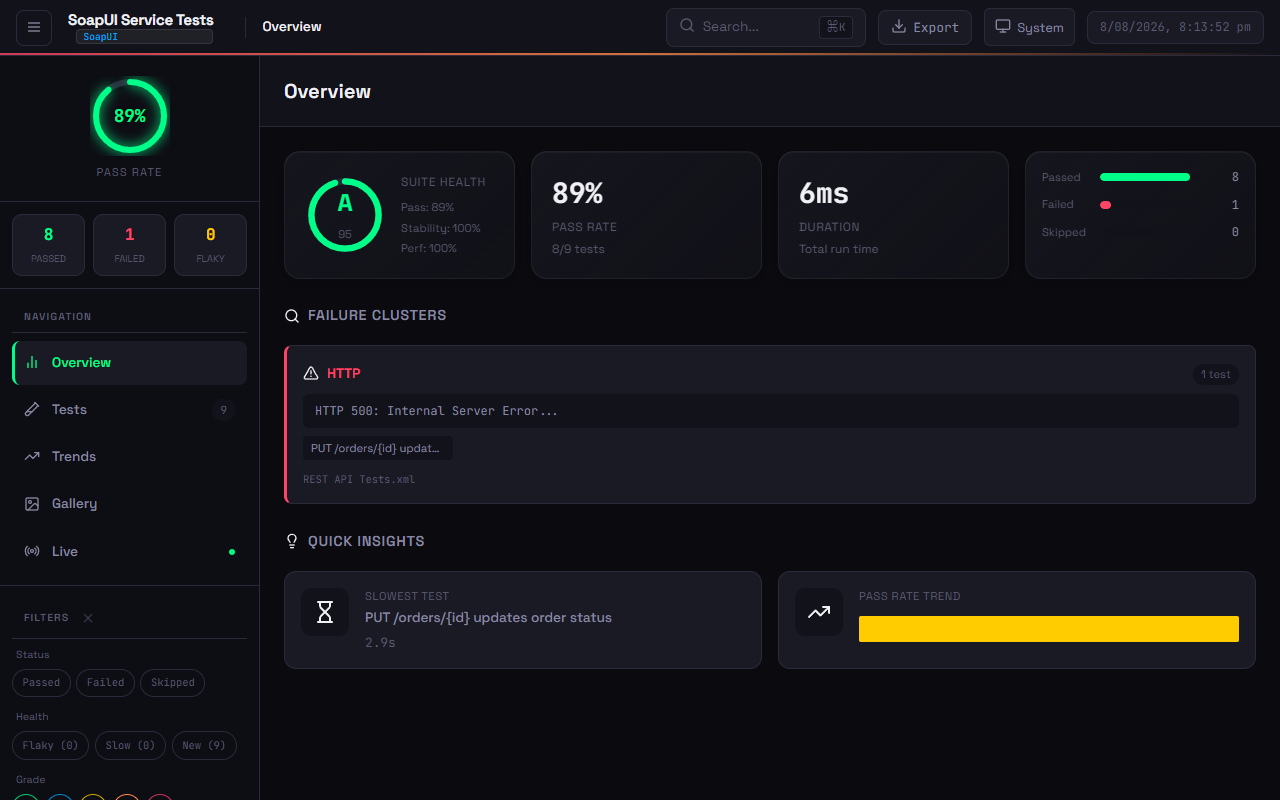
 SoapUI service test results — 9 tests across SOAP, REST, and Security suites
Example:
SoapUI service test results — 9 tests across SOAP, REST, and Security suites
Example: examples/multi-framework/soapui-junit.xml
npm install -D evoveo-smart-reporterAdd to your playwright.config.ts:
import { defineConfig } from '@playwright/test';

export default defineConfig({
  reporter: [
    ['evoveo-smart-reporter', {
      outputFile: 'smart-report.html',
      historyFile: 'test-history.json',
      maxHistoryRuns: 10,
    }],
  ],
});
Run your tests and open the generated smart-report.html.
The generate CLI produces the same rich report from any automation technology's result file. Format is auto-detected.
npx evoveo-smart-reporter generate --input <results-file> [options]| Format | Flag | Covers |
|---|---|---|
| JUnit XML | --format junit |
Cypress, Selenium, Jest, Vitest, Pytest, Go, Maven, TestNG, SoapUI, WebdriverIO |
| TRX | --format trx |
MSTest, xUnit, NUnit (.NET) |
| Newman JSON | --format newman |
Postman / Newman API collections |
| Generic JSON | --format json |
Any framework — convert to the schema |
| Auto-detect | --format auto (default) |
Detects from file content and extension |
CLI examples (click to expand)
# Cypress (emits JUnit XML)
npx evoveo-smart-reporter generate --input cypress-results.xml --framework "Cypress"

# .NET / RestSharp (MSTest TRX)
npx evoveo-smart-reporter generate --input TestResults.trx --framework "RestSharp Integration" --export-pdf

# Postman / Newman
npx evoveo-smart-reporter generate --input newman-report.json --format newman

# SoapUI (JUnit XML export)
npx evoveo-smart-reporter generate --input soapui-junit.xml --framework "SoapUI" --title "API Regression"

# Selenium (generic JSON)
npx evoveo-smart-reporter generate --input selenium-results.json --format json --framework "Selenium"

# Any framework — convert to the generic JSON schema
npx evoveo-smart-reporter generate --input my-results.json --format json --framework "Custom Runner"
Generate all example reports and screenshots: node scripts/generate-examples.js
CLI options for generate (click to expand)
| Option | Description |
|---|---|
--input <path> |
Path to the test result file (required) |
--format <format> |
Input format: auto, junit, trx, newman, json (default: auto) |
--output <path> |
Output HTML report path (default: smart-report.html) |
--history <path> |
History file path (default: test-history.json) |
--framework <name> |
Override the framework label shown in the report header |
--project <name> |
Project name (separates history per project) |
--export-json |
Also write smart-report-data.json |
--export-junit |
Also write JUnit XML |
--export-pdf |
Also generate PDF executive summaries |
--theme <preset> |
Theme preset (default, dark, light, high-contrast, ...) |
--title <title> |
Report title (branding) |
Programmatic API (click to expand)
import { detectAdapter, getAdapter } from 'evoveo-smart-reporter/adapters';
import { ReportGenerator } from 'evoveo-smart-reporter/report-generator';
import * as fs from 'fs';

const content = fs.readFileSync('results.xml', 'utf-8');
const adapter = detectAdapter(content, 'results.xml'); // or getAdapter('junit')
const ingested = adapter!.ingest({ content, outputDir: '.', options: {} });

const generator = new ReportGenerator({
  options: { outputFile: 'report.html' },
  outputDir: '.',
});
generator.ingest(ingested);
await generator.generate();Aggregate test runs across your entire enterprise — multiple clients, products, teams, and stacks — into one leadership dashboard. See pass rates, flakiness, and trends by team. Drill down to the single-run report you already know.
 Estate overview: 500 runs across 5 clients, 6 teams, 8 stacks — pass rate ring, KPI cards, trend chart
npm run build
node dist/bin/seed-data.js --data-dir ./data    # seed 500 sample runs
npx evoveo-smart-reporter-dashboard --port 3000 --data-dir ./data
# Open http://localhost:3000| View | What it shows |
|---|---|
| Estate Overview | KPI cards (pass rate, flaky rate, total runs), trend chart, heatmaps by client/product/team/stack |
| Team Contribution | Tests authored + fixes landed per team (from GitHub/Jira connectors), worst runs, flaky tests |
| Recent Runs | Run list with client, product, team, stack, pass rate, duration — click to drill down |
| Period Comparison | Current period vs previous period — are things getting better or worse? |
| Sync Health | CI pipeline connector status — is the dashboard data complete and current? |
| Settings | Cloud storage (OneDrive/Google Drive), alert thresholds, connector config |
Dashboard screenshots (click to expand)
 Team contribution: tests authored and fixes landed per team, with drill-down
 Settings: connect OneDrive or Google Drive as shared storage — no Docker, no Postgres
 Estate trend: pass rate and flaky rate over time with distribution heatmaps
 Recent runs: client, product, team, stack, pass rate, duration — click to drill down
 Period comparison: current vs previous period — pass rate delta, flaky rate delta
 Sync health: CI pipeline connector status — last sync, stale warnings
 Dev mode login — enter any tenant/user. Production uses OIDC or SAML SSO.
| Mode | Flag | Use Case |
|---|---|---|
| Dev | --auth dev |
Local development (login form, trusts headers) |
| OIDC | --auth oidc --oidc-url <url> |
Enterprise SSO (Keycloak, Okta, Google) |
| SAML | --auth saml |
SAML via gateway delegation (mod_auth_mellon, Shibboleth) |
curl -X POST http://localhost:3000/api/ingest \
  -H 'Content-Type: application/json' \
  -H 'X-Tenant-Id: acme' -H 'X-User-Id: u1' -H 'X-User-Role: admin' \
  -d '{
    "orgContext": {
      "tenantId": "acme", "client": "fiserv-payments", "product": "payments-gateway",
      "team": "qa-payments", "stack": "junit", "runType": "nightly", "environment": "ci"
    },
    "format": "junit",
    "rawArtifact": "<testsuites><testsuite name=\"s\" tests=\"10\" failures=\"1\"><testcase name=\"ok\"/><testcase name=\"bad\"><failure>boom</failure></testcase></testsuite></testsuites>"
  }'
Full guide: docs/leadership-dashboard-guide.md · ADRs: docs/adr/ (9 ADRs)
- AI Failure Analysis — fix suggestions via your own Anthropic, OpenAI, or Gemini API key
- Flakiness Detection — historical tracking across runs (not single-run retries)
- Performance Regression Alerts — warns when tests get significantly slower
- Stability Scoring — composite health metrics (0-100, grades A–F)
- Failure Clustering — group similar failures by error type with AI analysis
- Test Retry Analysis — track tests that frequently need retries
- Sidebar Navigation — Overview, Tests, Trends, Comparison, Gallery views
- 10 themes + fully custom theme colours (Ocean, Sunset, Dracula, Cyberpunk, Forest, Rose, and more)
- Keyboard Shortcuts —
1-5switch views,j/knavigate tests,fsearch,eexport - Virtual Scroll — pagination for large test suites (500+ tests)
Feature screenshots (click to expand)
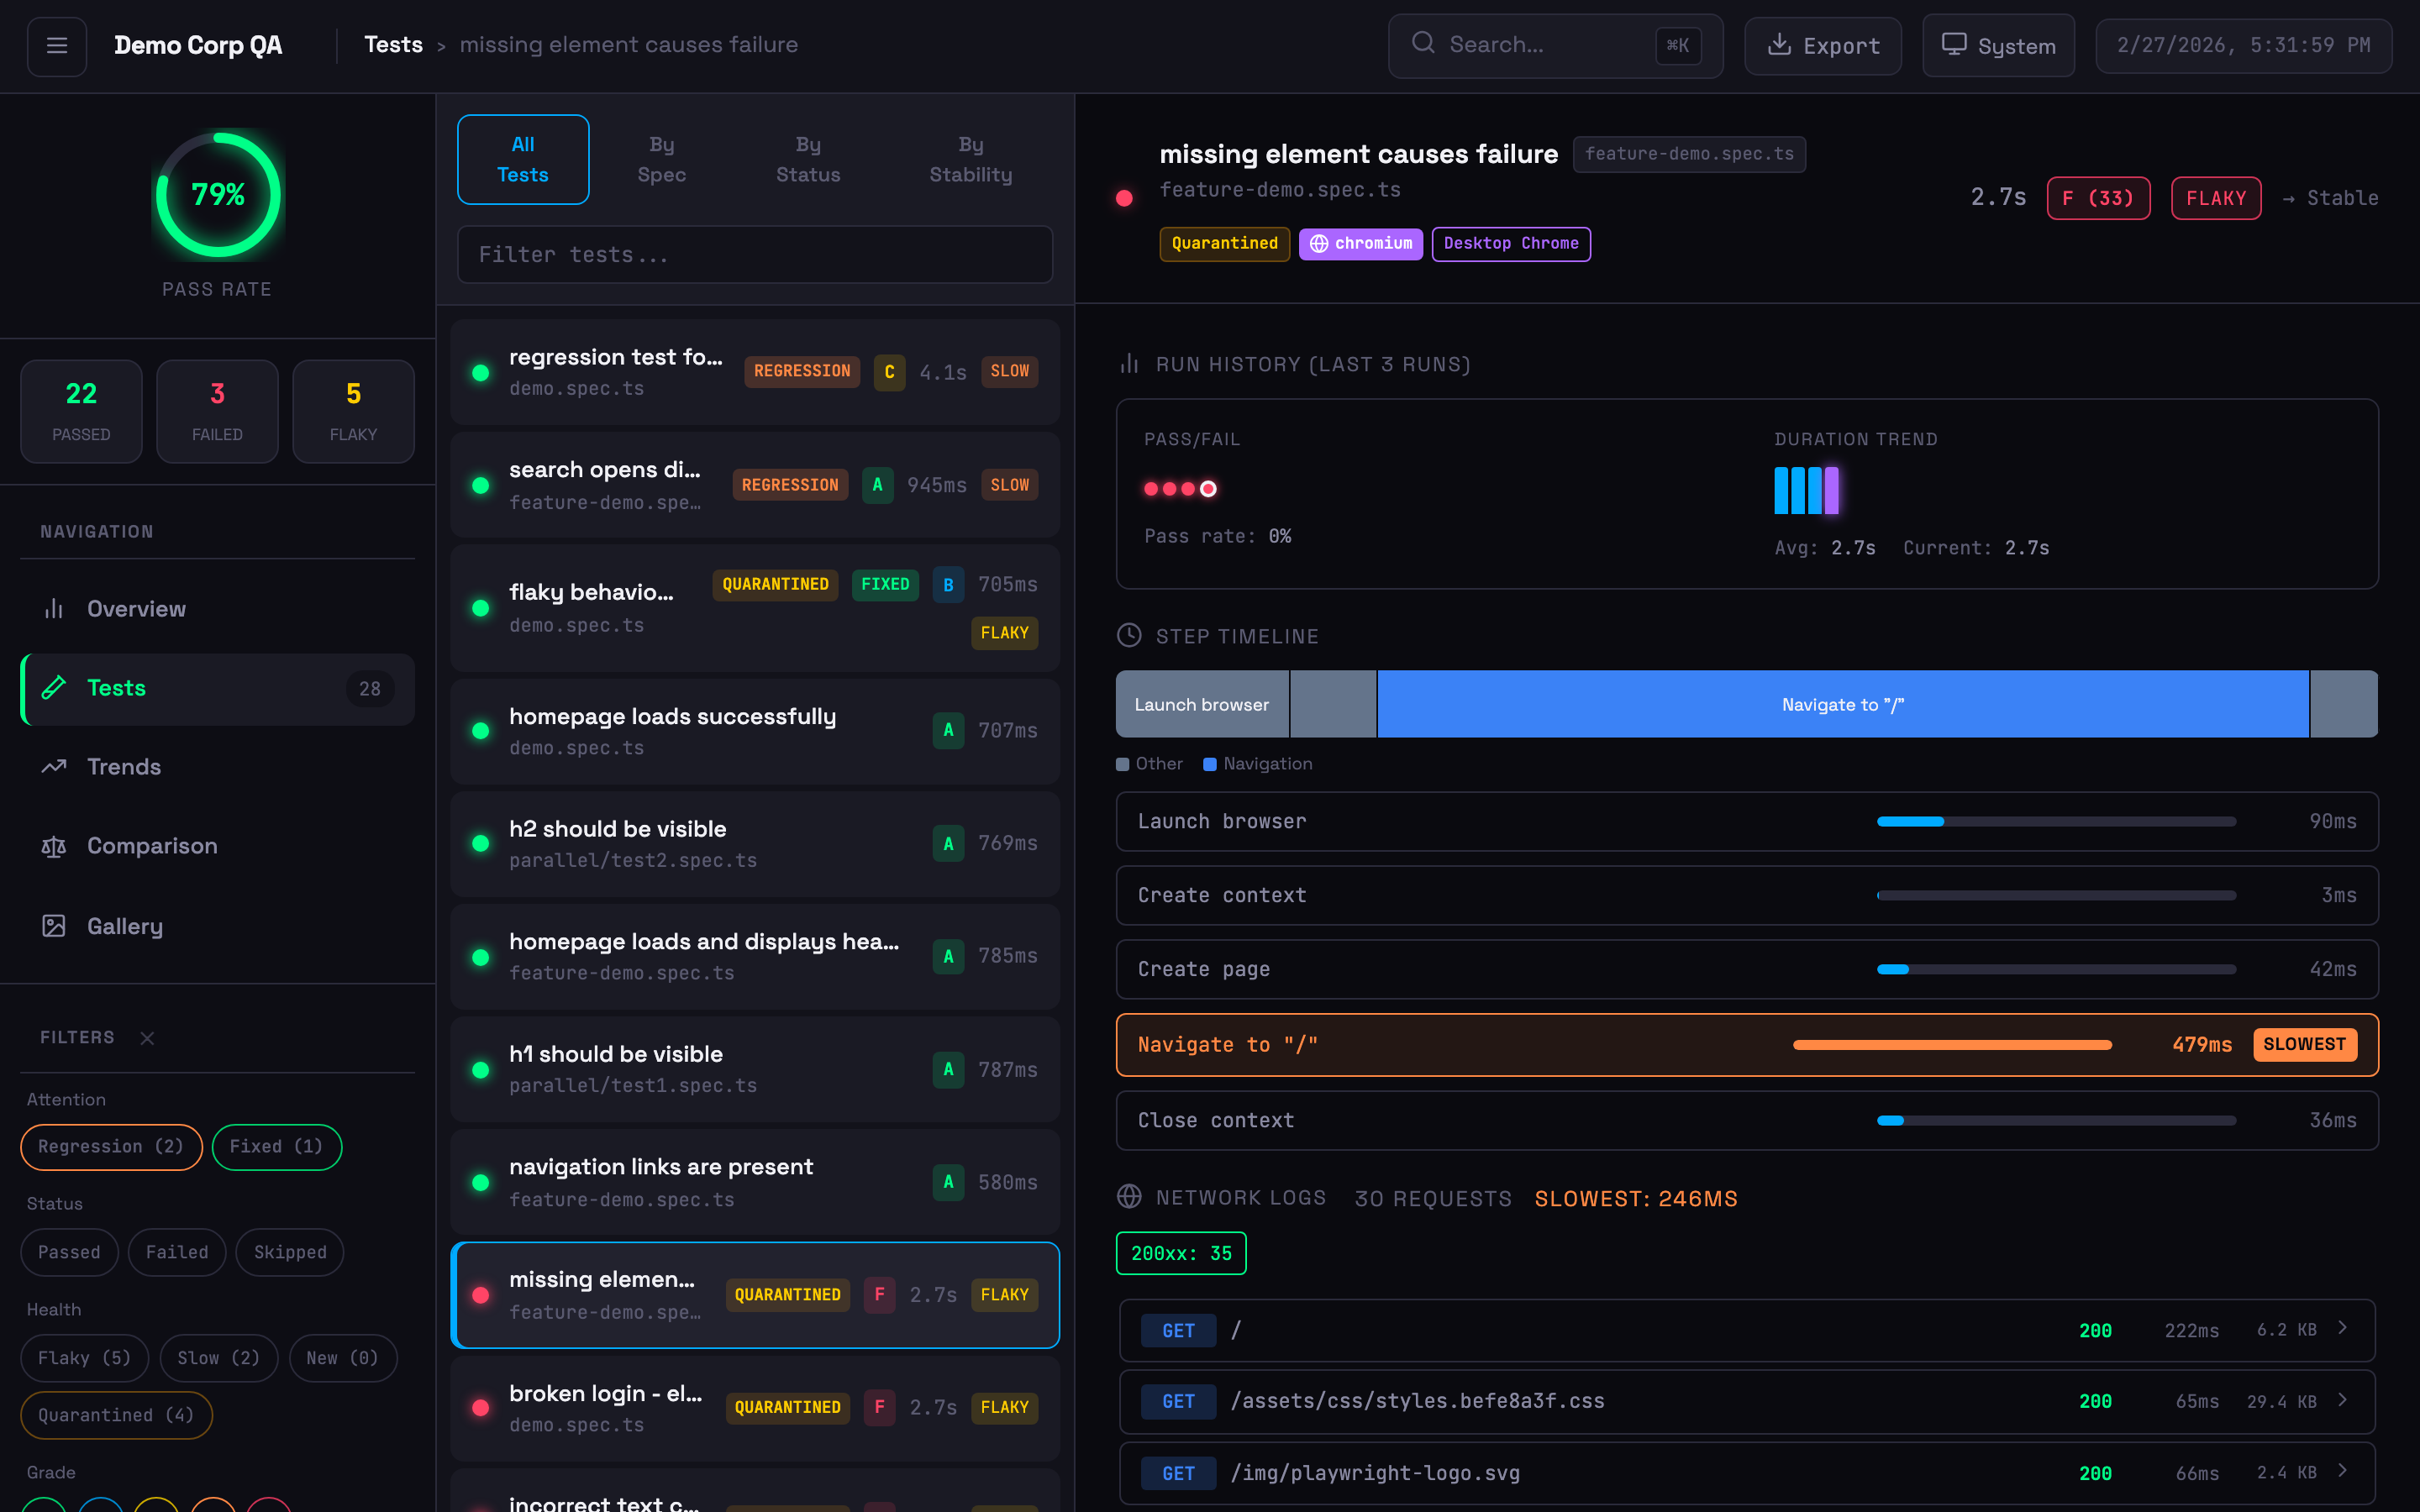 Expanded test card with step timeline, network logs, run history, and quarantine badge
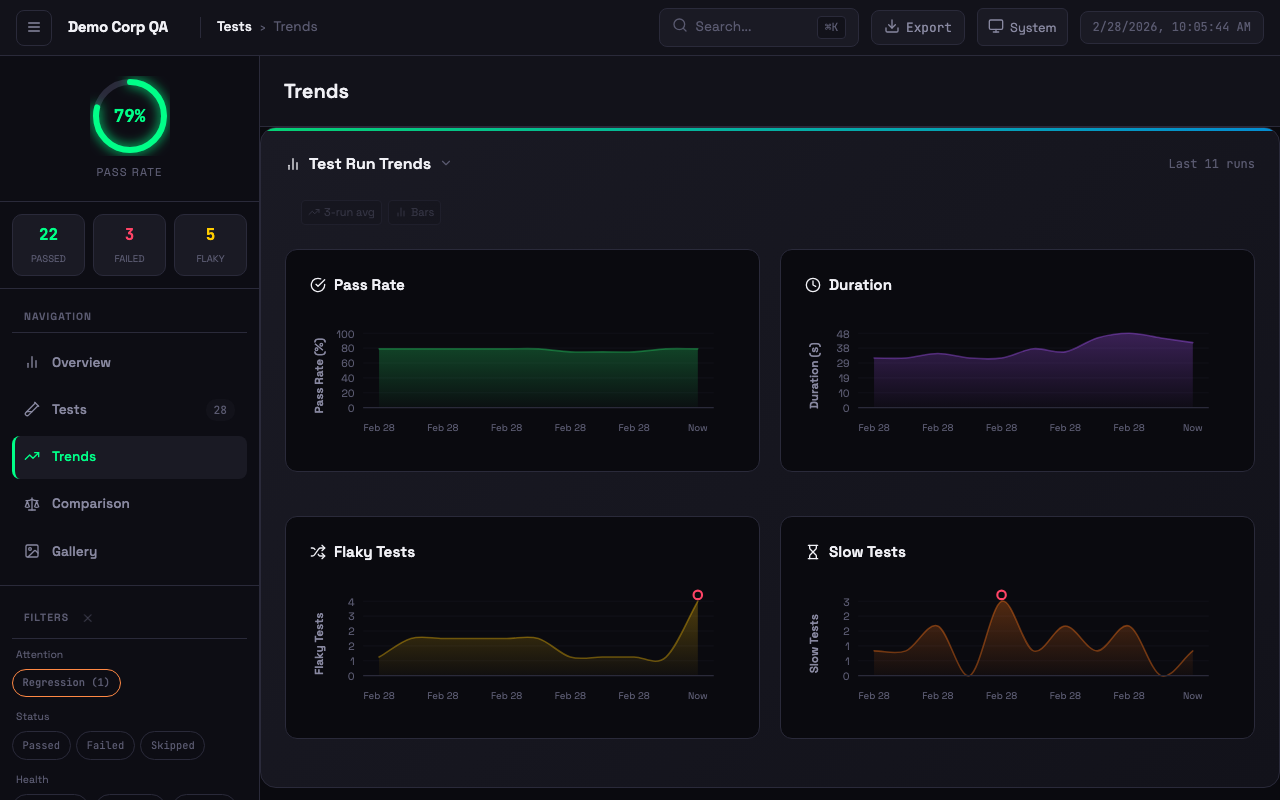 Interactive trend charts with pass rate, duration, flaky tests, and slow test tracking
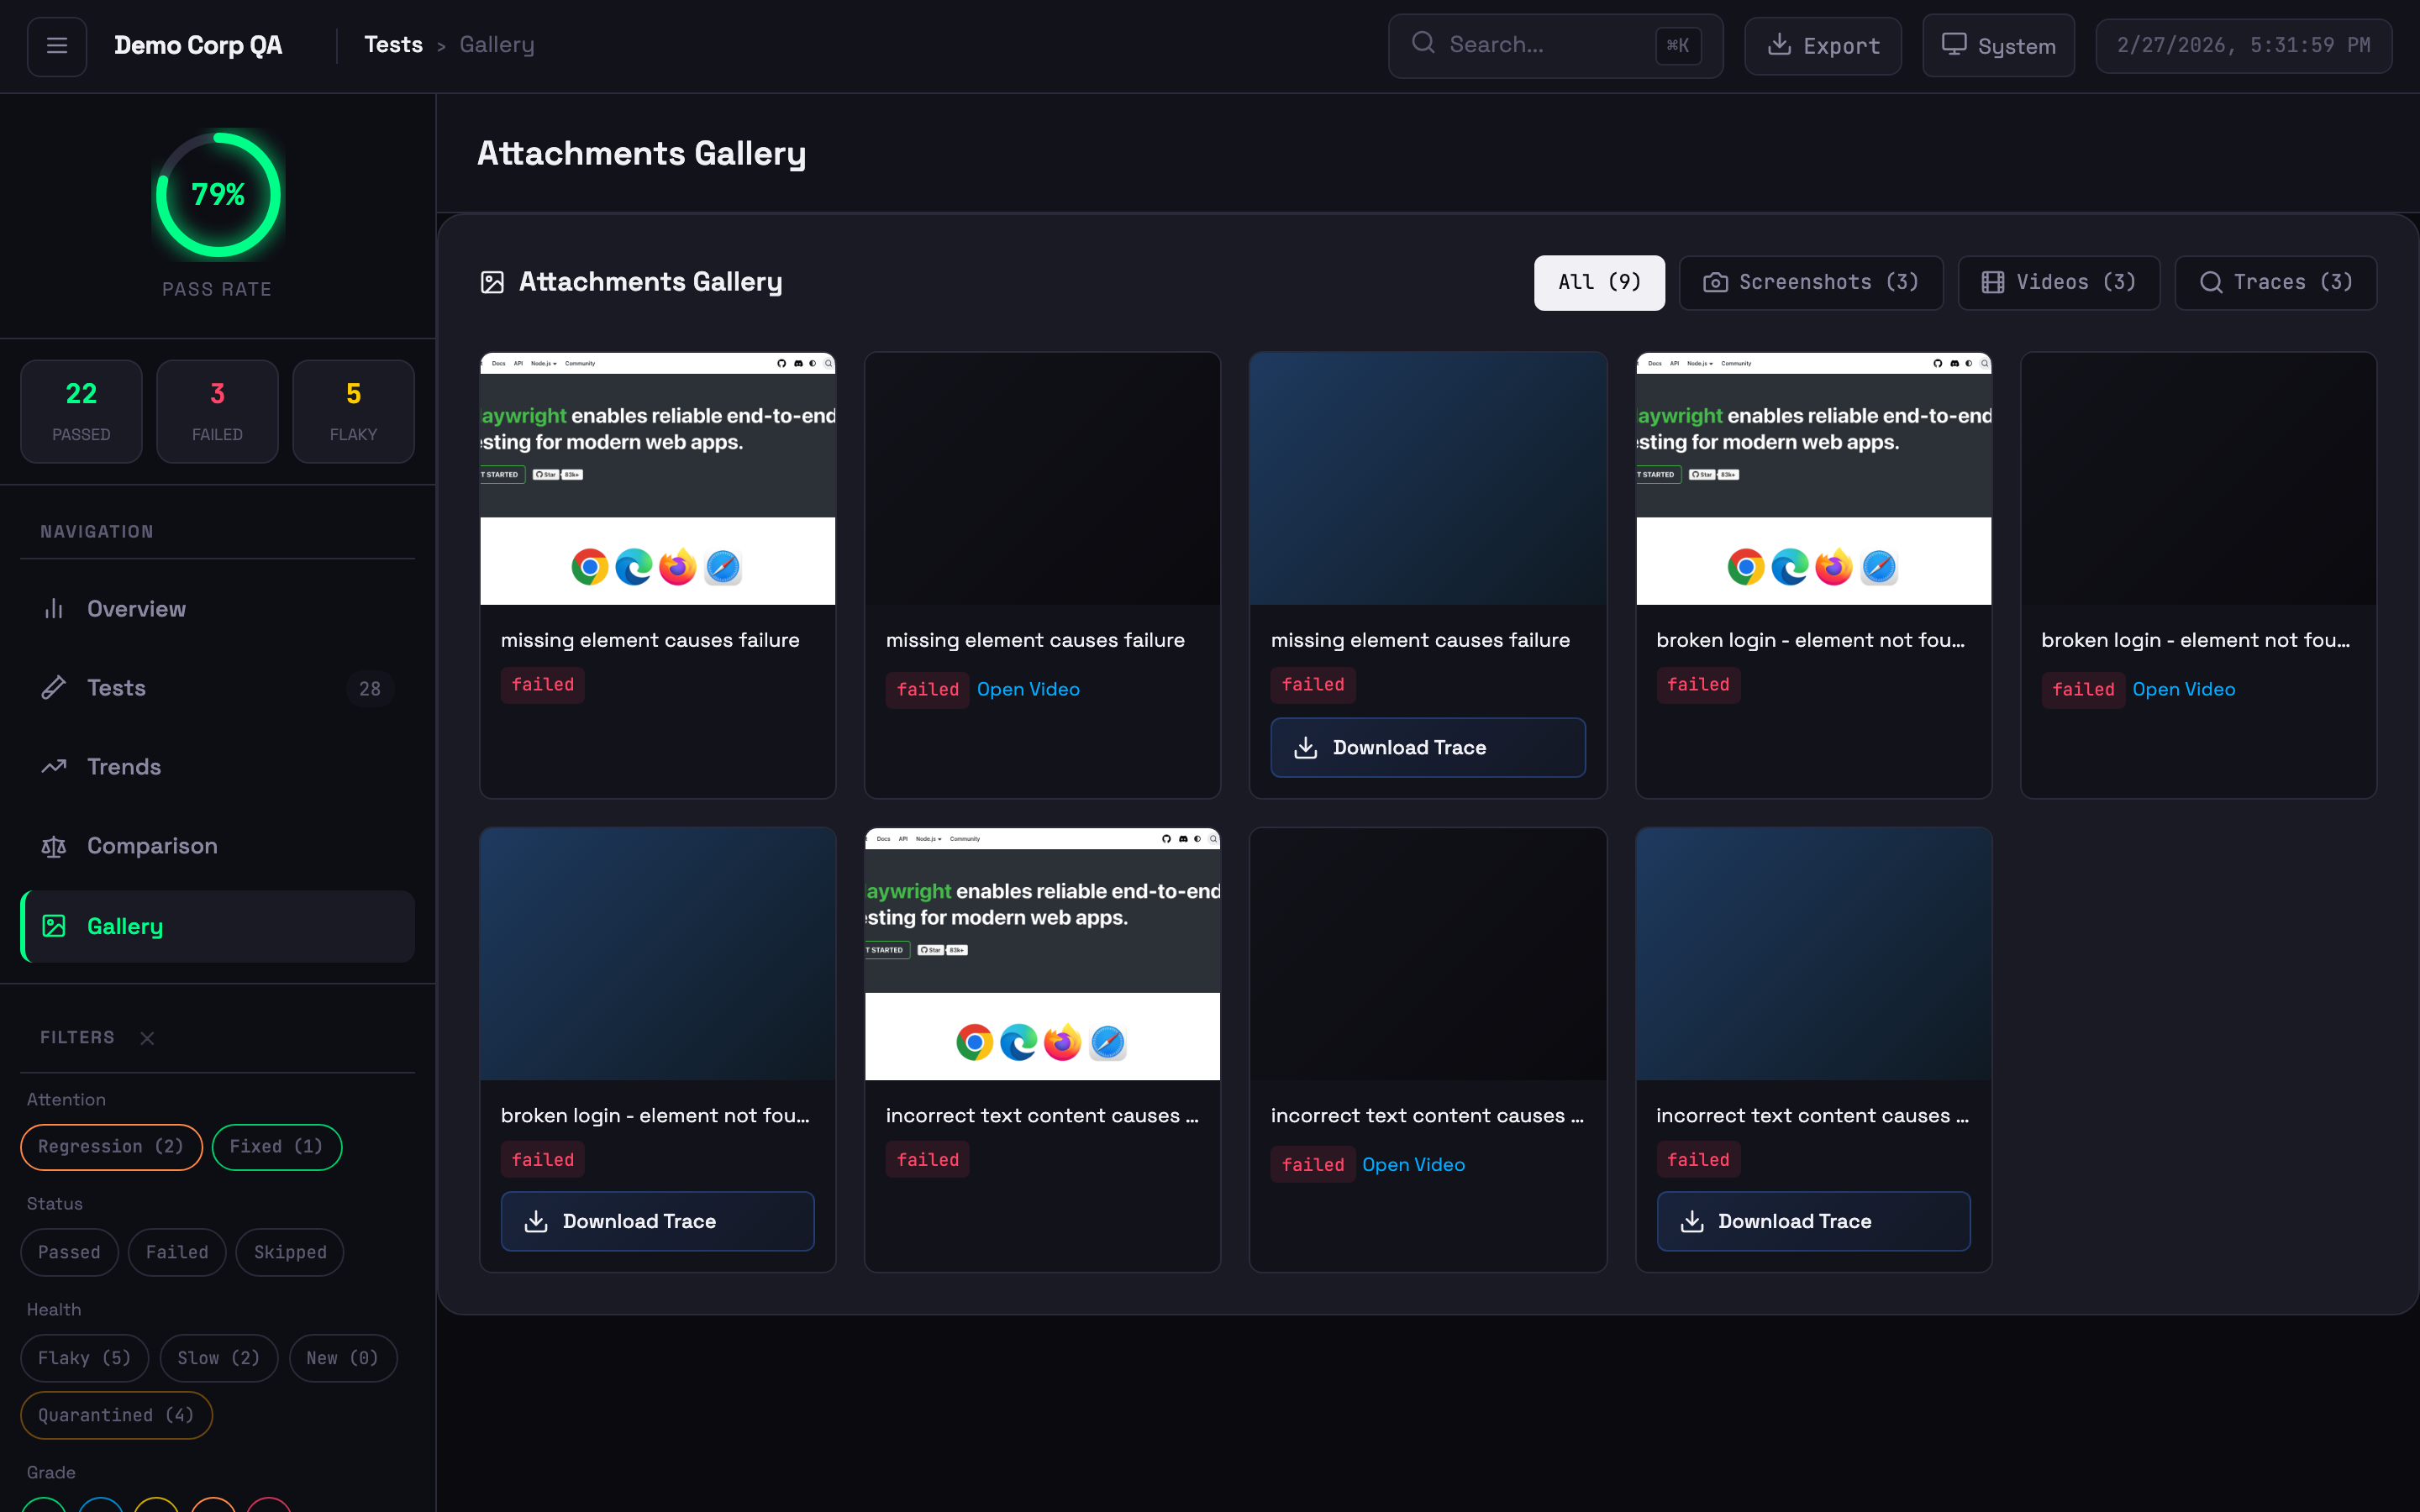 Visual grid of screenshots, videos, and trace files
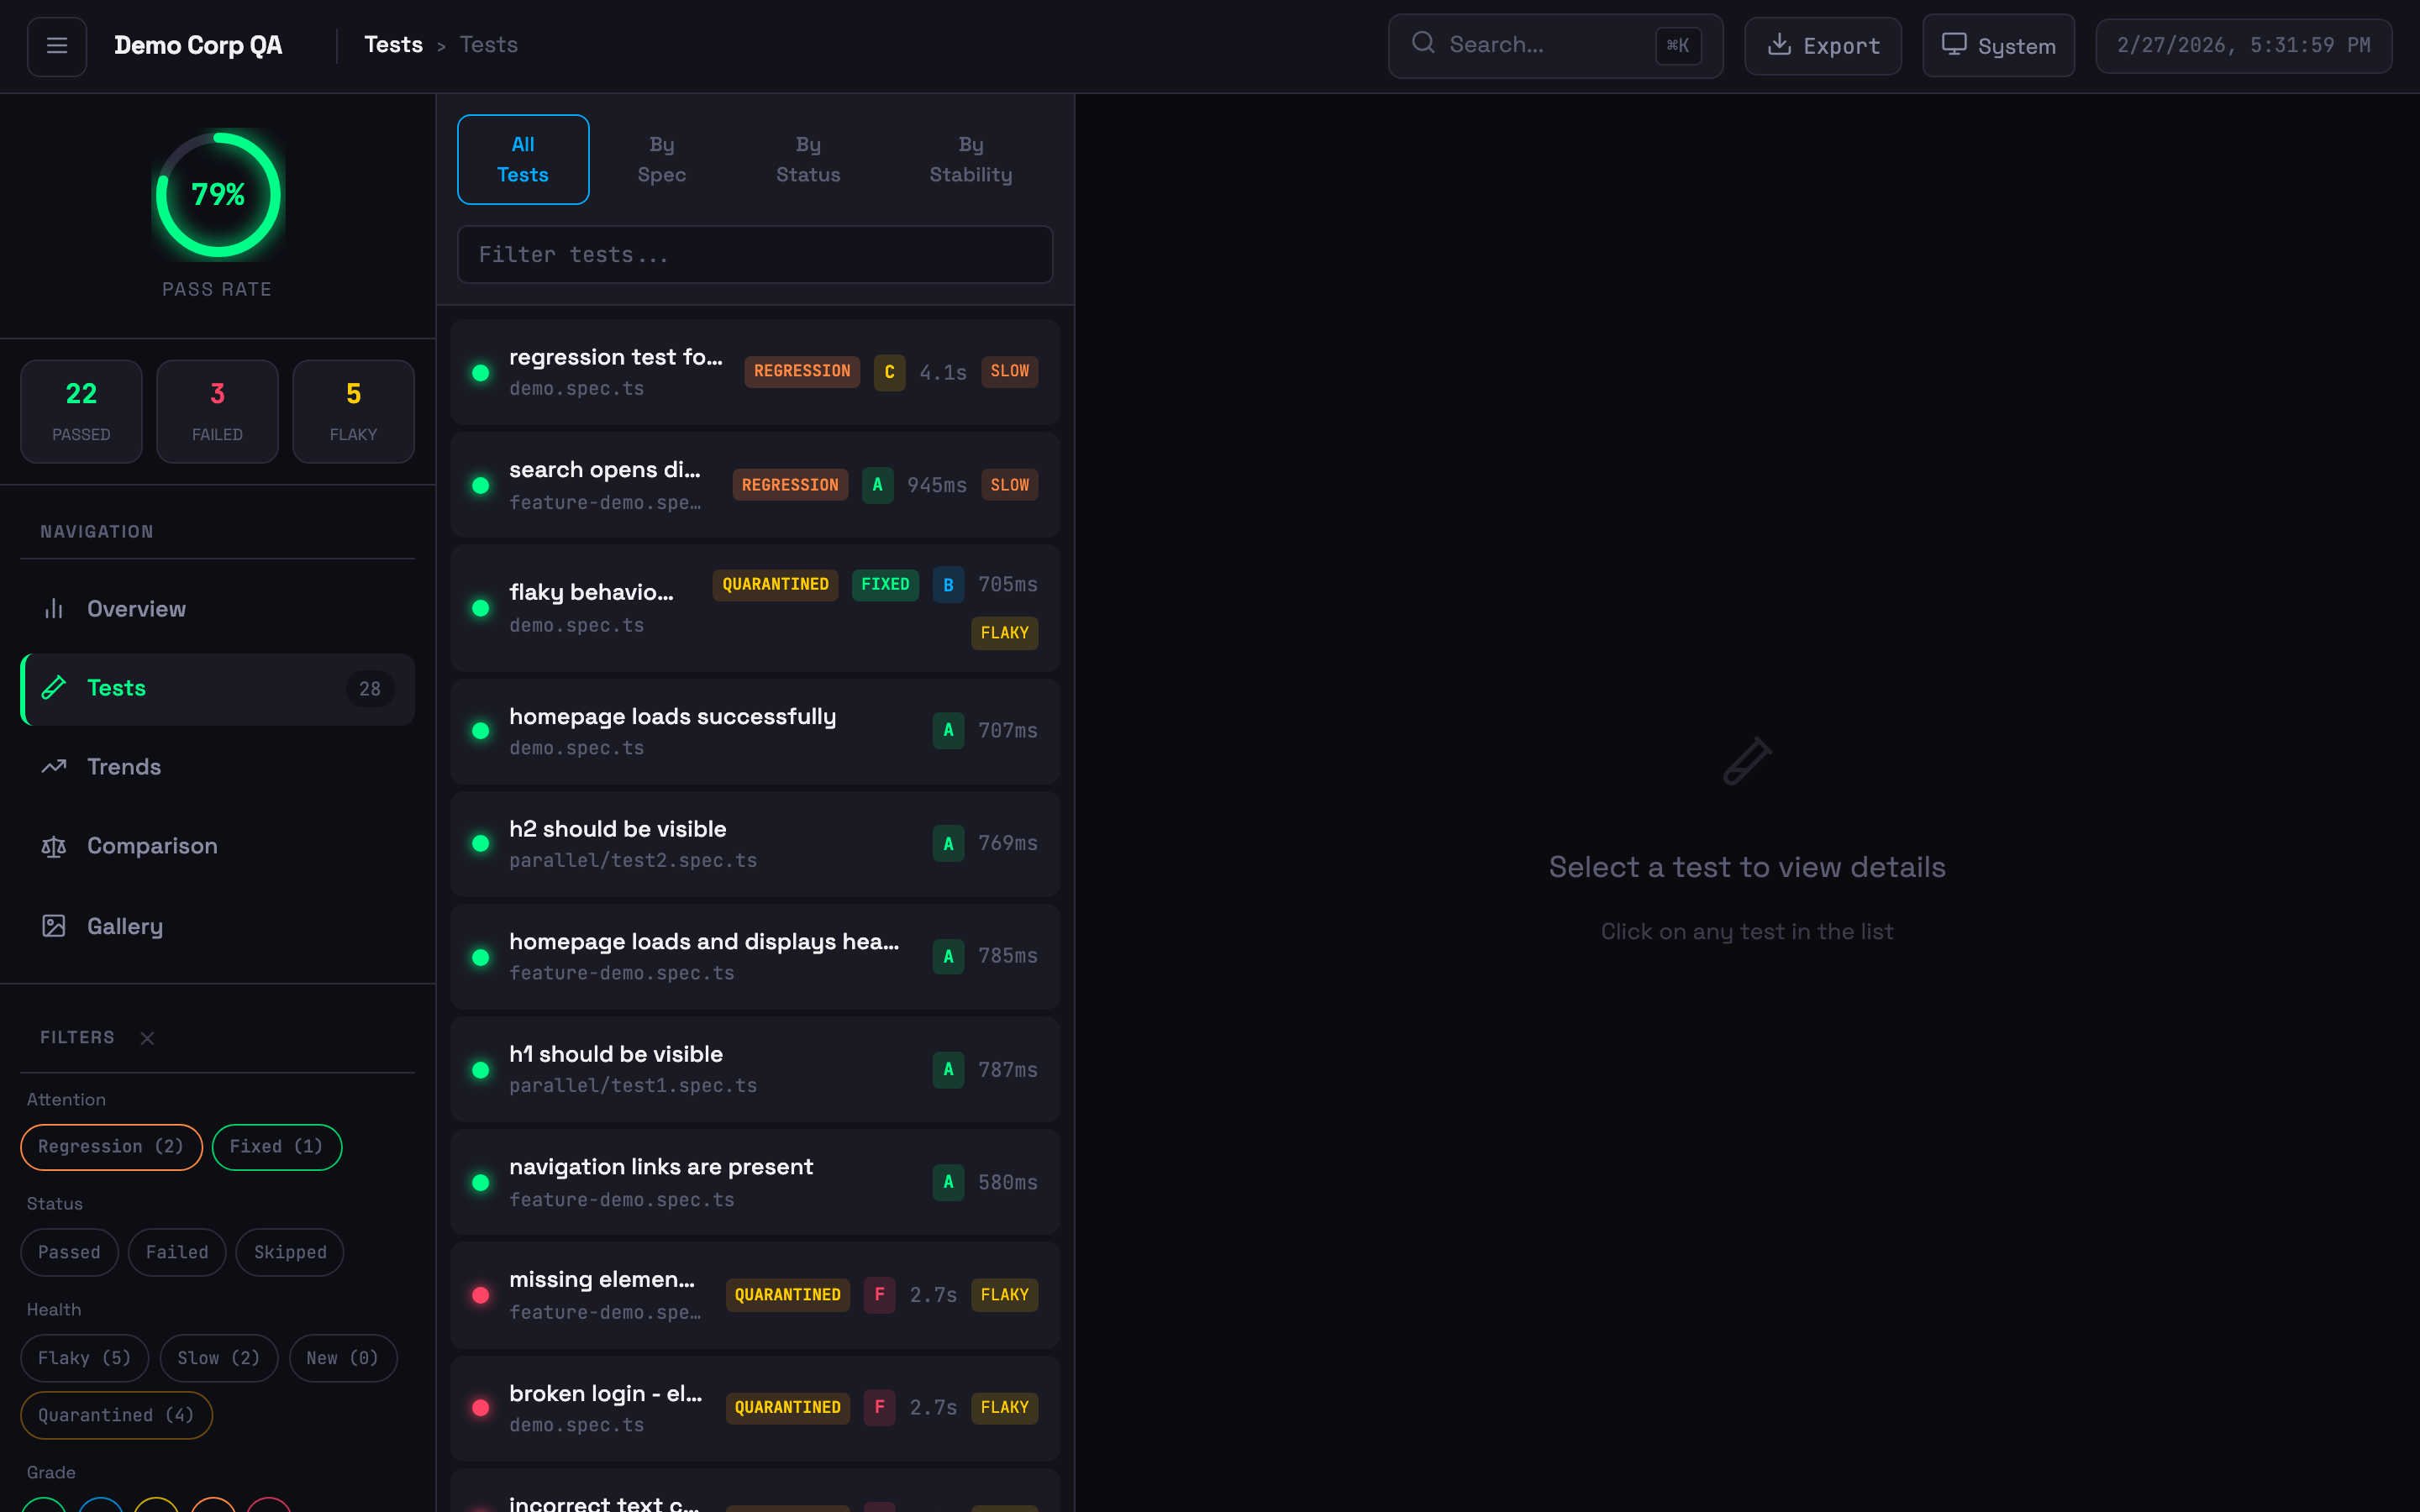 Test list with status badges, stability grades, quarantine indicators, and filtering
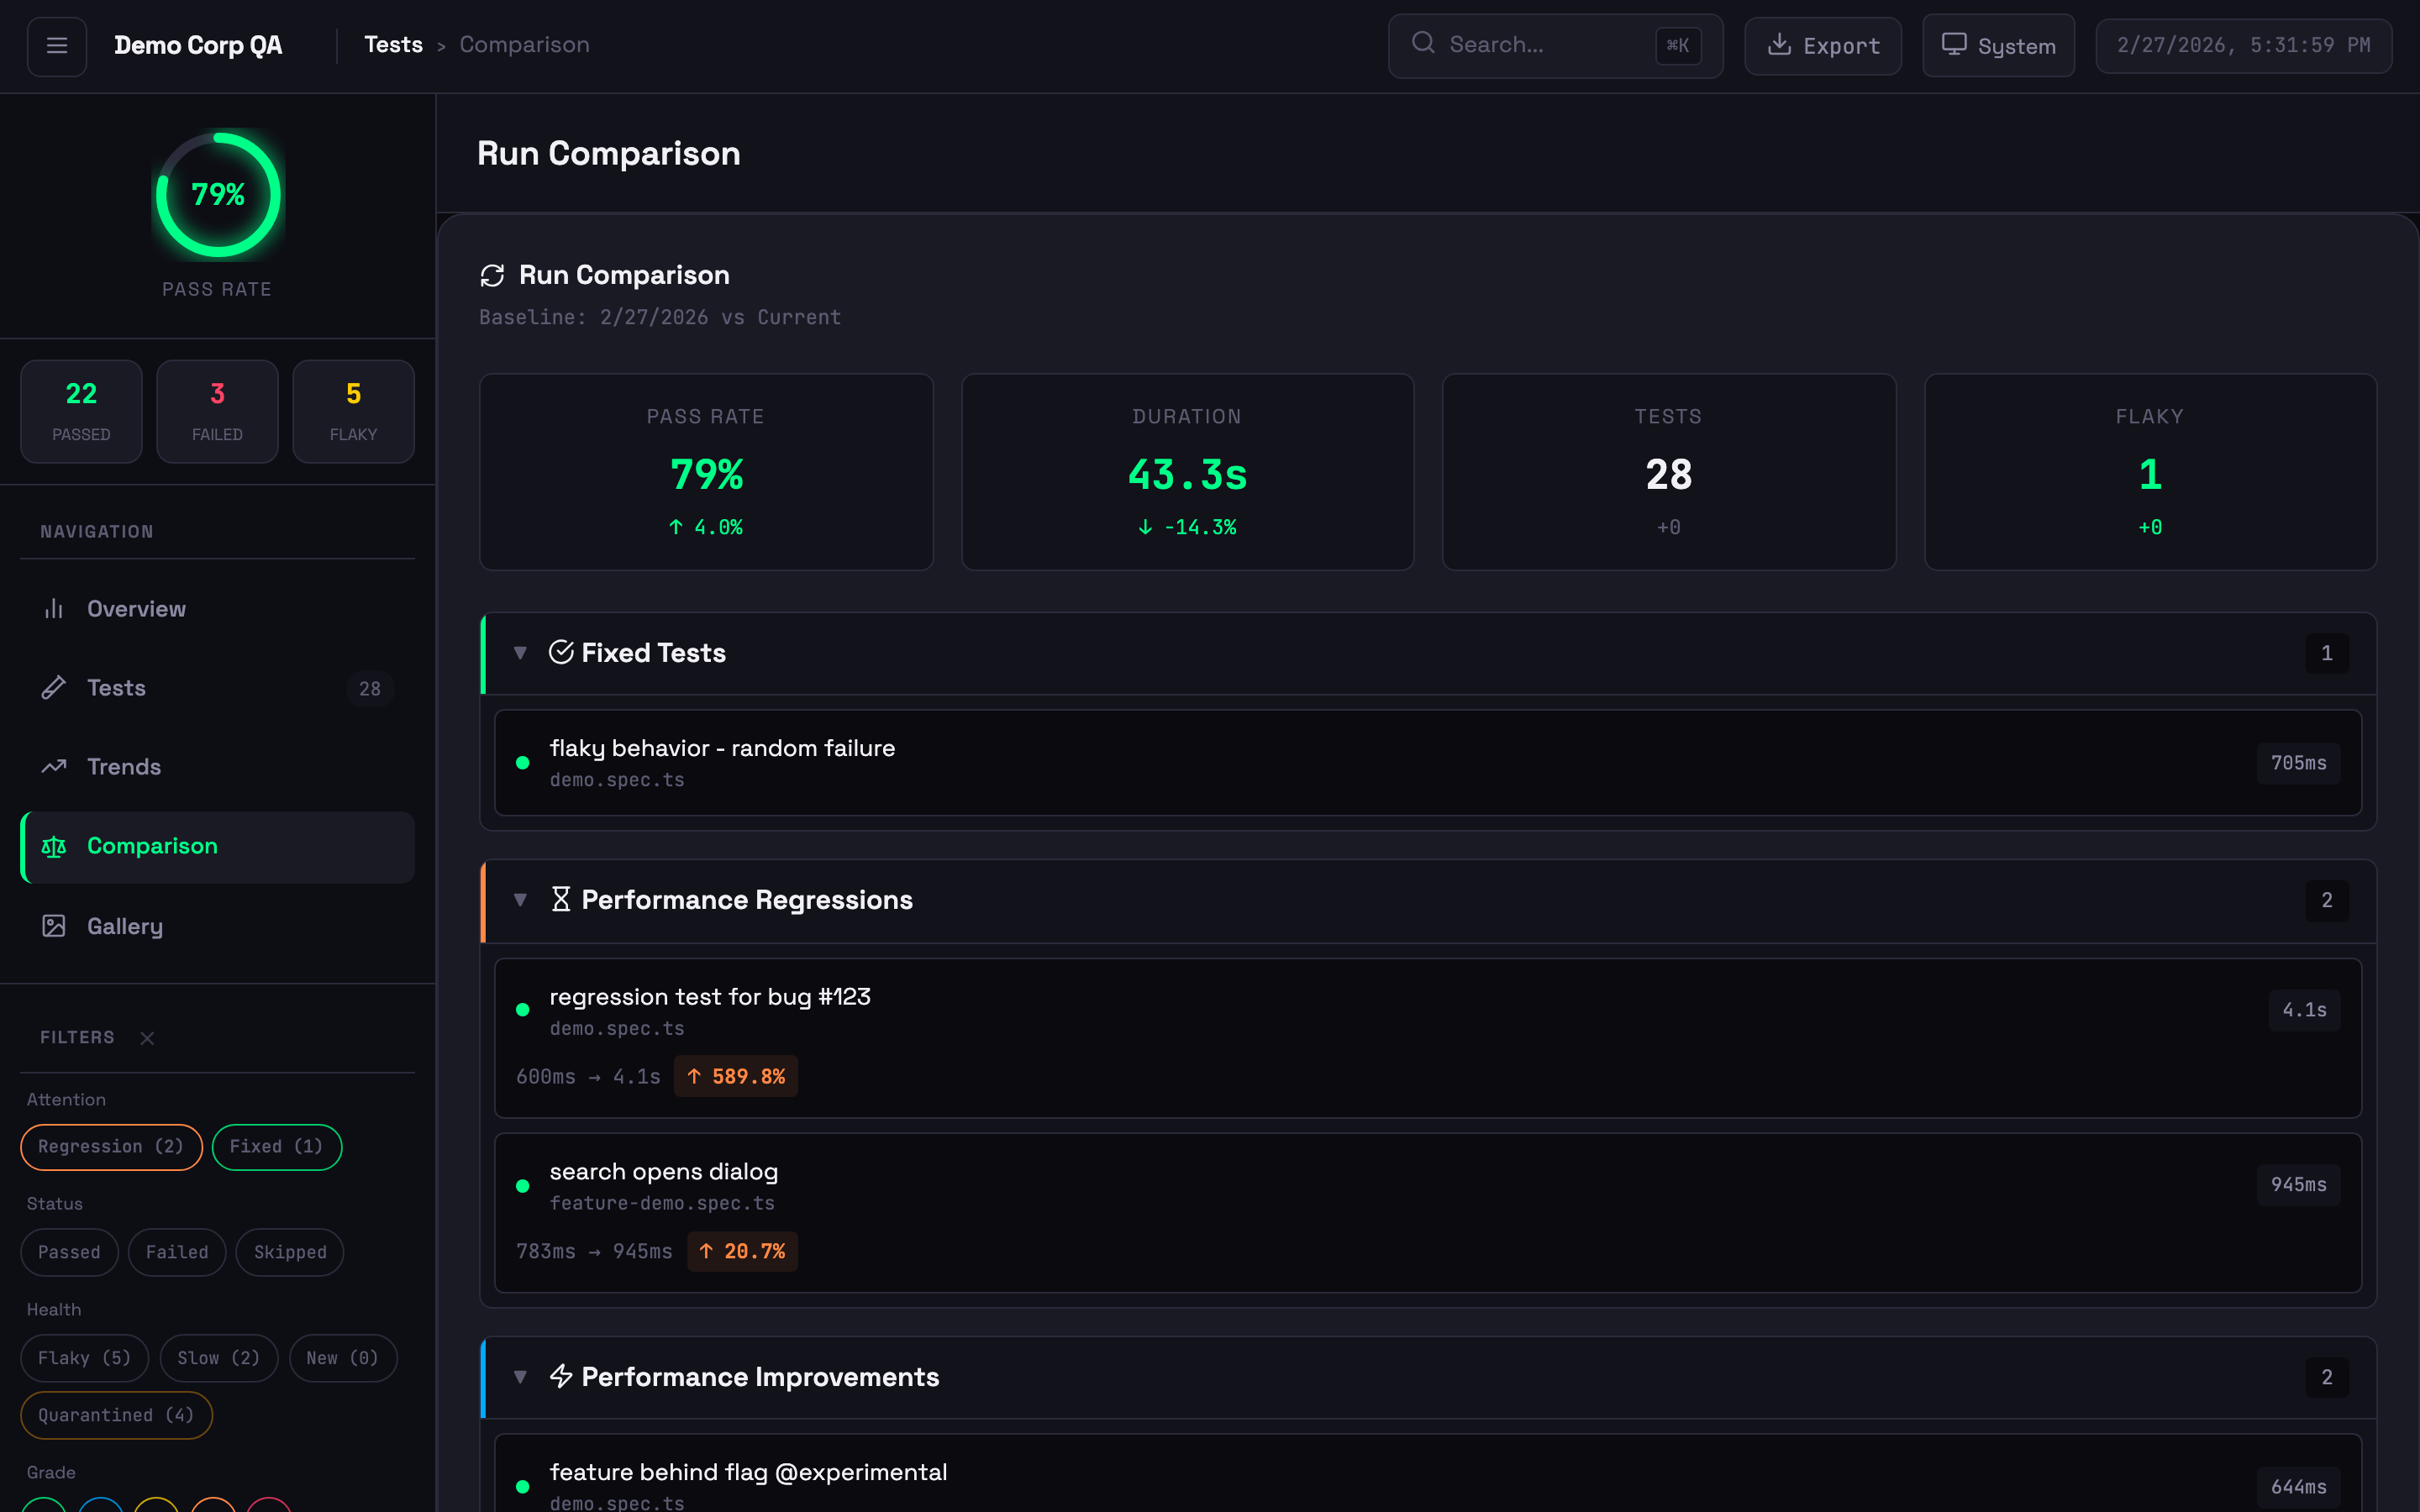 Run comparison showing new failures, performance changes, and baseline diffs
Tracks flakiness across runs, not within a single run:
| Playwright HTML Report | Evoveo Smart Reporter | |
|---|---|---|
| Scope | Single test run | Historical across multiple runs |
| Criteria | Fails then passes on retry | Failed 30%+ of the time historically |
| Use Case | Immediate retry success | Chronically unreliable tests |
Indicators: Stable (<10% failure) — Unstable (10-30%) — Flaky (>30%) — New (no history)
Composite score (0-100): Flakiness (40%) + Performance (30%) + Reliability (30%). Grades: A (90-100), B (80-89), C (70-79), D (60-69), F (<60). All configurable.
Full options reference (click to expand)
reporter: [
  ['evoveo-smart-reporter', {
    // Core
    outputFile: 'smart-report.html',
    historyFile: 'test-history.json',
    maxHistoryRuns: 10,
    performanceThreshold: 0.2,

    // Notifications
    slackWebhook: process.env.SLACK_WEBHOOK_URL,
    teamsWebhook: process.env.TEAMS_WEBHOOK_URL,

    // Feature flags (all default to true unless noted)
    enableRetryAnalysis: true,
    enableFailureClustering: true,
    enableStabilityScore: true,
    enableGalleryView: true,
    enableComparison: true,
    enableAIRecommendations: true,
    enableTrendsView: true,
    enableTraceViewer: true,
    enableHistoryDrilldown: false,
    enableAISuiteHealth: true,      // AI health summary (uses 1 AI request)
    enableNetworkLogs: true,

    // Step and path options
    filterPwApiSteps: false,
    relativeToCwd: false,

    // Multi-project
    projectName: 'ui-tests',
    runId: process.env.GITHUB_RUN_ID,

    // Network logging
    networkLogFilter: 'api.example.com',
    networkLogExcludeAssets: true,
    networkLogMaxEntries: 50,

    // Thresholds
    stabilityThreshold: 70,
    retryFailureThreshold: 3,
    baselineRunId: 'main-branch-baseline',
    thresholds: {
      flakinessStable: 0.1, flakinessUnstable: 0.3, performanceRegression: 0.2,
      stabilityWeightFlakiness: 0.4, stabilityWeightPerformance: 0.3, stabilityWeightReliability: 0.3,
      gradeA: 90, gradeB: 80, gradeC: 70, gradeD: 60,
    },

    // Report customisation & exports
    theme: { preset: 'default' },  // default, light, dark, high-contrast, ocean, sunset, dracula, cyberpunk, forest, rose
    exportPdf: false, exportJson: false, exportJunit: false,
    qualityGates: {},           // { minPassRate, maxFlakyRate, minStabilityGrade }
    quarantine: {},             // { enabled, outputFile, threshold }
    branding: {},               // { logo, title, footer, hidePoweredBy }

    // Advanced
    cspSafe: false,
    maxEmbeddedSize: 5 * 1024 * 1024,
  }],
]Set one environment variable — costs are billed by your provider (uses small, fast models with short prompts):
export ANTHROPIC_API_KEY=your-key    # Claude (used first if multiple are set)
export OPENAI_API_KEY=your-key       # OpenAI
export GEMINI_API_KEY=your-key       # Google Gemini
If no API key is set, AI analysis is skipped. Every failed test still gets a Copy AI Prompt button for use with any AI assistant.
Feature configuration examples (click to expand)
reporter: [['evoveo-smart-reporter', {
  theme: { preset: 'dracula' },  // ocean, sunset, dracula, cyberpunk, forest, rose
}]]reporter: [['evoveo-smart-reporter', { exportPdf: true }]]Generates PDF reports in 3 variants: Corporate, Minimal, Dark.
reporter: [['evoveo-smart-reporter', {
  qualityGates: { minPassRate: 95, maxFlakyRate: 5, minStabilityGrade: 'B' },
}]]
Or as a standalone CLI: npx evoveo-smart-reporter gate --min-pass-rate 95 --max-flaky-rate 5
Exit codes: 0 = passed, 1 = gate failed (use in CI to block deploys).
reporter: [['evoveo-smart-reporter', {
  quarantine: { enabled: true, outputFile: '.smart-quarantine.json', threshold: 0.3 },
}]]reporter: [['evoveo-smart-reporter', {
branding: { title: 'Acme Corp Test Report', footer: 'Generated by QA Team' },
theme: { primary: '#6366f1', accent: '#8b5cf6', success: '#22c55e', error: '#ef4444', warning: '#f59e0b' },
}]]reporter: [['evoveo-smart-reporter', { exportJson: true, exportJunit: true }]]reporter: [['evoveo-smart-reporter', { filterPwApiSteps: true }]]Hides verbose page.click(), page.fill() steps — only named test.step() entries appear.
reporter: [['evoveo-smart-reporter', {
  projectName: 'api',
  historyFile: 'reports/{project}/history.json',
}]]History must persist between runs for flakiness detection and trends to work.
The reporter automatically detects GitHub Actions, GitLab CI, CircleCI, Jenkins, Azure DevOps, and Buildkite. Branch, commit SHA, and build ID are displayed in the report header.
# GitHub Actions example
- run: npx playwright test
  continue-on-error: true
- run: npx evoveo-smart-reporter gate --min-pass-rate 95 --max-flaky-rate 5
# Exits non-zero if gates fail — blocks the pipelineSet runId for consistent history across parallel shards:
reporter: [['evoveo-smart-reporter', { runId: process.env.GITHUB_RUN_ID }]]Merge history from multiple machines:
npx evoveo-smart-reporter-merge-history shard1/test-history.json shard2/test-history.json -o merged-history.json --max-runs 10CI cache examples — GitHub Actions, GitLab, CircleCI, Azure DevOps (click to expand)
- uses: actions/cache@v4
  with:
    path: test-history.json
    key: test-history-${{ github.ref }}
    restore-keys: test-history-
- run: npx playwright test
- uses: actions/cache/save@v4
  if: always()
  with:
    path: test-history.json
key: test-history-${{ github.ref }}-${{ github.run_id }}test:
cache:
key: test-history-$CI_COMMIT_REF_SLUG
paths: [test-history.json]
policy: pull-push
script: npx playwright test- restore_cache:
keys: [test-history-{{ .Branch }}, test-history-]
- run: npx playwright test
- save_cache:
key: test-history-{{ .Branch }}-{{ .Revision }}
paths: [test-history.json]steps:
- task: Cache@2
inputs:
key: 'test-history | "$(Build.SourceBranchName)"'
restoreKeys: 'test-history |'
path: test-history.json
- script: npx playwright test
continueOnError: true
- task: PublishPipelineArtifact@1
inputs:
targetPath: smart-report.html
artifact: playwright-smart-report
condition: always()Inline Viewer: Click View on any test with traces — film strip, actions panel, before/after screenshots, network waterfall, console messages, errors.
Local Server: npx evoveo-smart-reporter-serve smart-report.html — serves with full trace viewer support (no file:// CORS issues).
CLI Viewer: npx evoveo-smart-reporter-view-trace ./traces/my-test-trace-0.zip
Network Logs: Automatically extracted from Playwright trace files. Requires tracing enabled:
use: { trace: 'retain-on-failure' } // or 'on'@slow |
@fixme/@fix |
@skip |
@issue/@bug |
@todo |
@flaky |
@fail |
Custom |
|---|---|---|---|---|---|---|---|
| Amber | Pink | Indigo | Red | Blue | Orange | Red | Grey |
test('payment flow', async ({ page }) => {
  test.slow();
  test.info().annotations.push({ type: 'issue', description: 'JIRA-123' });
});For environments with strict Content Security Policy (e.g., Jenkins):
reporter: [['evoveo-smart-reporter', { cspSafe: true }]]Generates companion .css and .js files instead of inline tags. System fonts used instead of Google Fonts.
Works with Playwright + Cucumber frameworks:
import { defineBddConfig } from 'playwright-bdd';
const testDir = defineBddConfig({ features: 'features/**/*.feature', steps: 'steps/**/*.ts' });
export default defineConfig({ testDir, reporter: [['evoveo-smart-reporter']] });Common questions and issues (click to expand)
Is this really free? Yes. Everything is Apache-2.0-licensed — no tiers, no license keys. AI analysis is the only feature with an external cost (billed by your provider via your own API key).
RangeError with large test suites? Fixed in v1.0.6. Update: npm install evoveo-smart-reporter@latest
Different flakiness than Playwright's HTML report? They use different methodologies — see Flakiness Detection above.
Report too large or browser hangs? Enable cspSafe: true to save attachments as files, or reduce maxHistoryRuns. Use maxEmbeddedSize to control the inline trace threshold.
| Problem | Cause | Fix |
|---|---|---|
| No history data | History file missing or wrong path | Check historyFile path, use CI caching |
| No network logs | Tracing not enabled | Add trace: 'retain-on-failure' to config |
| No AI suggestions | No AI API key set | Set ANTHROPIC_API_KEY, OPENAI_API_KEY, or GEMINI_API_KEY |
| Mixed project metrics | Shared history file | Use projectName to isolate |
| Quality gate not failing CI | Gate not run as separate step | Run npx evoveo-smart-reporter gate as its own CI step |
This repo doubles as a QA Spec Kit — 72 AI agent skills + the Loop Engineering methodology that helps any AI IDE write better tests, debug faster, and ship with confidence.
Works with: Claude Code, GitHub Copilot, Cursor, Windsurf, Devin, and any IDE that reads AGENTS.md.
# Windows
pwsh scripts/setup-agents.ps1 -Project
# macOS / Linux
bash scripts/setup-agents.sh --projectFull setup guide: QA-SPEC-KIT.md
npm install
npm run build
npm testEvoveo Smart Reporter is free and open source — every feature included, no paywalls. Building and maintaining it takes real time and money. If this tool saves your team hours every sprint, consider sponsoring its continued development.


Sponsorship funds: maintenance, new features, CI infrastructure, documentation, and demo deployments.
See SPONSORS.md for sponsor tiers and details.
Apache License 2.0