2014 06 27 google cloud tracing explained
layout: blog_post title: Google Cloud Tracing Explained category: other summery: At Google I/O 2014, Google introduced a performance monitoring solution called Google Cloud Traces. This post explains what it is.
At Google I/O 2014, Google introduced many new features of their cloud platform. I think Google impressed all of us with these new features. Google Cloud Tracing is one of the things I am very excited about. It is a way to identify performance issues in our apps in production. Actually, I am not exactly sure which languages and frameworks it will support at the moment. But, it's really impressive.
Google Cloud Tracing is still invite only. This article is based on the Google I/O keynote and my experience based on building a cloud monitoring solution.
First, you can get a list of requests coming into your app. Then you can search and filter them.
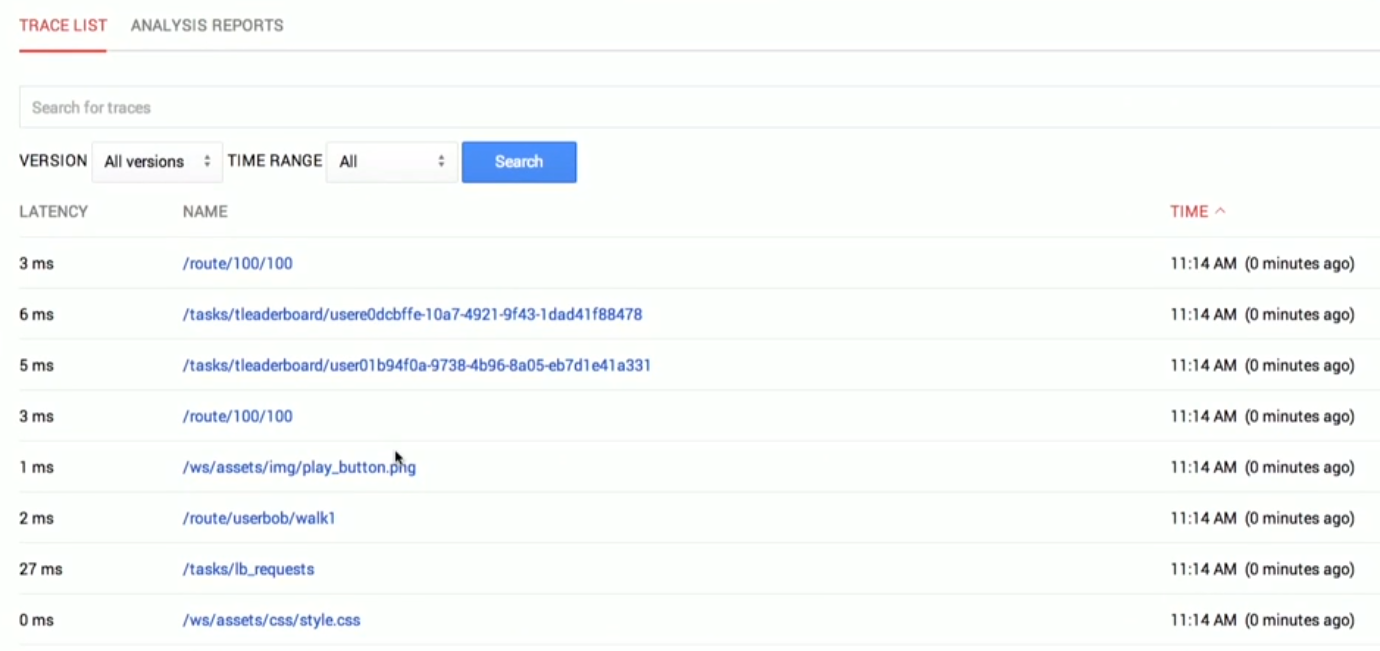
After that, you can select a request and see what's really happening behind the scenes.
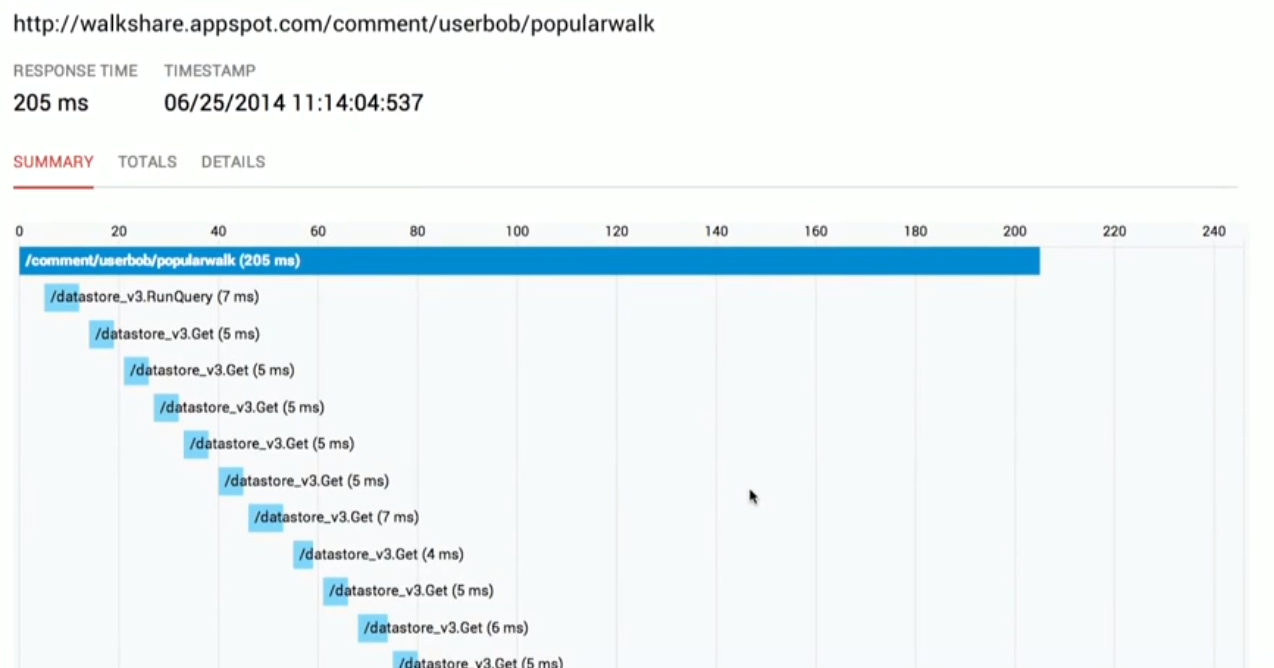
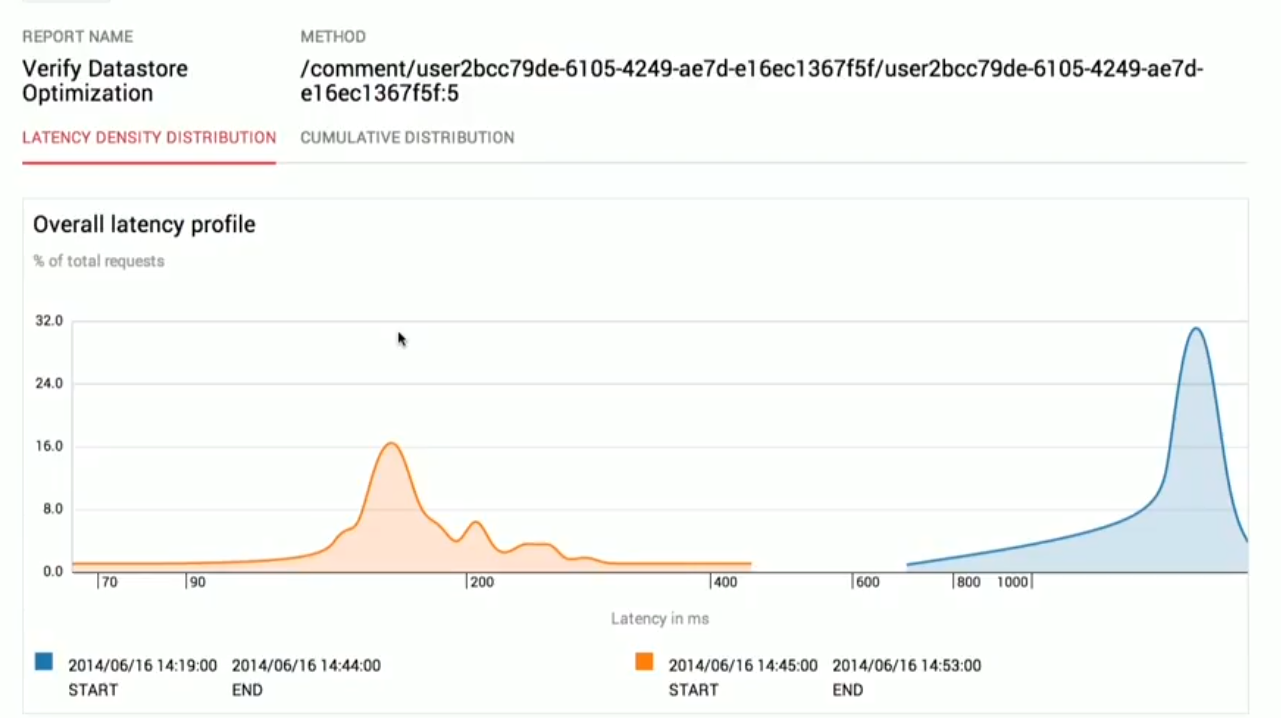
Then you can apply a fix and see the improvement.
Pretty amazing, right? Yeah. This is nicely integrated into their cloud IDE and the development workflow. That's really neat.
But I have a couple of issues.
- We have to search for requests and find costly requests manually. It would be better if we could least sort them by response time.
- They said that we can fix an issue for one user and see how it applies to all users. Actually, that's a marketing trick. Trace is for a single user, so when we fix the code and deploy again, the fix will naturally apply to all users.
I've built a performance monitoring platform for MeteorJS called Kadira, and it has a tracing capability. We tried to do it in a very user-friendly manner and help developers to find the issues that really matter. Let me show you.
Actually, this is not a feature unique to Kadira. NewRelic and some other platforms started doing similar tracing a few years ago.
First, you'll see a real-time graph of the response time of your app. You can also group them by Meteor Method calls.
Meteor Method is similar to HTTP requests in other applications.
Then, when you click on a point on the graph, it will show you a few sampled traces, as shown below.
Then you can click and analyze a trace. In the following trace, it takes a considerable amount of time to send an email.
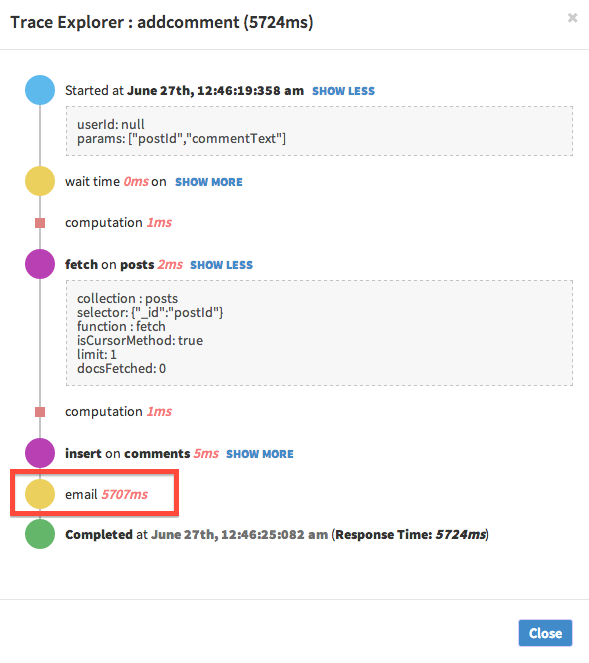
As a fix, we can ask Meteor to do it in the background.
After the fix, we can clearly see the difference by looking at the real-time response time graph.
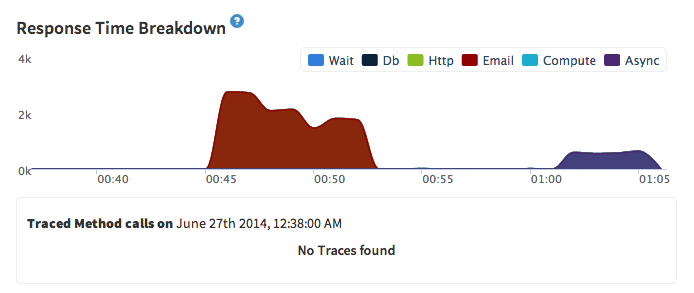
You can also look at a trace again and confirm the fix.
Google Cloud Tracing is really good because it's directly integrated into the Google Cloud platform. And I hope they'll charge relatively less compared with other providers, such as NewRelic. That's a big win for developers.
Google can improve Cloud Tracing in some ways and help developers to get the most out of it. Actually, they are minor changes. I hope this is just the start. Google Cloud Tracing will be improved a lot in the next few iterations.
Good job, Google! You keep impressing us with these kinds of services.