3 system performance
navTitle: System Performance navSubTitle: Monitor system performance title: Monitor System Performance
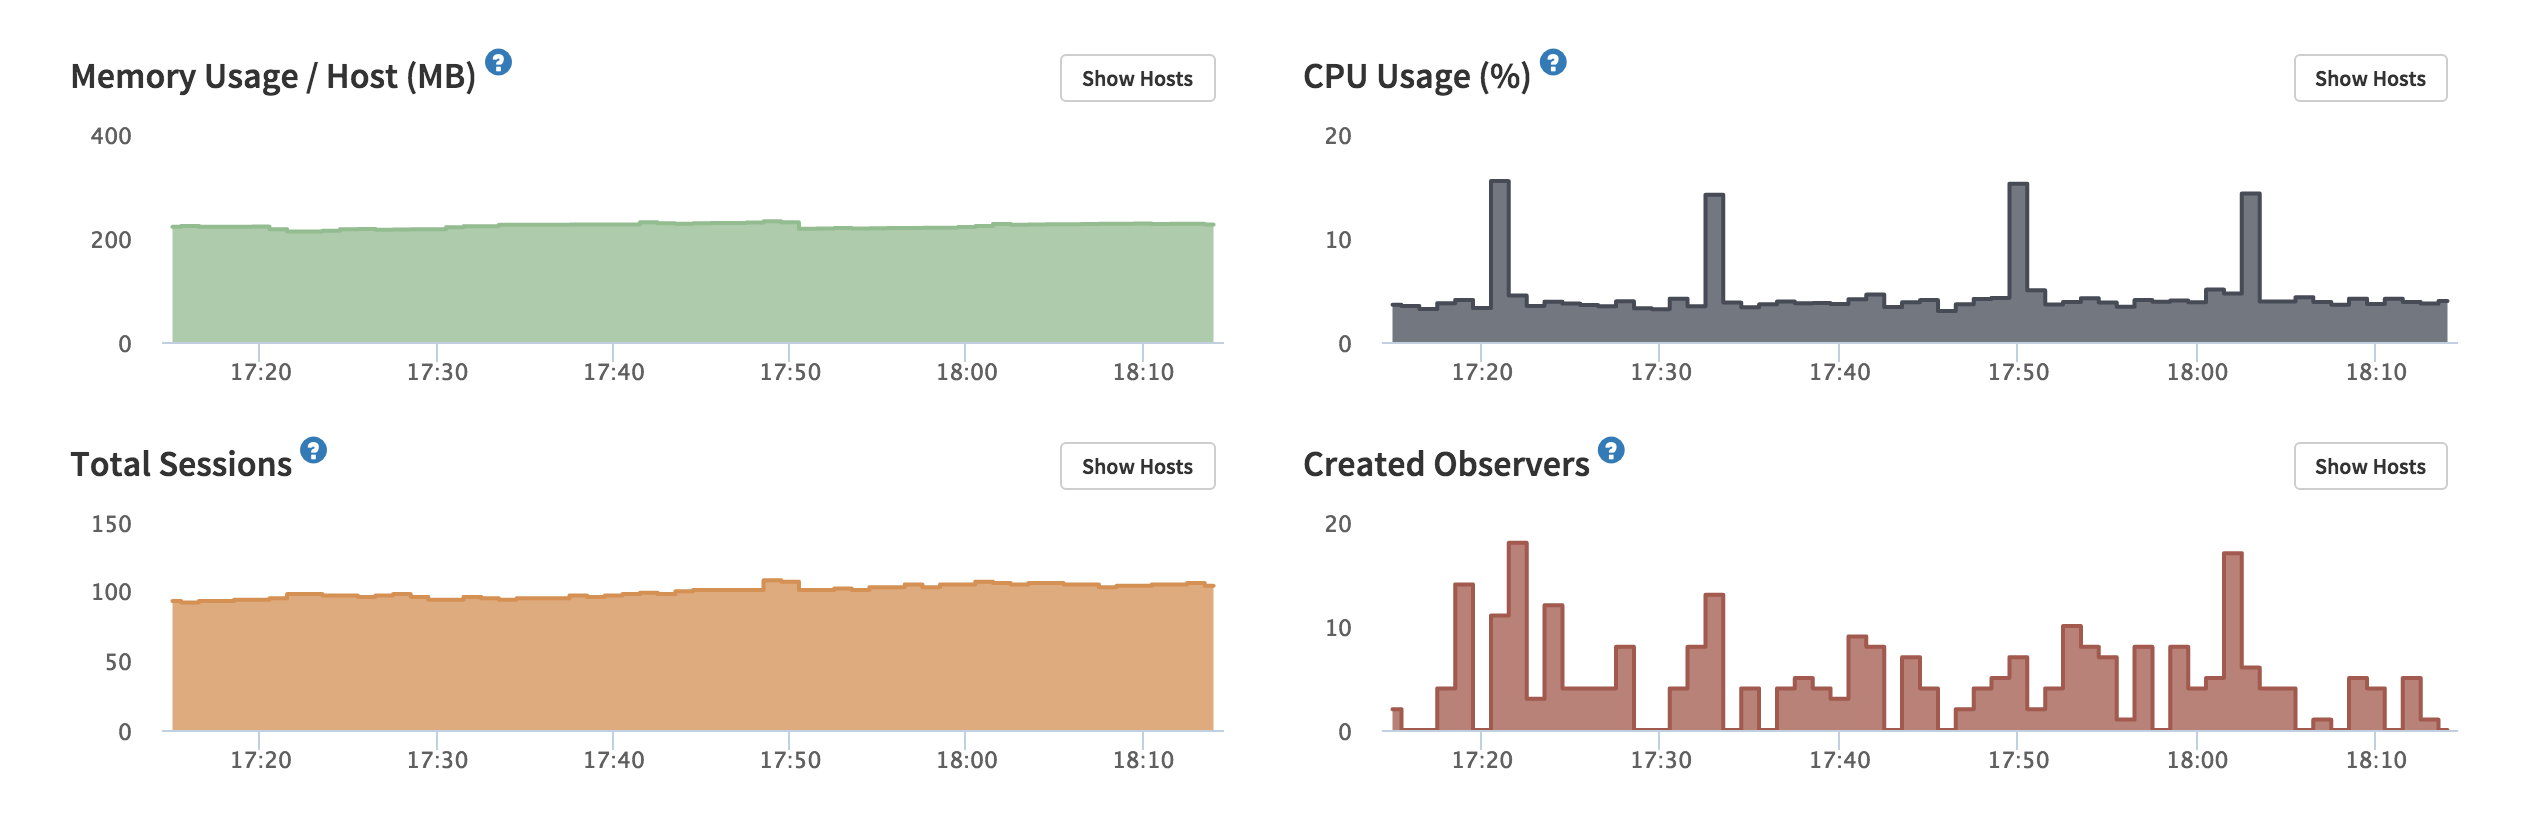
You can assess the performance of your system at a glance with Kadira APM. It includes common system metrics information such as memory and CPU usage.
We also track several NodeJS and Meteor specific performance metrics that are very important for debugging and monitoring the health in your app. They include:
- Eventloop Blockness percentage – This is very helpful for identifying CPU usage in cloud and container environments.
- Garbage Collection (GC) activities – See NodeJS GC activities and figure out whether it's causing issues or not.
- Oplog Queue size – Meteor uses MongoDB oplog for real-time queries. Oplog queue size is an important performance metric if your app has a lot of writes.
- Oplog throughput – Number of operations received via oplog
- MongoDB polling counts – Number of times Meteor polls mongodb for data
All this system information is vital if you need to check the current state of the app and debug any issues.