25. Quality Assurance on Dashboards
Prior to performing any QA to a dashboard ensure that:
- You have a basic understanding of what the project entails. This can be achieved by going through the inception report or asking the lead to provide an overview of the project.
- You have access to the database where the raw tables and final views are located.
- You have the indicators worksheet and have an idea of how each indicator is expected to be calculated. Also, take note of the outlier/business rules.
Note: Always use data/a subset of the data from the raw table(s) to perform QA.
Once you have access to the raw tables and indicators worksheet:
- Create a worksheet with a list of indicators, a column with the dashboard values and a column for QA values results for each indicator.(See here for a sample worksheet)
- Ensure that the count of records within the raw tables is the same as the source of the data. For instance, if the data is from OnaData forms ensure that the count of records within the raw tables is the same as the number of records within the overview page of the form within the OnaData account.
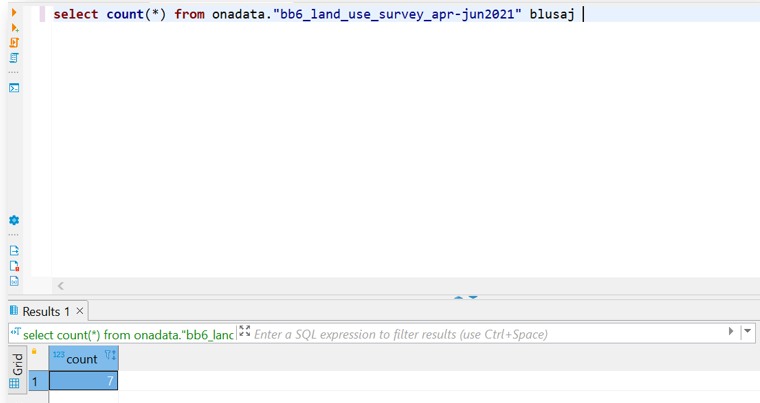
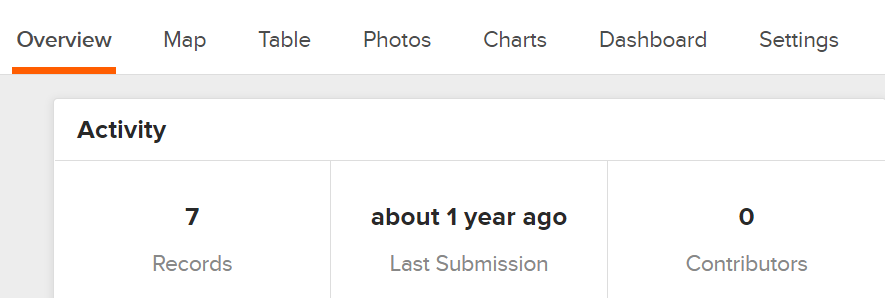
-
Query the raw table(s) to confirm that the indicator value(s) displayed on the charts is the same as the returned query results. For instance, this query was used to confirm if the land area surveyed indicator value on the chart is the same as the when the raw table is queried.
select SUM(calculate_area::float) as land_surveyed_m2
from onadata."bb6_land_use_survey_apr-jun2021" blusaj
- Ensure that you can access data from the respective tables within the OpenSRP and Superset database. This is important to ensure that the number of records within the respective tables across the different databases are the same. In some cases, a vault user is granted a Can read permission level to the OpenSRP database while in other cases, an analyst needs to request an OpenSRP engineer to share CSV files of the different tables (event, client and location) within the OpenSRP database.
In this sample case, data within the OpenSRP database were shared as CSV files which were uploaded to the test schema. To confirm the number of records within the client table is the same as the ones within Superset, this sample query was used:
select count(json::JSON ->>'baseEntityId') from test.client
-
Query the respective raw tables to ensure that the records tally across the different databases. On Superset, the raw tables are normally located within the OpenSRP schema. Depending on the project, some of the commonly used tables are:
a. Client : contains client’s gender,birthdate and name.
b. Client attributes: contains client’s related information such as birth location, employment status, education level, religion, marital status of the caregiver etc.
c. Client relationships: contains data that relates each child to it's caregiver.
d. Events: contains the event dates, unique_id’s of the clients and location information of the different events such as birth registration, vaccination, growth monitoring.
e. Event_obs: contains the specific information of the respective events within the events table such as vaccine names and dates for vaccination events.
f. Jurisdiction: contains the location hierarchies data
On the OpenSRP database, all the relevant events information is within the event table and the client information is within the client table. Hence, it is important to ensure the numbers of records within the different tables are the same across the different databases.
-
Request the lead analyst/ project manager to share the indicator mapping worksheet (if available) and the scripts used to create the views/materialized views. This worksheet will enable an analyst performing the quality assurance to understand the indicators and how they are expected to be calculated. If the sheet is not available, take a look at the comments within the scripts shared by the lead analyst to understand how the indicators are expected to be calculated.
-
Create a QA workbook that has the data worksheet used for QA and an indicators worksheet that has a column of the list of indicators, dashboard values and a column which you will populate the QA results with. Sample workbook: https://docs.google.com/spreadsheets/d/1R1Inn55mq8gKDfz52FRH034tuxwpo_3RlyZRw3CJkYk/edit#gid=1860418866
-
Query the raw OpenSRP tables to ensure the values displayed on the charts are the same as the returned query results. If data from the OpenSRP database is within CSV files, ensure you have the most recent file or apply a date filter to work with a subset of the data when performing QA. In this sample case, data within the OpenSRP database were shared as CSV files which were uploaded to the test schema. One of the indicators was
Number of inactive patients in the past one year the sample query used to confirm the inactive patients was
select count(distinct json::JSON ->>'baseEntityId') from test.client_
_where (json::JSON ->>'dateCreated')::date >= date_trunc('month', (now() - interval '12 month')) _
_and (json::JSON ->>'dateCreated')::date <= now() and json::JSON ->>'clientType'='child'_
_and (json::JSON ->'attributes'->>'inactive'='true')
- Ensure your dashboard meets all the requirements listed in the requirements gathering template.
- Ensure the visual sizes and colors are consistent.
- Ensure the title capitalization is consistent across the visuals.
- Ensure filters used on the dashboard apply as expected.
- Ensure the client logo is included.