Repository navigation
Copilot Adoption Tabs
This page is for Copilot programme leads. It goes through the Copilot Adoption page one tab at a time: what each tab shows, who can see it, and what to do with it. To get started, see the user guide; to read the figures and the warnings, see Interpretation.
The tabs: Executive view and Analyst view · Licensed users · Cowork · Unlicensed usage · Agents · Licence opportunities · How this is calculated
Lists that name people need the See PII permission; the aggregate figures don't. A past date range hides the named lists from everyone (see Choosing the reporting period).
Executive view is the concise summary for a licence/enablement discussion. Analyst view contains detailed evidence, information buttons, SQL popovers and the breakdowns below.
1. Where you stand
- Headline cards — licences, adoption, habit, reclaimable licences, engagement, unlicensed use, recommended candidates.
- Time already saved by seat holders — a headline card with a modelled range of hours a month. Review on Licensed users opens the detail: see Time already saved by seat holders.
- Where you stand — the adoption and habit rates as gauges against a judgement scale. The gap between them is the finding: adoption near 100% with a habit rate near zero means everyone opened it once.
- Adoption funnel — licensed → ever used → active → habitual → champion. The narrowing is the point.

2. What to do next
- Enablement plan — how many people need each action. With See PII, click any row to jump to the list of exactly those people, ready to filter further or export.
- Adoption by department — worst first. This is your running order.
- Adoption by email domain — on a tenant that carries several email domains, the organisations sharing it, side by side. Also on Executive view. See Adoption by email domain.
- Where the unmet demand is — departments you could rebalance licences into rather than buy for.
Since Stable 1859 (PR #821): the Department league table, on both views, gives each department its own count of licence candidates. Builds before 1859 took the count from the departments with the most candidates, so most rows showed 0 candidates, with a reassignment signal worked out from that 0. A zero is now a real zero. A dash means the count isn't shown: fewer candidates than the segment minimum (5 by default), or none found in a candidate list that stopped at its limit. A row with a dash has no reassignment signal. The workbook's Habit by department table gains a Licence candidates column.


3. How Copilot is being used
- How often people open Copilot — raw active days a month, no scoring or weighting. Read it against the habit rate above: lots of "Daily" with a low habit rate means people open Copilot constantly and do very little with it.
- Engagement mix and Where Copilot is used — the population split, and which surfaces carry the traffic.
- The shape of adoption — your typical user against your own champions.
- Frequency vs intensity — which departments are frequent-but-shallow and which are deep-but-occasional. The letter inside each bubble is its engagement band, so the chart still reads when printed in black and white.
- Usage concentration — whether adoption is broad or carried by a handful of people.
- Who is doing the Copilot work and What Copilot is working on.


4. Trend and wider reach
- Weekly trends — active users, and interaction volume including unlicensed.
- Licensed and unlicensed side by side — the reallocation view.
- Adoption by country — for organisations that run enablement regionally.
Since Stable 1859 (PR #806): unlicensed use, licence candidates and agent use by department leave out departments with fewer people than the segment minimum (5 by default), for every reader. In Licensed and unlicensed side by side, a side with one to four people is blank, and so are that department's agent columns.


Nothing on Executive view? If the page says "No Copilot licences found", the analysis ran fine and simply found no one holding a Copilot licence. The page lists the three usual causes in the order worth checking — most often the licence import has not completed yet on a new installation.
On Executive view, under Where it is working and failing, and on Analyst view, under What to do next.
A tenant built from acquisitions, subsidiaries or a separate contractor domain carries several email domains, and they often adopt Copilot very differently. A department spans all of them, so its average hides that difference. This table puts the organisations side by side.
-
The domain is the one in each person's sign-in name, lower-cased. Invited guests are counted under their own home organisation, not your tenant, and marked External. Where a sign-in name is on the tenant's own
onmicrosoft.comdomain, the domain of the person's mail address is used, if it names a real domain. Anyone whose domain can't be worked out is counted under (no domain). - Which domains are listed. A domain needs at least the segment minimum, 5 by default (Settings), of licensed and unlicensed Copilot users together, and the table lists at most 10 domains. The table appears only when at least two domains qualify.
- The order. Worst adoption first. Domains with no Copilot seats at all come last, marked no seats, the one with the most unlicensed users first. They're often a business that uses Copilot Chat without ever having been given a licence, and they're usually the rows to act on first.
| Column | What it shows |
|---|---|
| Licences, Active, Habitual | The domain's Copilot seat holders, and how many of them were active, and habitual, in the period |
| Adoption rate, Avg. score | As elsewhere on the page, for the domain's seat holders. A dash for a domain with no seats, which has nothing to rate |
| Reclaimable | The domain's seats that look reclaimable, with the same certain and probable tiers as the headline figure |
| Interactions per licence | Audit interactions a month, divided by every licence on the domain, idle ones included |
| Unlicensed users | People on the domain who used Copilot Chat in the period without a seat. Guests aren't counted |
| Licence candidates | People on the domain that the licence-opportunity ranking recommends a seat for. The Licence opportunities tab lists them by name |
| Cowork candidates | The domain's prime candidates for Cowork. Shown when Cowork readiness is available and at least one domain has some |
Reading it. Idle licences next to heavy unlicensed use on the same domain is a seat-allocation problem, which you can usually fix at no cost by moving seats. Strong adoption next to a queue of licence candidates is a business case.
Filter on a row, which needs See PII, narrows the whole page to that domain: everyone your filter already selected, on that domain only. The row is highlighted, and its Clear removes the domain again. If adding the domain would make your filter too long, the page says This filter is too long to apply and leaves it as it was. See Narrowing the page with the filter bar. Without See PII the table has no Filter buttons.
The Excel report has the same table on its Email domains sheet.
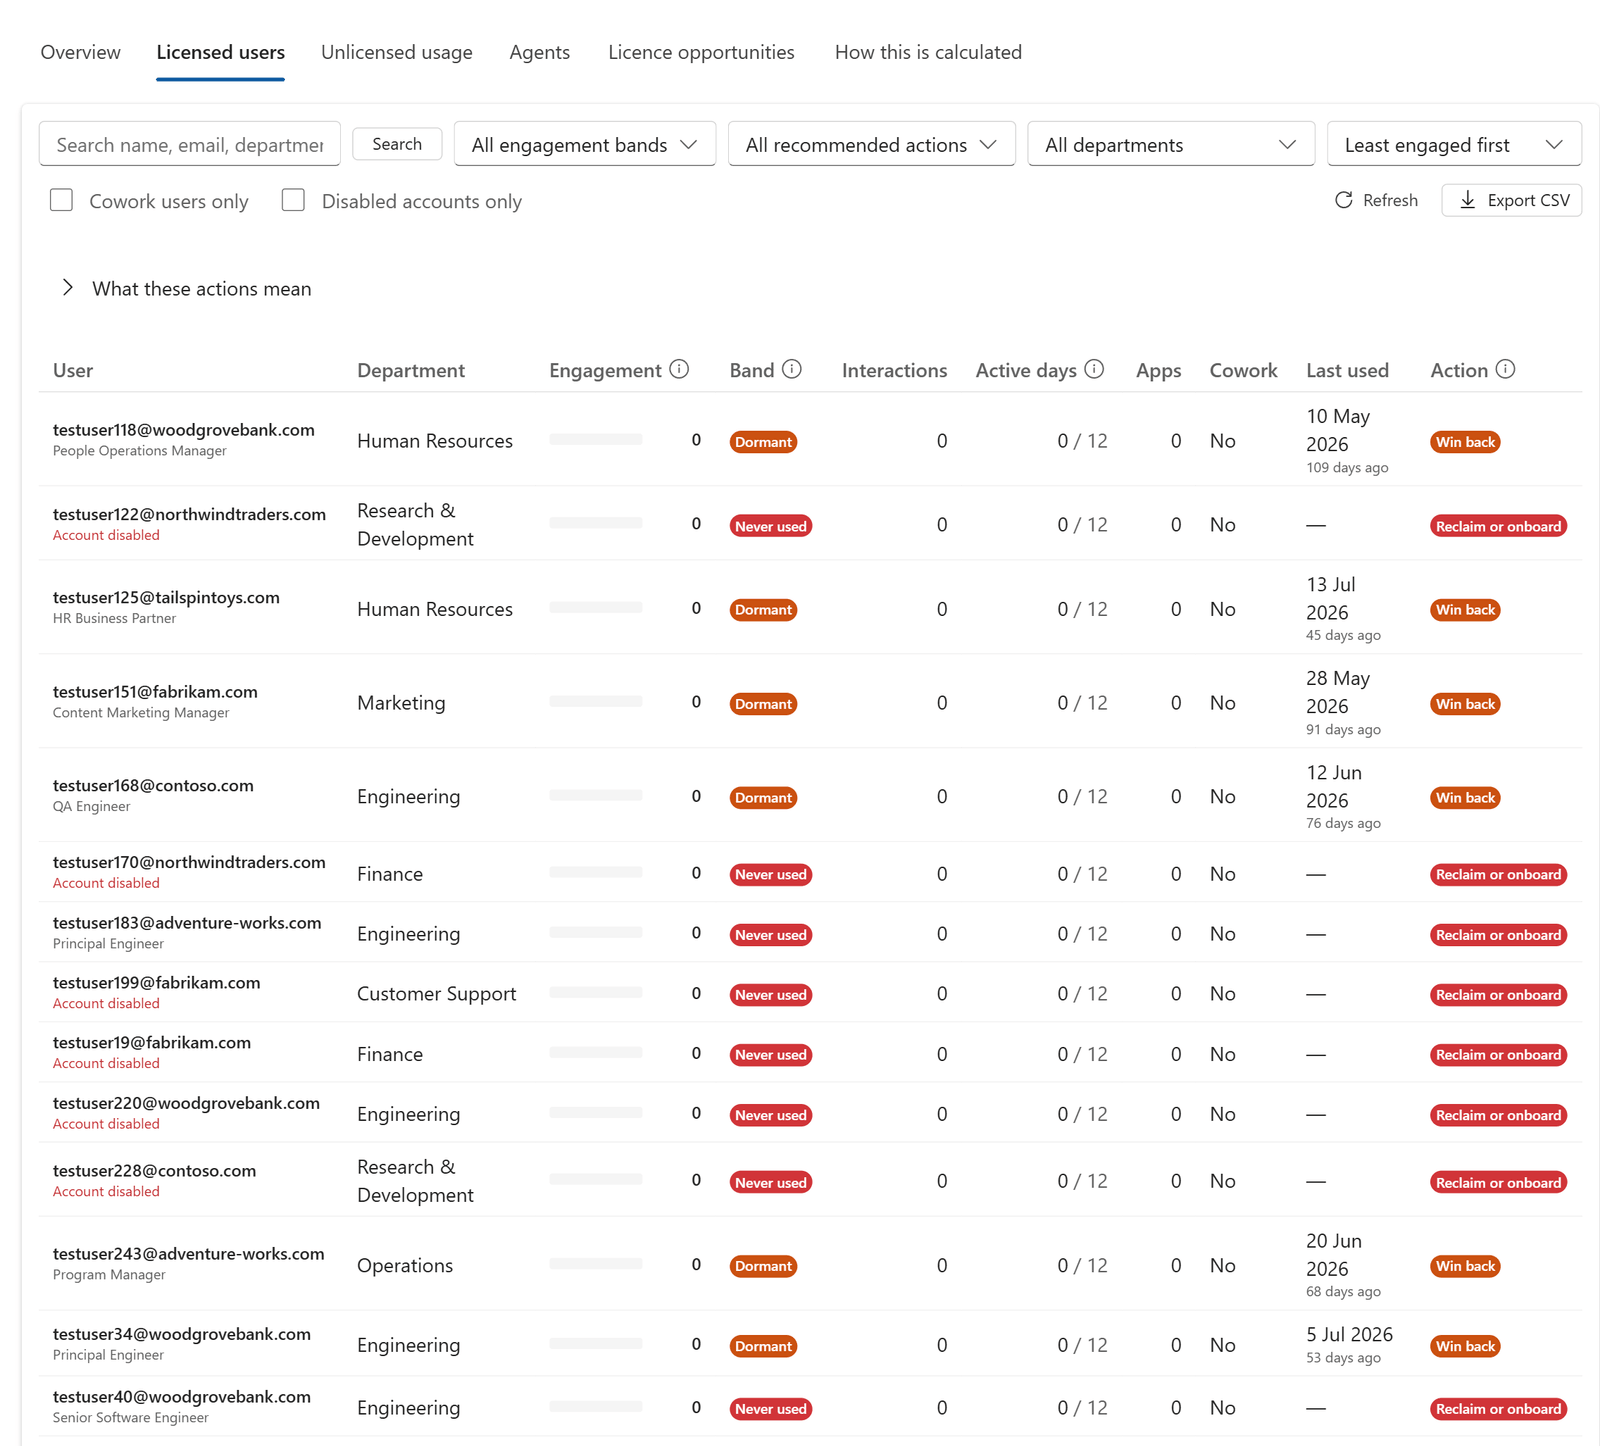
Everyone holding a Copilot licence, with their engagement score, band, and a recommended action tag.
Search by name, email, department, job title or manager, and filter by engagement band, recommended action, reclaim tier (All reclaim tiers, Certain reclaim, Probable reclaim, Review before reclaim or Excluded from reclaim; see Reclaim tiers), Cowork users only or Disabled accounts only — a disabled account still holding a Copilot licence is the easiest reclaim there is. The list opens with the least engaged first, and every column sorts from its header. Expand a row (or select Expand all) for the full assessment: where the signal came from, apps, Cowork, the reclaim tier and its reason, and the score's components. Sorting and filtering happen server-side, and the CSV export contains the same filtered, sorted list: every page of it, up to 100,000 rows, not just the page on screen.
Arriving here by clicking a row of the enablement plan pre-sets the action filter. It is a normal filter in the toolbar, so you can widen it, narrow it further, or clear it.
The section Seat holders' time saved (modelled), above the list, answers a budget-planning question about seats already bought. It is a model, not measured time returned.
It counts the Copilot actions that seat holders took in the period, from the Copilot audit log, restates them as a 28-day month, and multiplies each by a time credit:
| Copilot action | Default credit |
|---|---|
| Outlook | 6 minutes per action |
| Word, PowerPoint and Excel | 6 minutes per action |
| Teams meetings | 30 minutes per meeting per person, however many prompts |
| Copilot Chat and other surfaces | 0 minutes: Microsoft has published no per-prompt credit, so these are counted and shown as uncredited actions |
The Outlook and document credits are Microsoft's own Copilot assisted-hours credits. Microsoft credits a meeting summary by the meeting's length, which the import doesn't reliably carry, so meetings get a fixed 30 minutes instead. Agent and Cowork activity is left out altogether; Cowork has its own estimate.
Comparing with an export from before Stable 1856? The Teams meetings figure, and the hours it adds, can be lower afterwards, because the upgrade merged duplicate copies of the same meeting. That's a correction, not lost data; see time saved by seat holders.
What you see:
- Modelled hours a month, as a range. The high end applies every credit in full. The low end applies the conservative share, 50% by default. You can change that share in the time-saved models on the Licence opportunities and Cowork tabs, and this range follows.
- Excluded users: seat holders known only from Microsoft's Copilot usage report. That report has prompt counts but no per-action detail, so they can't be modelled.
- The observed actions a month of each kind, with the credit applied to each.
- Departments: up to ten, those with the most hours at the default credits. A department with fewer than five seat holders isn't shown, and there is no per-person figure.
Change a credit for your own session. Type your own minutes into any of the four boxes, and the hours, each department's hours and the headline card follow. Your figures stay in this browser tab: they are never saved, and nobody else sees them. An Excel report you download afterwards uses them too, and its Seat holders time saved sheet says the assumptions were entered in the portal.
When there is no estimate. The card and this section are left out when the Copilot audit import has no data for the period, and when the estimate's query fails or times out. In that second case the page's "These figures are incomplete and should not be relied on." banner lists seat-holder Copilot time-saved inputs among what could not be loaded, and the Excel report has no Seat holders time saved sheet. If the query ran and the seat holders took no credited actions, the card shows 0 hours: that is a result, not a gap.
Read it as hours, and on its own. It is never converted into money, and never added to the licence or Cowork estimates: each answers a different question.
Without See PII you see the headline card, without its Review on Licensed users link, but not this section: the Licensed users tab lists people, so it isn't shown to you. The Excel report's Seat holders time saved sheet has the same figures.
On a large tenant, the first load of a long period is slower. This estimate adds a query to every analysis. On a synthetic tenant with 60,000 seat holders it took about 8 seconds for 28 days and about 43 seconds for 180 days.

Illustrative local fixtures only. These are not completed tasks, measured time savings or evidence that Cowork is funded.
Read observed use separately from predicted readiness. Cowork use comes from audit interactions, not a count of tasks or autonomous runs. Readiness combines current engagement and workload evidence; a predicted candidate has not thereby been observed using Cowork.
The tab's Time saved, readiness/rollout sections and aggregate figures are available without named people. People to enable and its CSV require See PII and a rolling period. If exporting a spending-policy list, retain existing approved users and review the reasons; the analytics tool does not change the policy or license anyone.
The Cowork and licence forecasts are modelled ranges of hours with visible assumptions. Reader-entered assumptions stay in the browser tab and are carried into that reader's workbook; they are not tenant settings. The two forecasts and the seat-holder estimate must never be added together.
Note: the capacity block and any attributed credit rows on this tab are Copilot Studio credit data, not Cowork funding, usage, spending-policy headroom or a Cowork bill. Review actual Cowork billing in Microsoft 365 admin center → Copilot → Cost Management. See Agent costs for Azure's separate pay-as-you-go limitations.
People using Copilot Chat without a Microsoft 365 Copilot seat are a population in their own right. Microsoft's licensed-user report does not cover them. Frequent or Daily use is observed demand worth investigating; it does not tell you whether they were trained, encouraged to use it, or need every capability of a paid licence.

Two further cards show where that unlicensed demand is coming from — which surfaces it happens on, and which departments it sits in:


Your Copilot agent estate, with a Keep / Review / Retire / New verdict and a stated reason for each.
An agent appears only once it has been used — the audit log records agents that ran, not agents that exist. New agents (first seen recently) are exempt from review on purpose: a brand-new agent with two users has not failed, it has not started.
Three cards frame the estate before you get to the list. Inventory health is the size of the clean-up at a glance — every known agent gets exactly one verdict. Where agent effort goes shows how concentrated agent use is, which is usually a handful of agents carrying almost everything. Agent usage by department attributes that work to the people running it:


The inventory uses a separate as-of-now history window, normally 120 days, not just the selected engagement period. It covers at least the selected rolling period and the configured retirement boundary plus one day. It is bounded by the documented row caps, not a complete catalog of agents that exist. A quiet rolling period doesn't empty the inventory, and a failed history probe flags incomplete figures rather than proving an empty estate.
Search by name/ID, filter by verdict or choose customer-built agents only. Search filters the loaded list rather than fetching a new complete estate. Long agent IDs are shortened; hover to read the full synthetic identifier:

The Type column says who made each agent: Customer-built (your organisation, in Copilot Studio for example), Microsoft (one Microsoft ships, such as Cowork), or Unknown when the audit log does not say — SharePoint agents, for example. Unknown agents are counted, not guessed: the Active agents card shows how many there are, and Customer-built agents only leaves them out. See Agent type for how each agent is classified.
Heaviest agent users is a targeted See PII ranking for licence/advocate review. It does not measure productivity; in filtered views its tenant-wide input cap can omit lower-ranked people. Use its scope/cap notes rather than quoting it as an exhaustive employee leaderboard.
Counted turns, not raw rows. A Copilot Studio turn can be audited by both runtimes; both records stay, while supported pairs count once. Maker testing is excluded from agent figures/verdicts, so test-only agents are not listed. Records from the same app a few seconds apart are not merged on timing alone: genuine rapid prompts both count. Retained evidence can still be incomplete; see turn-counting rules.
Lifecycle verdicts are recommendations, not automatic deletion or proof of business value. Review current governed thresholds, especially inactivity/newness, before interpreting a changed verdict. Origin (Customer-built / Microsoft / Unknown) remains independent of billing kind and credit estimates. Use Agent Measures for breadth/depth/builders/reach and settled growth; billing evidence is a separate series, never added to audit activity.
Unlicensed users ranked by how strong the case for a licence is, each with a written justification you can paste into a request. Unlike the licensed list, the justification genuinely differs per person.
The tab opens with Potential time back from licensing, a modelled range of hours a month, and then has two sub-tabs:
- Candidates: the ranked list, which names people, so it needs See PII. Tick Recommended only to keep just the people above the recommendation score, or Already using Copilot for people already using Copilot Chat without a licence. Each candidate's Justification is in the row's detail: expand the row (Show the full assessment), or select Expand all. It is also written out in full in the Export CSV and the Excel report.
- Time saved: how the licensing estimate works, and the assumptions behind it (minutes saved per meeting, email and document, and the conservative share). You can change them for your own session, as for time already saved by seat holders. This sub-tab opens first for readers without See PII.


The minutes per meeting, email and document quoted in both captures are fixture values, not the product defaults (5 minutes per meeting, 0.5 per email and 1 per document).
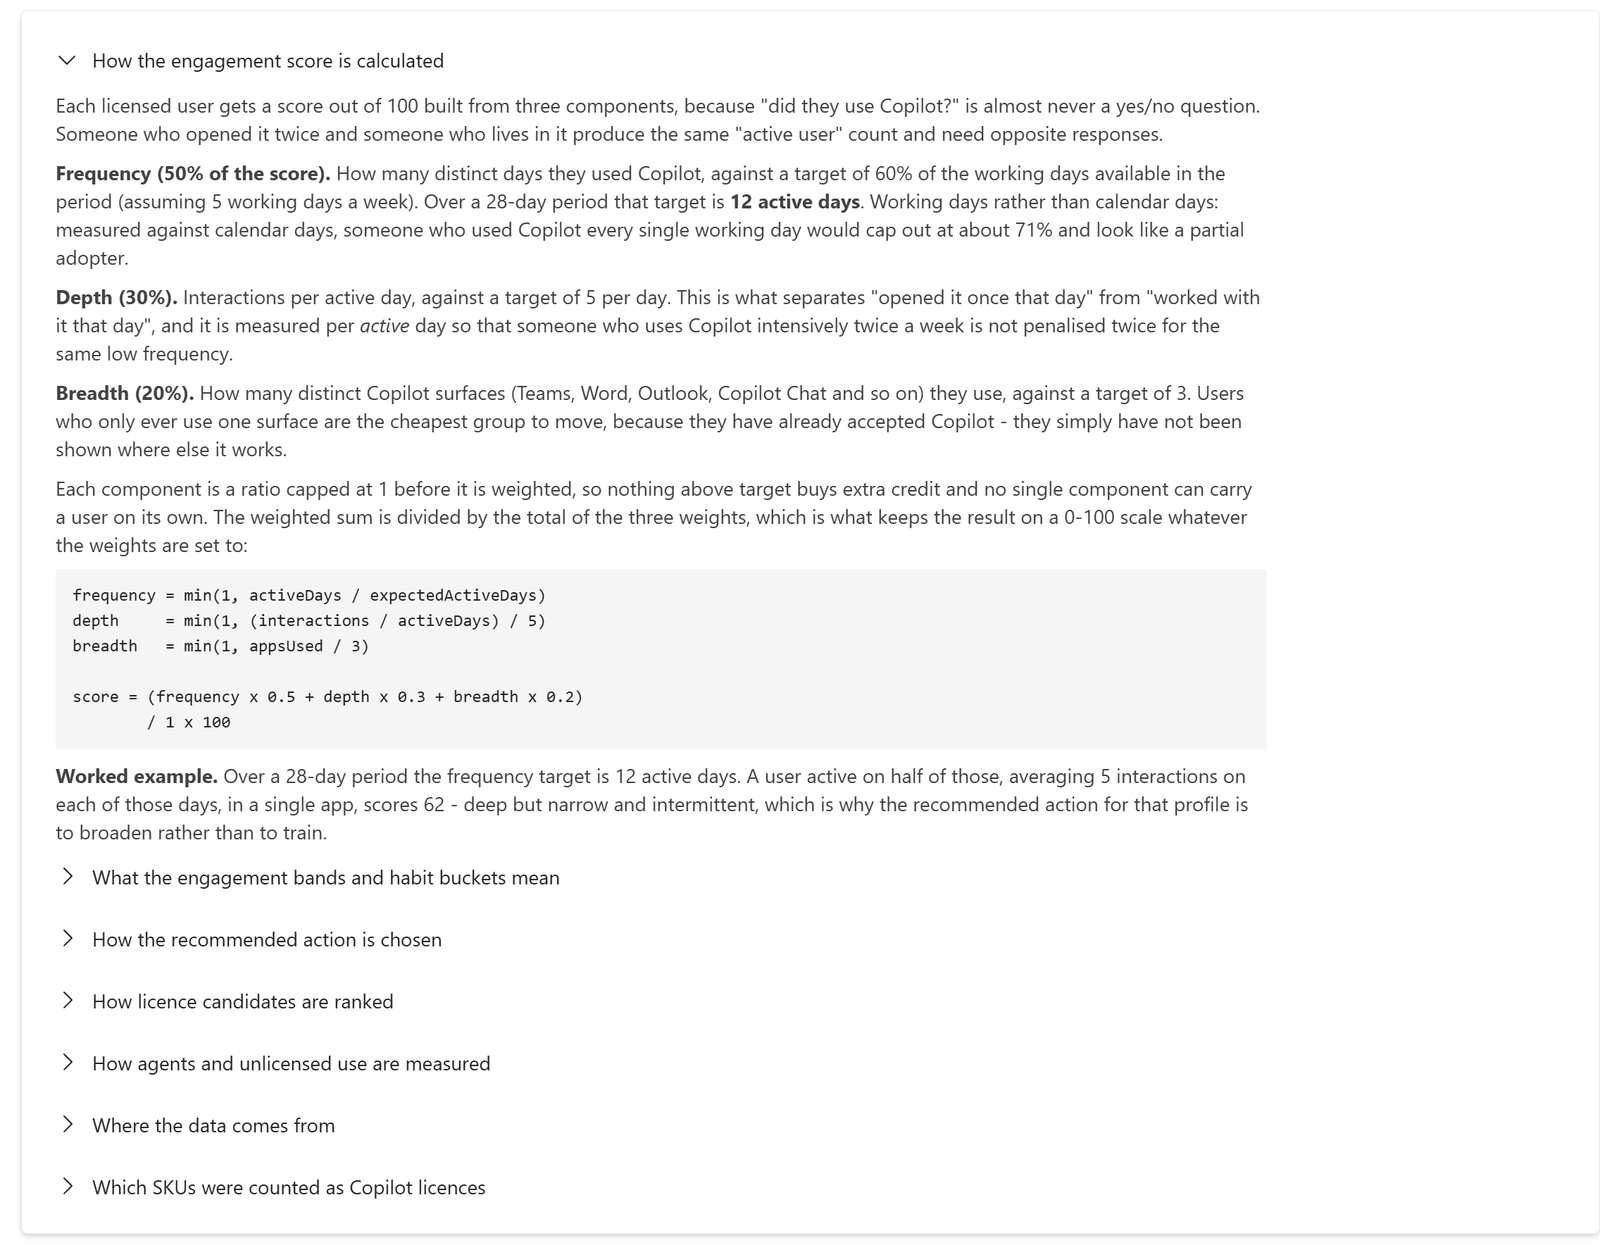
Every formula, with worked examples and the full list of SKUs that were and were not counted as Copilot licences. Send sceptics here.
Each method is its own expandable section. Below, How the engagement score is calculated is expanded to show the weightings, the formula and a worked example:
Previous: Copilot Adoption User Guide · Next: Copilot Adoption Interpretation: how to read the figures, the warnings and the blanks.
Programme leads' path: User guide → Tabs → Interpretation → Reviews and exports