Health Alerts
Once everything is running, we highly recommend creating alerts for the system to monitor health & be able to respond to problems, should they happen.
Health alerts are part of the broader Monitoring guidance. For diagnosing slow imports and database growth, see Monitoring system performance.
Prefer a single at-a-glance view first? The web portal has Administration → Service health, which answers "is it working?" without opening Azure — it shows import liveness, an exceptions overview, per-component health and data freshness, reading (via
api/Health) the same App Insights signals these alerts use. Alerts are how you get told when something breaks; Service health is the pull/at-a-glance board. See The web portal for how the portal is laid out.

If something like this happens, you need alerts to warn you before the imports stop working.
We're going to monitor the following metrics & problems:
- No recent data from App Insights (web tracker)
- No recent data from the Microsoft 365 Activity API
- Issues writing data into SQL
- App Service Plan
- SQL Database
- Azure Cache for Redis
- Service Bus (only relevant if the Teams calls import is enabled)
- Access-denied errors caused by an expired Entra ID (AAD) app secret
Most of these we can configure with Application Insights alerts.
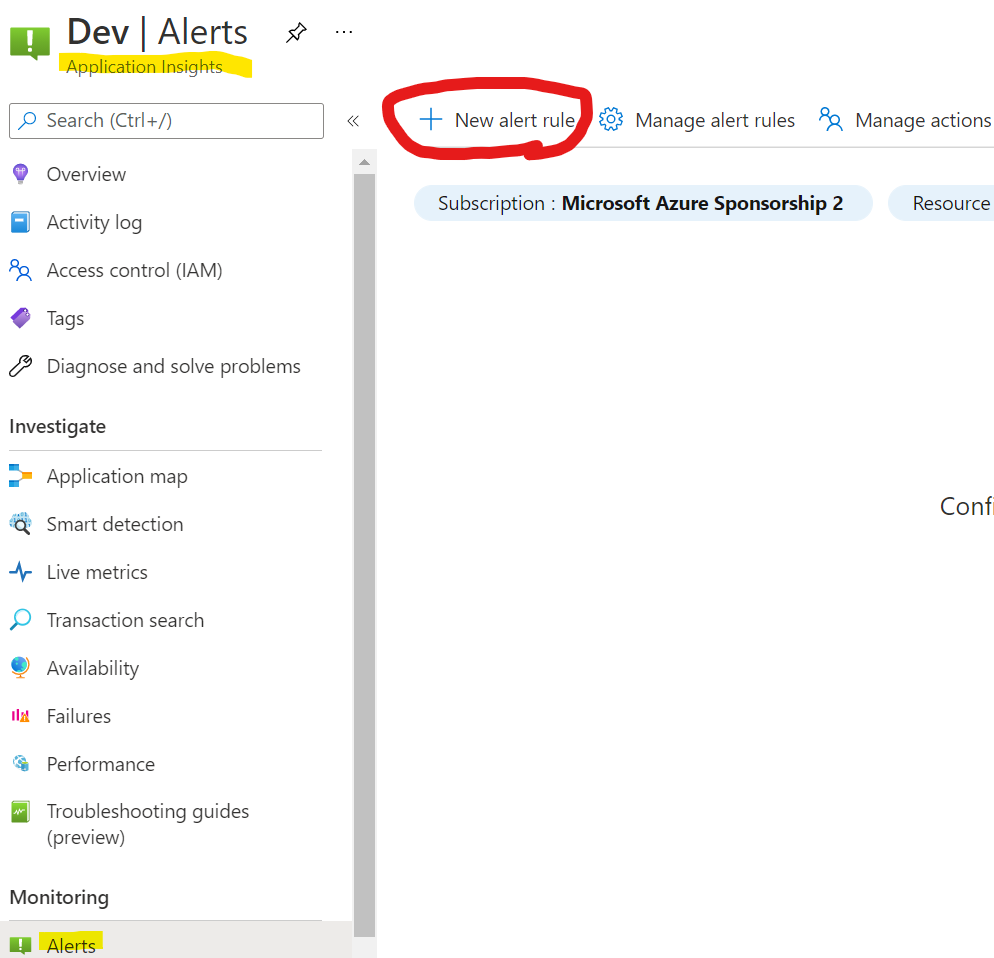
Rules allow us to be notified when specific events occur.
Example: create a rule to check if there's no recent data into App Insights from the web tracker.
Why might this happen? A bad deploy of a new tracker version, for example. It probably won't happen, but it could for many reasons potentially; we need to know if this happens ASAP so we can fix it.
Create a new rule & add a condition:
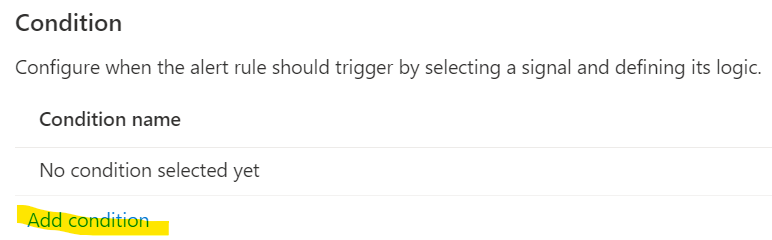
The signal for the condition will be "Custom log search" meaning, from the results of an Application Insights query.
For the query we just want pageViews, nothing else.
For the alert logic, in this case, we want to know when no hits are arriving "for X time". That is obviously going to be enough time that it's clear there's a problem instead of just inactivity, so let's say "48 hours".
If there's been no hits at all in 48 hours on any sites, then the chances are there's something wrong – you may have your own ideas what X may need to be, but in this example, our alert will look like this:
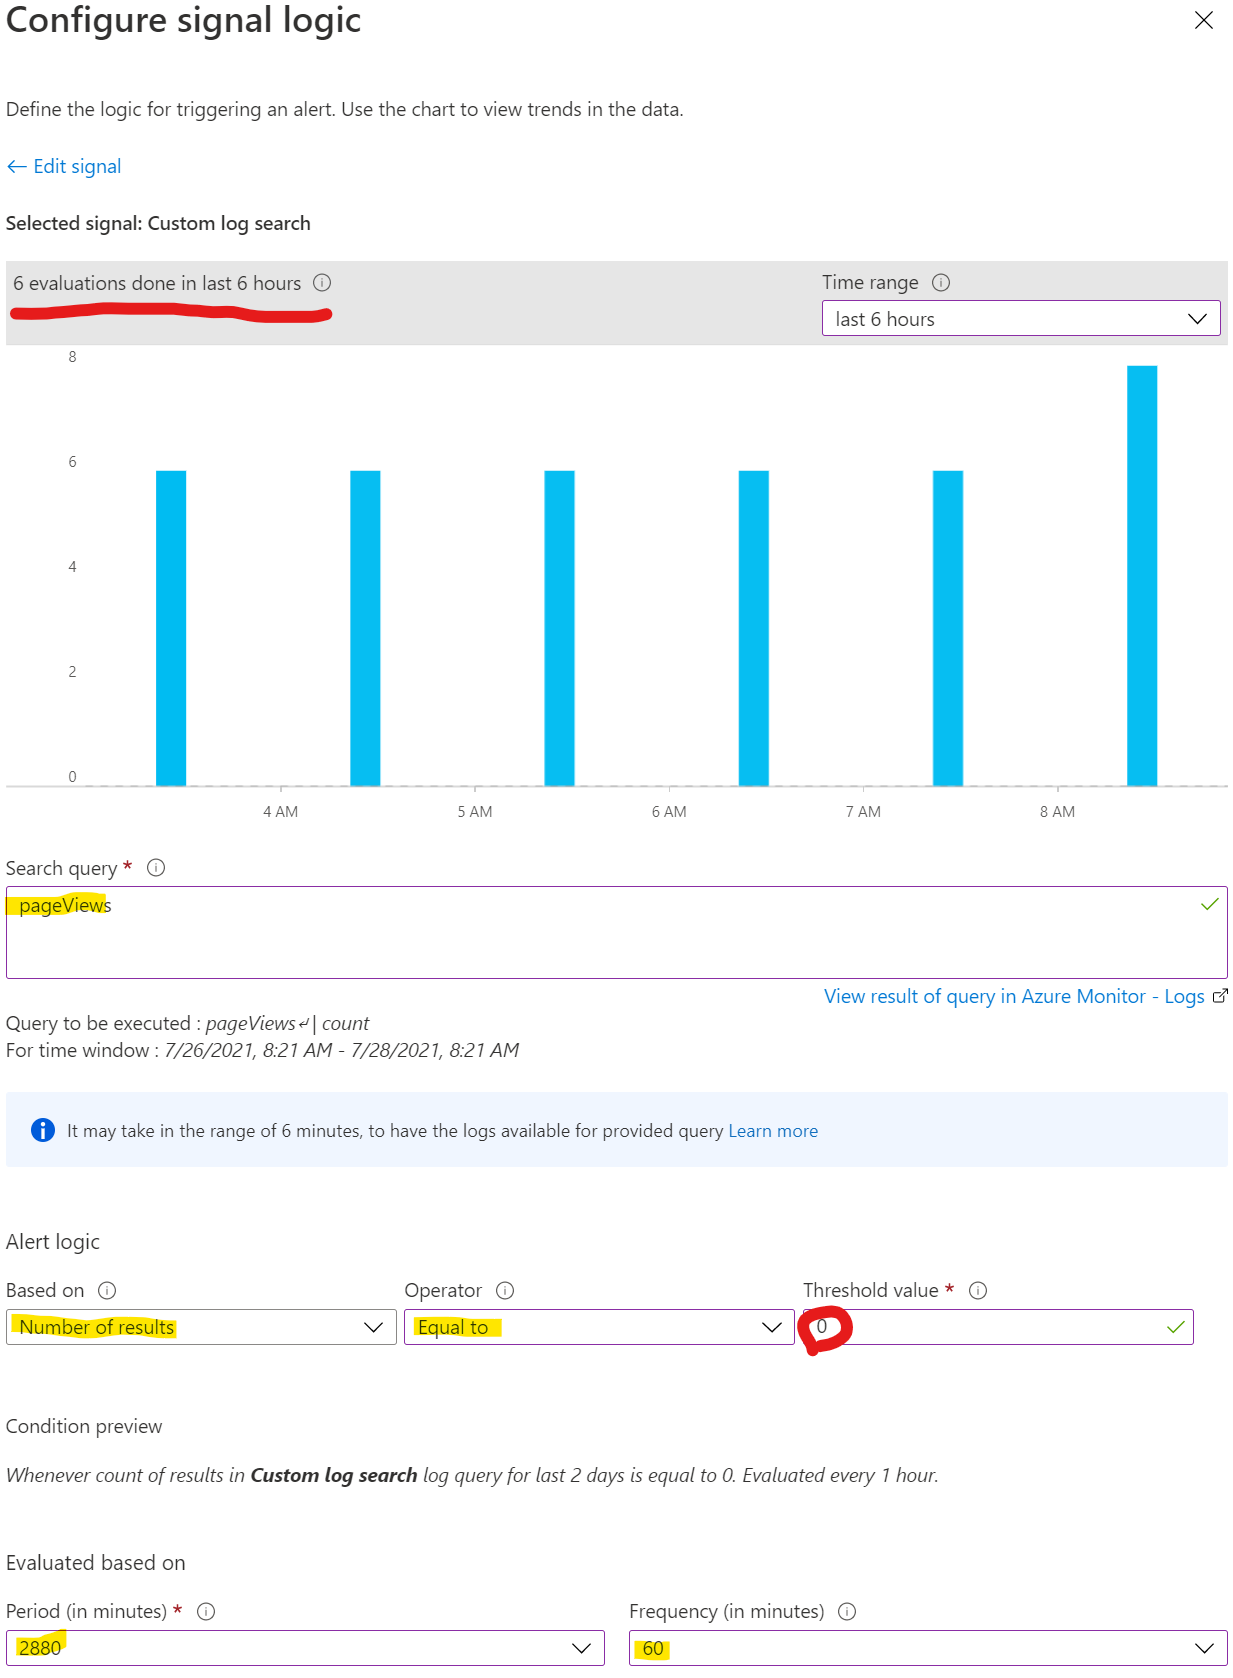
Here we can see that when page-views are equal to 0 over the last 48 hours (2880 minutes), the rule will trigger. In this case we've had 6 hits over the last 48 hours, which has been the case each 6 times it's been checked over the last 3 hours (the number of evaluations is shown to give you an idea of the evolution of the data over time, but in our case it's a demo environment hence the low traffic).
Save the trigger.
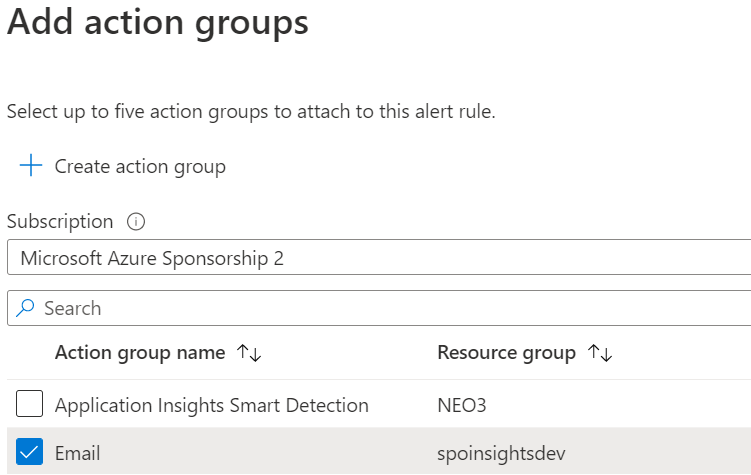
Next up: define an action when the trigger is hit, which we do with "action groups", which is basically a way of configuring a collection of things to happen when a trigger is hit. You pre-save an action group & associate it to an alert.
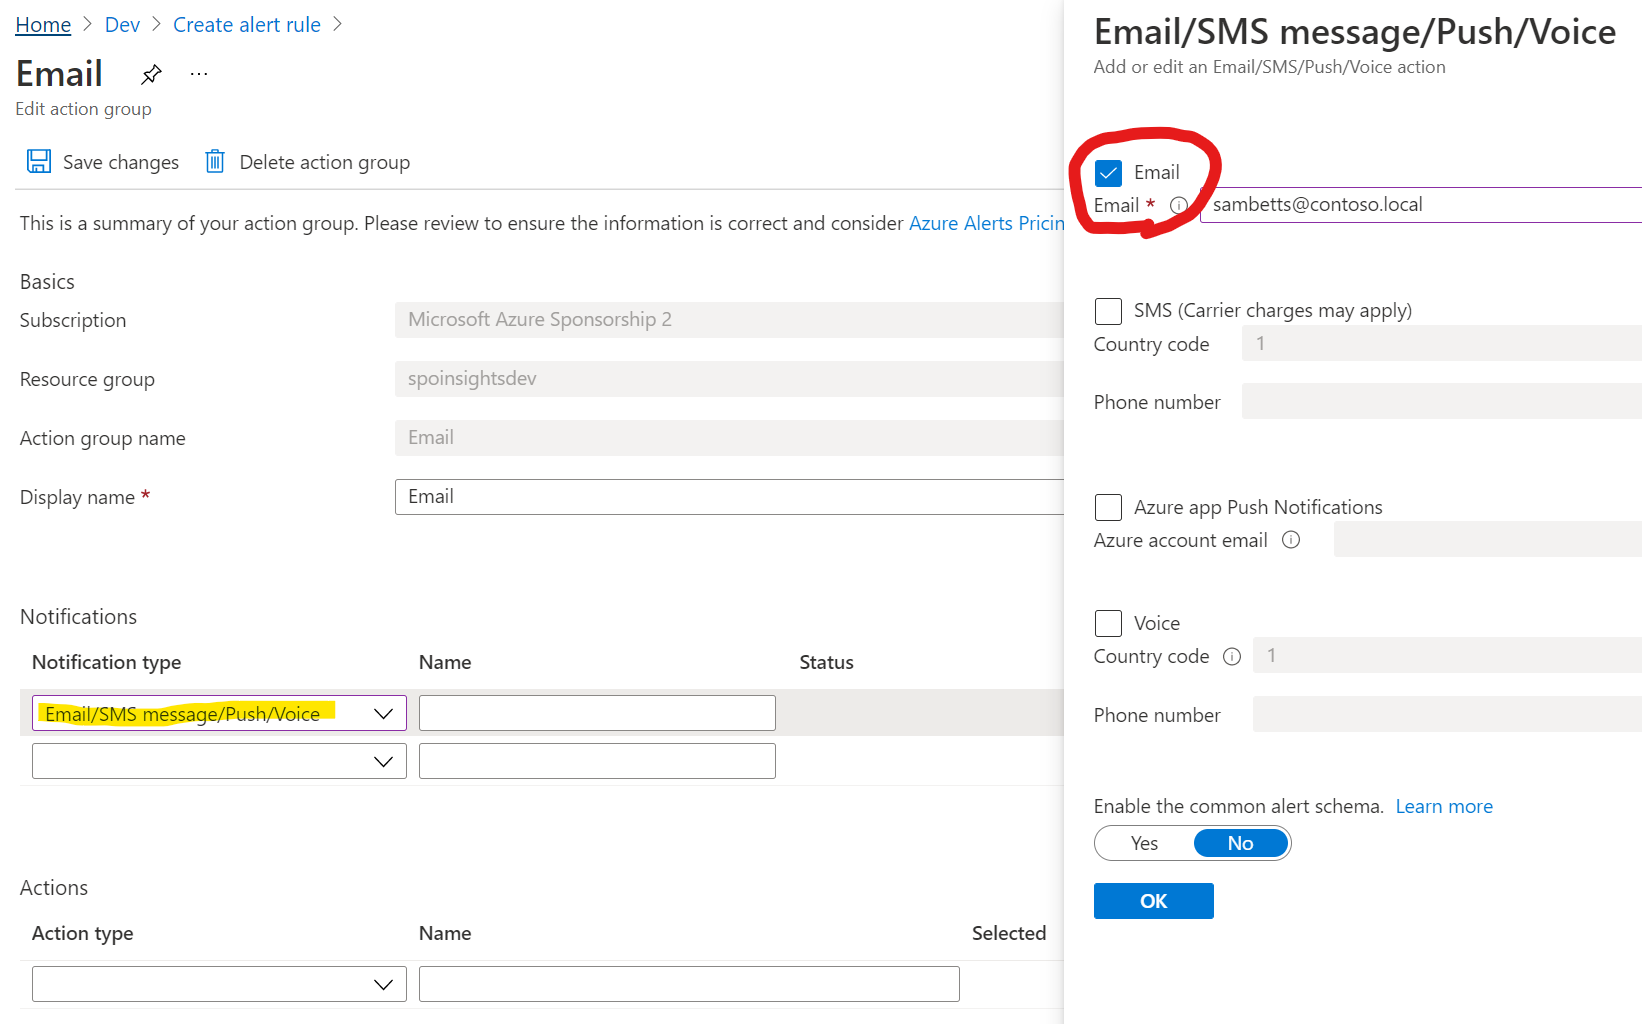
From an alert, this is now selectable.
Now add the alert details...
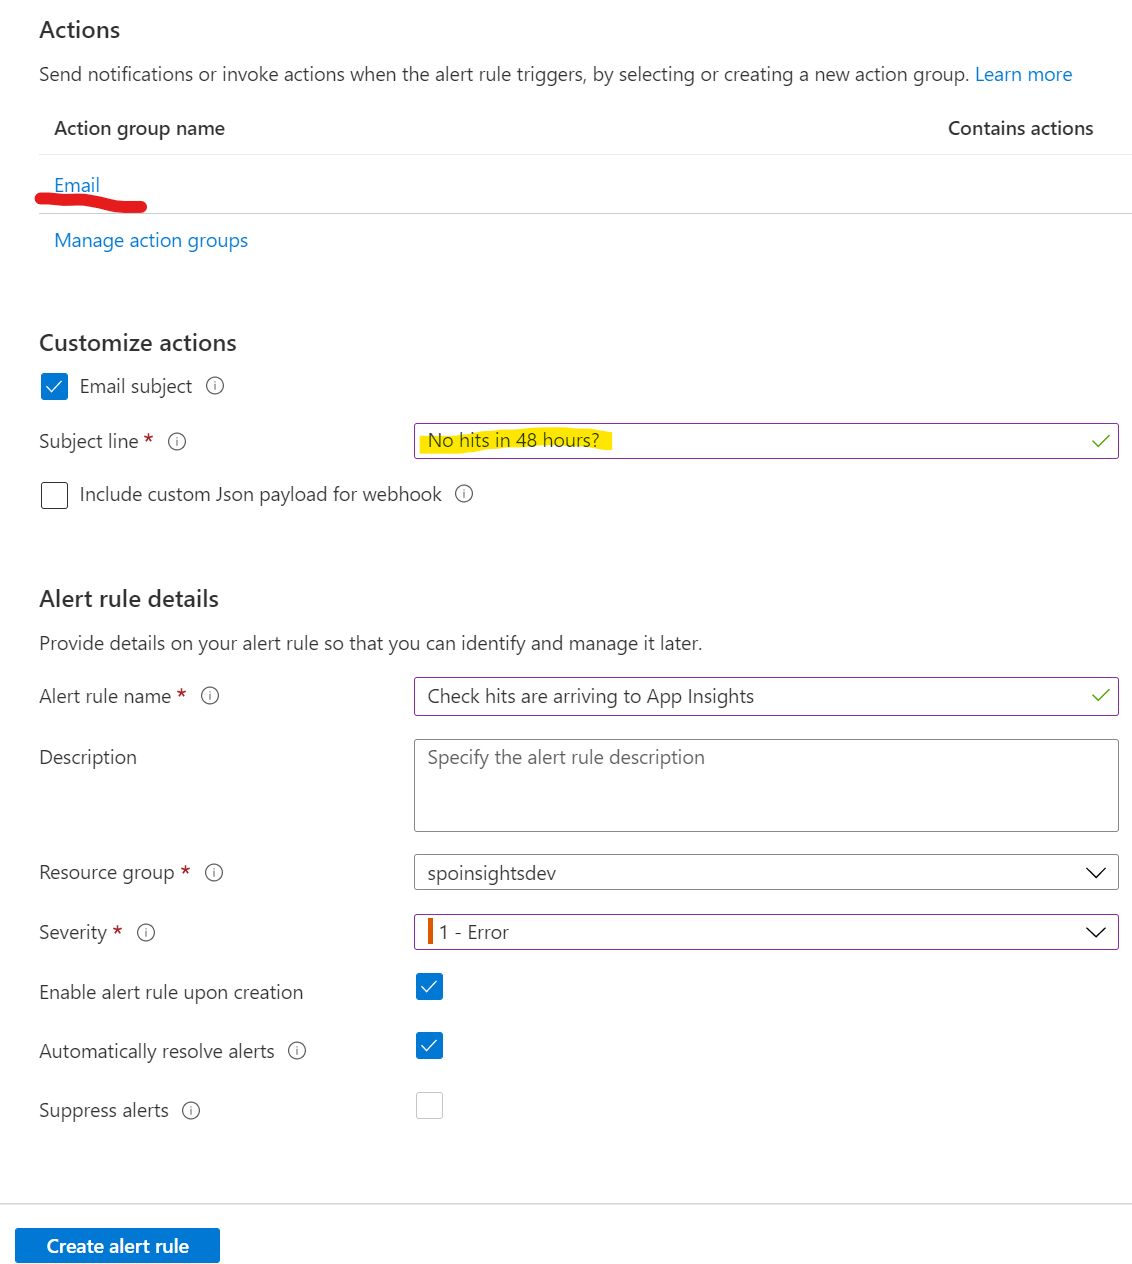
...and create. It will now be active.
The walk-through above is one example; every alert in this guide is created the same way. Two shapes cover everything.
One-time — create a default action group. An action group is the "who to tell" (email, SMS, Teams/webhook, Logic App). Create one under Monitor → Alerts → Action groups (for example M365-Analytics-alerts) with an email receiver, then reuse it for every rule so recipients are configured in one place.
Add a log-search (KQL) alert — for the custom-event / exception rules (most of this page):
- Open the Application Insights resource → Logs, paste the query and confirm it returns rows.
- Click New alert rule at the top of the Logs blade — the query carries over as the condition.
- Measurement: aggregate Table rows / Count; set the threshold and the Aggregation granularity + Frequency of evaluation to match the window (e.g. 30 min for liveness, 24 h for a stalled cycle).
- For "alert when there are no rows" rules (a stalled import, no heartbeat), use Number of results = 0 with the window as the evaluation period.
- Actions → select the default action group. Details → name + severity → Create.
Add a metric alert — for capacity rules (SQL DTU, App Service CPU, Service Bus dead-letter):
- Open the resource (SQL DB / App Service Plan / Service Bus) → Alerts → New alert rule.
- Condition → pick the platform metric (e.g. DTU percentage, CPU Percentage, Dead-lettered messages), set operator / threshold / window.
- Actions → default action group. Name + severity → Create.
Write the threshold you chose next to each rule (or in the rule description) so whoever inherits the system can tune it.
To create alerts for the other rules, here are the triggers you need to create. Except where noted, all are based on the "Custom log search" signal in Application Insights and fire when the result count crosses the threshold shown.
These alerts cover the three main import phases driven by the Office365ActivityImporter web-job: the audit/activity import (Office 365 Management Activity API), and the Graph user-metadata refresh. Under normal operation an import cycle completes about every 10 minutes (see the "Waiting 10 mins..." trace), so the thresholds below are deliberately generous so they only fire on a real stall.
- Activity import cycle has stalled (no end-of-cycle log)
| App Insights Query | Time Period | Trigger count |
|---|---|---|
traces | where operation_Name == "Office365ActivityImporter" and message startswith "Finished activity import" |
24 hours (1440 minutes) | 0 |
This is the message logged at the very end of an activity-import cycle (ProgramTasks.DownloadActivityData in WebJob.Office365ActivityImporter). The line also carries the run-time and the ImportStat summary, so a missing one for 24h indicates the importer has died, is crash-looping, or is blocked on a long Activity API page.
- No audit events received from the Activity API
| App Insights Query | Time Period | Trigger count |
|---|---|---|
traces | where operation_Name == "Office365ActivityImporter" and message startswith "Audit events import: Got" |
6 hours (360 minutes) | 0 |
This trace is emitted by ActivityImporter once per cycle and includes the number of audit events returned from the Office 365 Management Activity API ("Audit events import: Got {N} audit events from {M} summary reports..."). A long gap means either the Activity API is failing for this tenant (auth/permissions/tenant-side outage) or the importer is no longer reaching the audit phase — both warrant immediate investigation. The 6-hour window is short enough to catch a real outage but long enough to ride out a slow import or transient Graph 5xx.
- User metadata import has stopped completing
| App Insights Query | Time Period | Trigger count |
|---|---|---|
traces | where operation_Name == "Office365ActivityImporter" and message startswith "User import - complete" |
24 hours (1440 minutes) | 0 |
This trace is the final line of UserMetadataUpdater.RunUpdate ("User import - complete. Inserted {N} new users, updated metadata for {N} existing users..."). If it doesn't appear in a 24-hour window, the Graph user import is either disabled, throwing repeatedly, or running but never finishing (e.g. throttled by Graph). Two common false-positive cases to be aware of:
-
The trace
"Skipping user metadata import"is emitted when the user import is intentionally turned off in configuration — if you've disabled it, also disable this alert. -
If user import permissions are missing, the parent step logs
"ERROR: Can't access Teams user data - are application permissions configured correctly?"and the cycle returns early. Pair this rule with the next one to distinguish the two scenarios. -
Graph/Teams import is being skipped because of permissions
| App Insights Query | Time Period | Trigger count |
|---|---|---|
traces | where message startswith "ERROR: Can't access Teams user data" |
1 hour | > 0 |
Fires when the Graph application permissions have been revoked or the app secret/certificate has gone stale. The web-job swallows the 403 from Microsoft Graph and logs this warning instead of crashing, so without an alert the user metadata and Teams import will silently stop refreshing.
- Issues writing data into SQL
| App Insights Query | Time Period | Trigger count |
|---|---|---|
exceptions | where outerMessage contains "because the database is read-only" |
10 minutes | > 2 |
exceptions | where outerType == "System.Data.SqlClient.SqlException" |
1 hour | > 10 |
The first query surfaces "database full" situations on Azure SQL (the server forces the database into read-only when it reaches its max size). The second one catches persistent SQL errors of any kind. The web-jobs use System.Data.SqlClient, so outerType is the correct match — if you ever migrate the project to Microsoft.Data.SqlClient, update the rule to match.
- App Service Plan
For this, you need to add an alert to the App Service Plan that hosts the web app and web-jobs (not on an individual App Service).
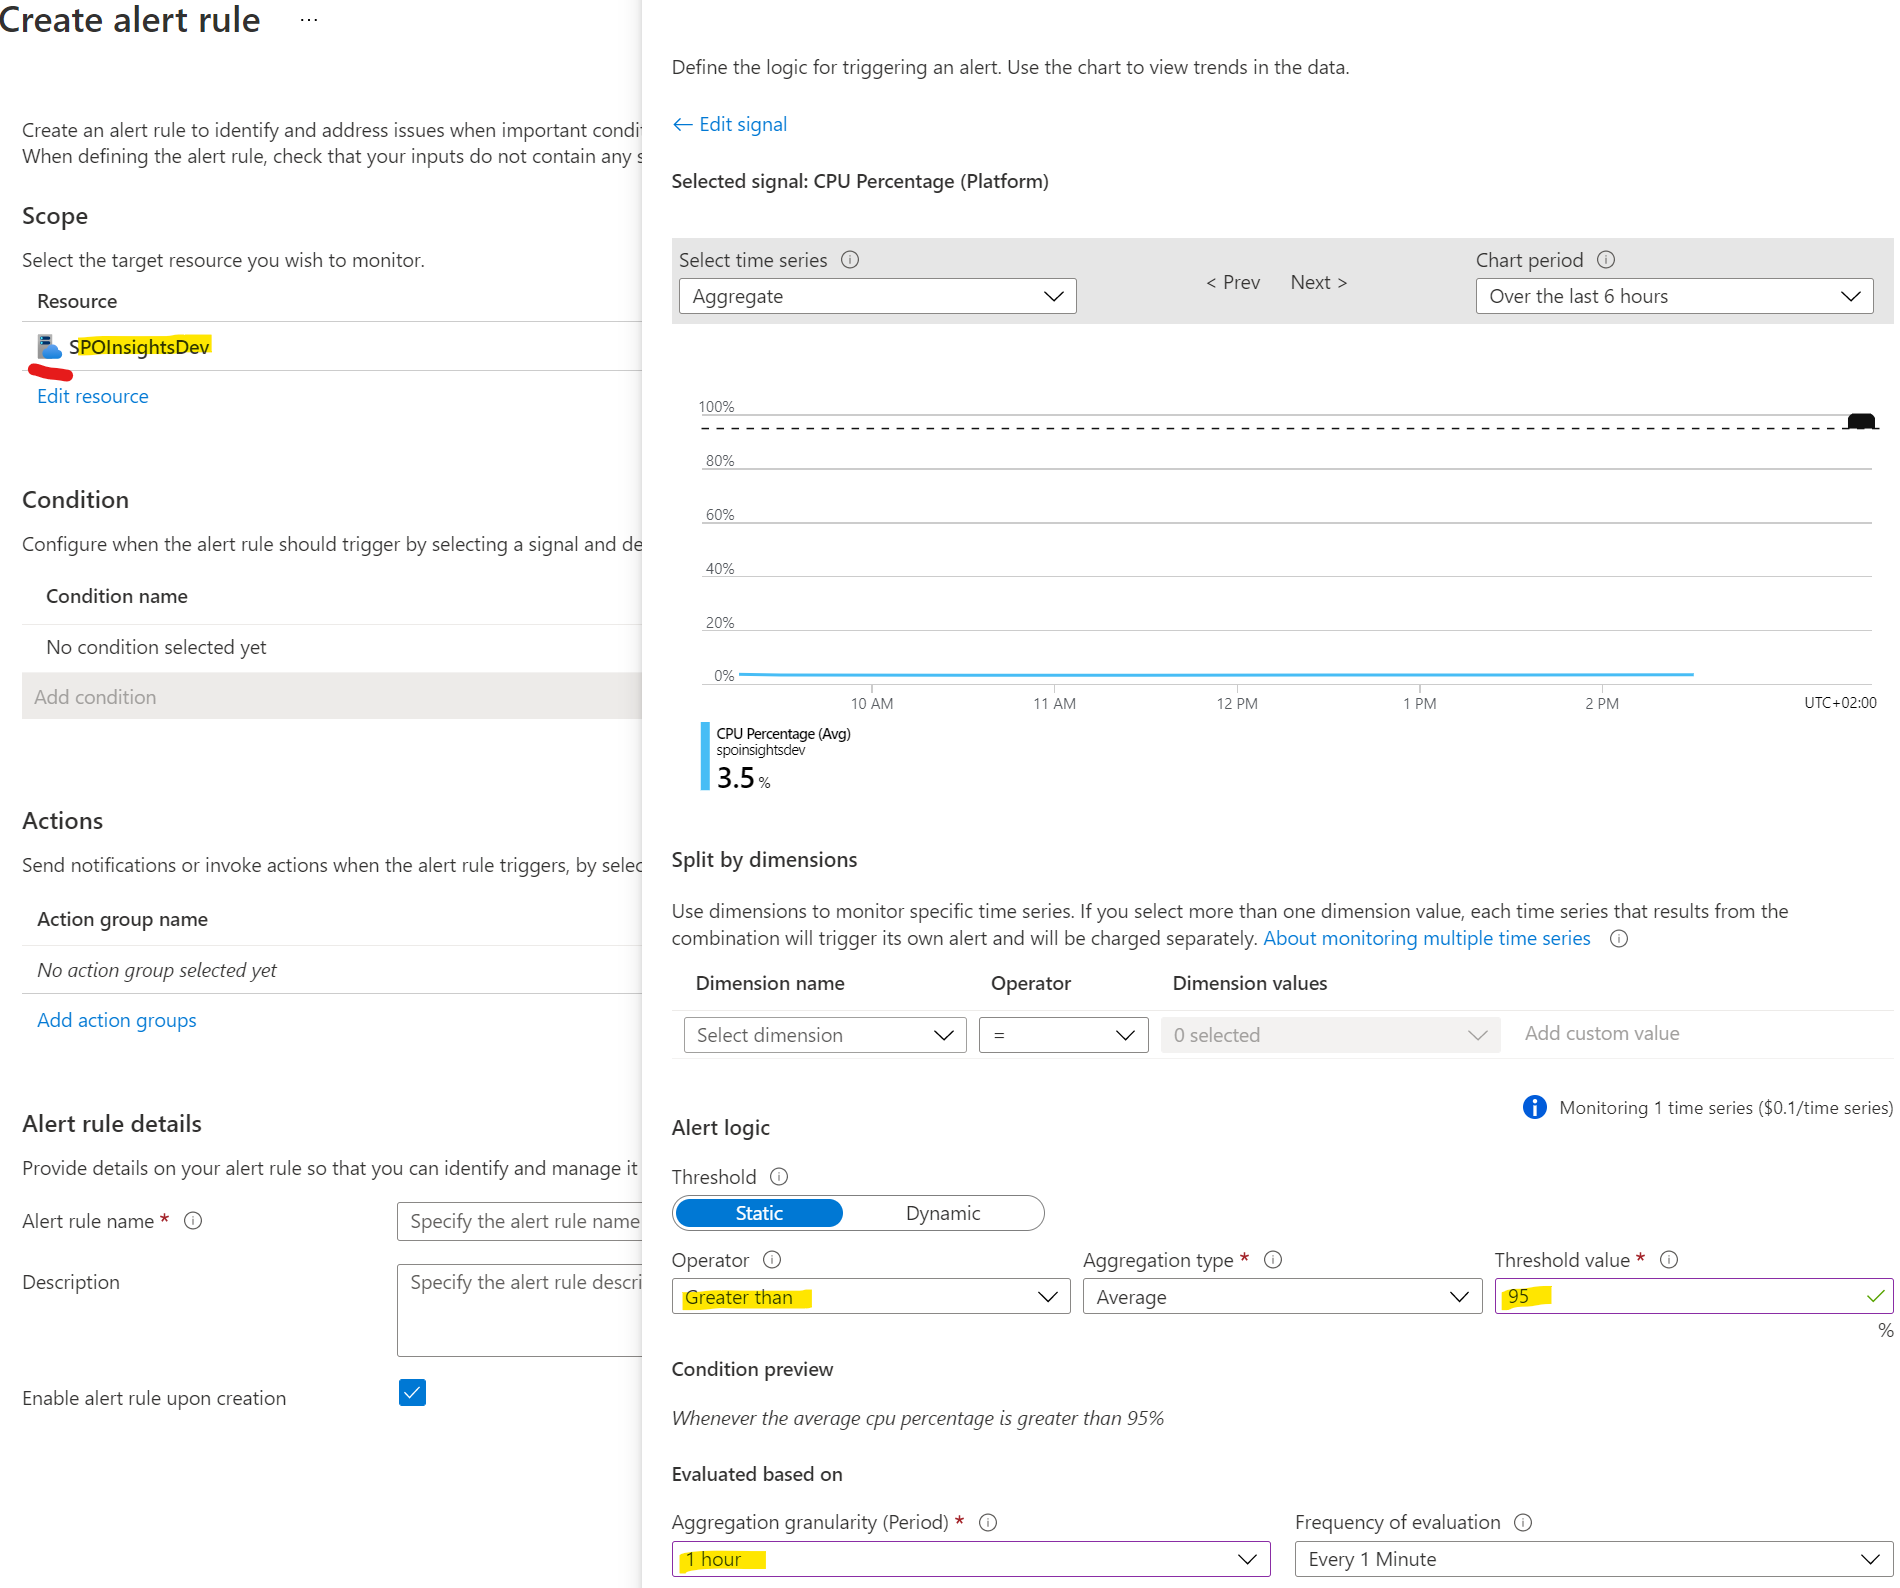
It's normal to have high CPU during an import cycle, so set this trigger value high (e.g. > 90% average) for a fairly long period (e.g. 1 hour) to avoid noise.
- SQL Database
Create the alert on the database & select DTU percentage for the signal (not DTUs used). DTUs are a simplified measure of CPU, memory, and disk I/O all together. If the database is consistently at 100% then you need to scale up the number of DTUs available.
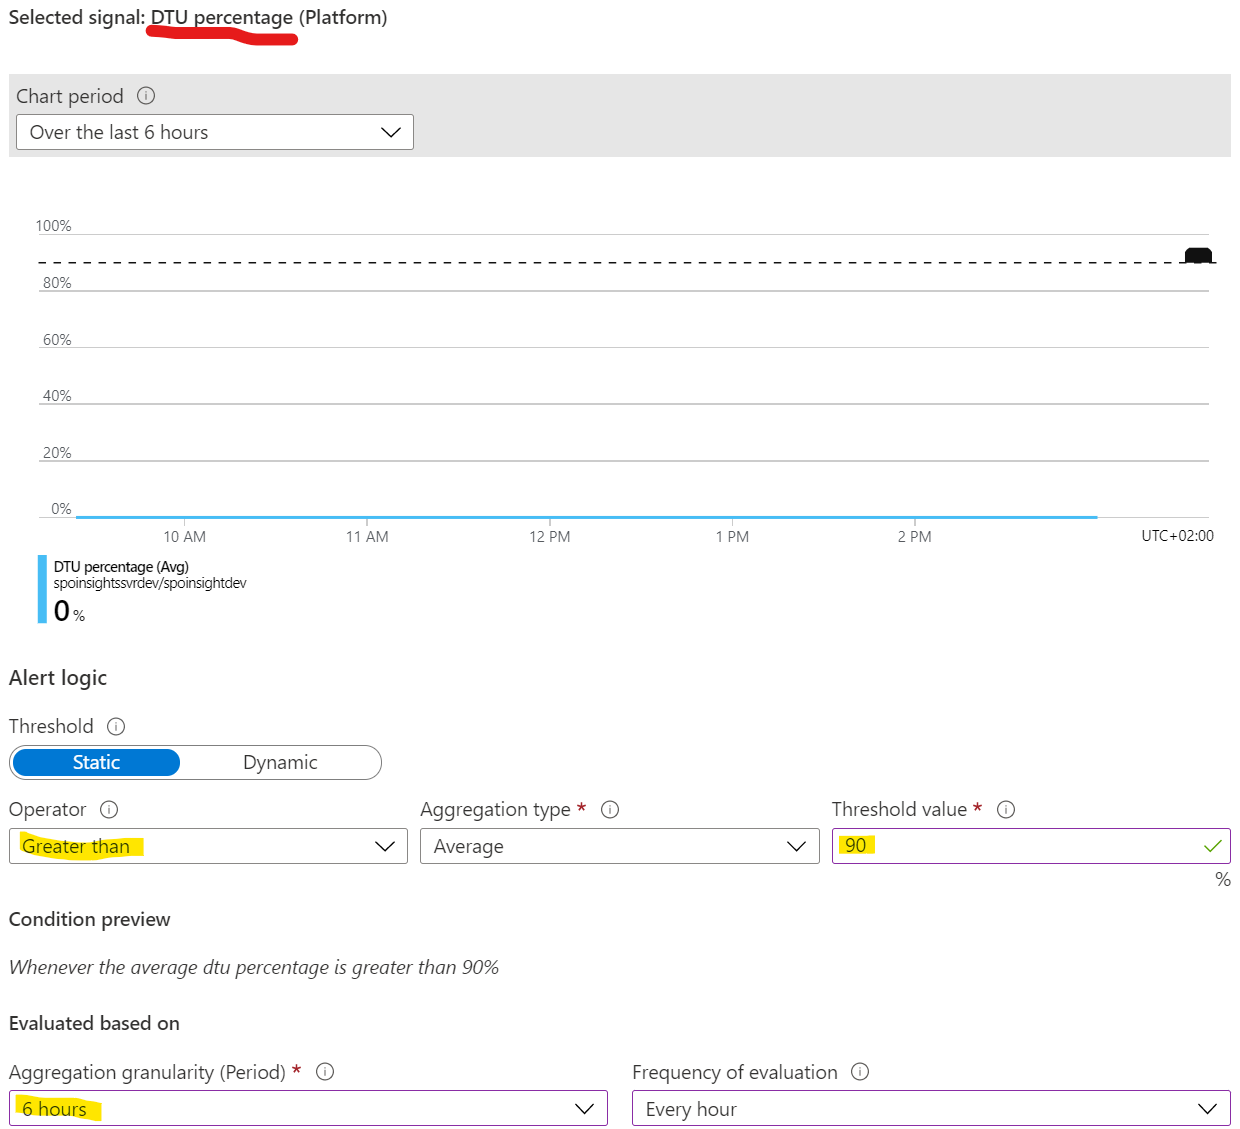
DTUs explained — Service tiers - DTU-based purchase model - Azure SQL Database | Microsoft Docs.
- Azure Cache for Redis
Redis is unlikely to need scaling as its usage is fairly limited, but just in case, measure Server Load and alert when it stays above 80% for an extended period.
- Service Bus (only if the Teams calls import is enabled)
Service Bus may need scaling if the number of Teams calls to be tracked is very high. Alert on the Throttled Requests metric (should stay at 0) and Server Errors (also 0). If you start to see throttling, scale the namespace up.
- Entra ID (AAD) app-secret expiration
| App Insights Query | Time Period | Trigger count |
|---|---|---|
exceptions | where innermostMessage contains "Invalid client secret is provided" |
10 minutes | > 2 |
This catches the standard AAD/MSAL error (AADSTS7000215) raised when the configured app secret has expired or been rotated. Rotate the secret in Entra ID and update the configuration in Key Vault / App Service settings to clear it.
These rules build on the uniform health telemetry and the cycle/section custom events (see the Monitoring page); they are also what the in-app Health tab surfaces. The HealthCheck and ImporterHeartbeat events are emitted by a later runtime phase — you can create these rules now, they simply won't fire until that telemetry starts flowing. Until then, the Activity import cycle has stalled data-flow rule above is the interim liveness signal.
- Any component reported unhealthy
| App Insights Query | Time Period | Trigger count |
|---|---|---|
customEvents | where name == "HealthCheck" and tostring(customDimensions.Status) == "Unhealthy" |
15 minutes | > 0 |
One generic rule covers SQL, Activity API, Graph, Key Vault, Redis, Service Bus, the runtime credential and DNS — the Component dimension tells you which one failed. Append and tostring(customDimensions.Component) == "Sql" to alert on a single component only.
- Web-jobs not heartbeating (alert when the result is 0)
| App Insights Query | Time Period | Trigger count |
|---|---|---|
customEvents | where name in ("ImporterHeartbeat", "FinishedImportCycle") | summarize beats = count() |
30 minutes | 0 |
Fires when neither importer has produced a heartbeat or completed a cycle in the window — i.e. the web-jobs are dead or crash-looping. ImporterHeartbeat is the target signal (it survives a job stuck mid-cycle, which FinishedImportCycle cannot); FinishedImportCycle is included so the rule already works today, before the heartbeat host ships.
- Runtime credential expiring soon
| App Insights Query | Time Period | Trigger count |
|---|---|---|
customEvents | where name == "HealthCheck" and tostring(customDimensions.Component) == "Credential" | extend days = toint(customDimensions.DaysToExpiry) | where days < 14 |
1 hour | > 0 |
Proactively warns before the app secret / certificate expires and imports start failing with auth errors (which the permissions alert above only catches after the fact). Add a second, higher-severity rule at days < 3 for a "critical" warning.
- Exception spike (general health probe)
| App Insights Query | Time Period | Trigger count |
|---|---|---|
exceptions | summarize errors = count() |
1 hour | > your baseline |
A cheap catch-all: a rising total exception count flags failures that no specific rule anticipates (a brand-new error, an uncovered dependency, a code regression). Pick a threshold a little above your normal hourly volume — the Exceptions sub-section of Administration → Service health shows what that baseline looks like.
The original guidance also listed alerts for the standalone Yammer importer. Yammer is now imported through the standard Microsoft 365 admin-report APIs by the Microsoft 365 Activity Importer, so the dedicated Yammer alerts are no longer applicable. Yammer auth issues will surface in the generic
SqlException/ activity-import alerts above.