Grid metrics
On this page:
Link back to the table of contents.
In the epm package, there are two types of diversity metrics that can be calculated: (1) metrics calculated for individual grid cells, and (2) metrics that evaluate differences across neighborhoods of grid cells.
For per-cell grid metrics, taxonomic/phenotypic/phylogenetic information is summarized according to which species are found in a particular grid cell. A number of diversity metrics have been implemented in the function gridMetrics(). It is also possible to implement other metrics using the function customGridMetric().
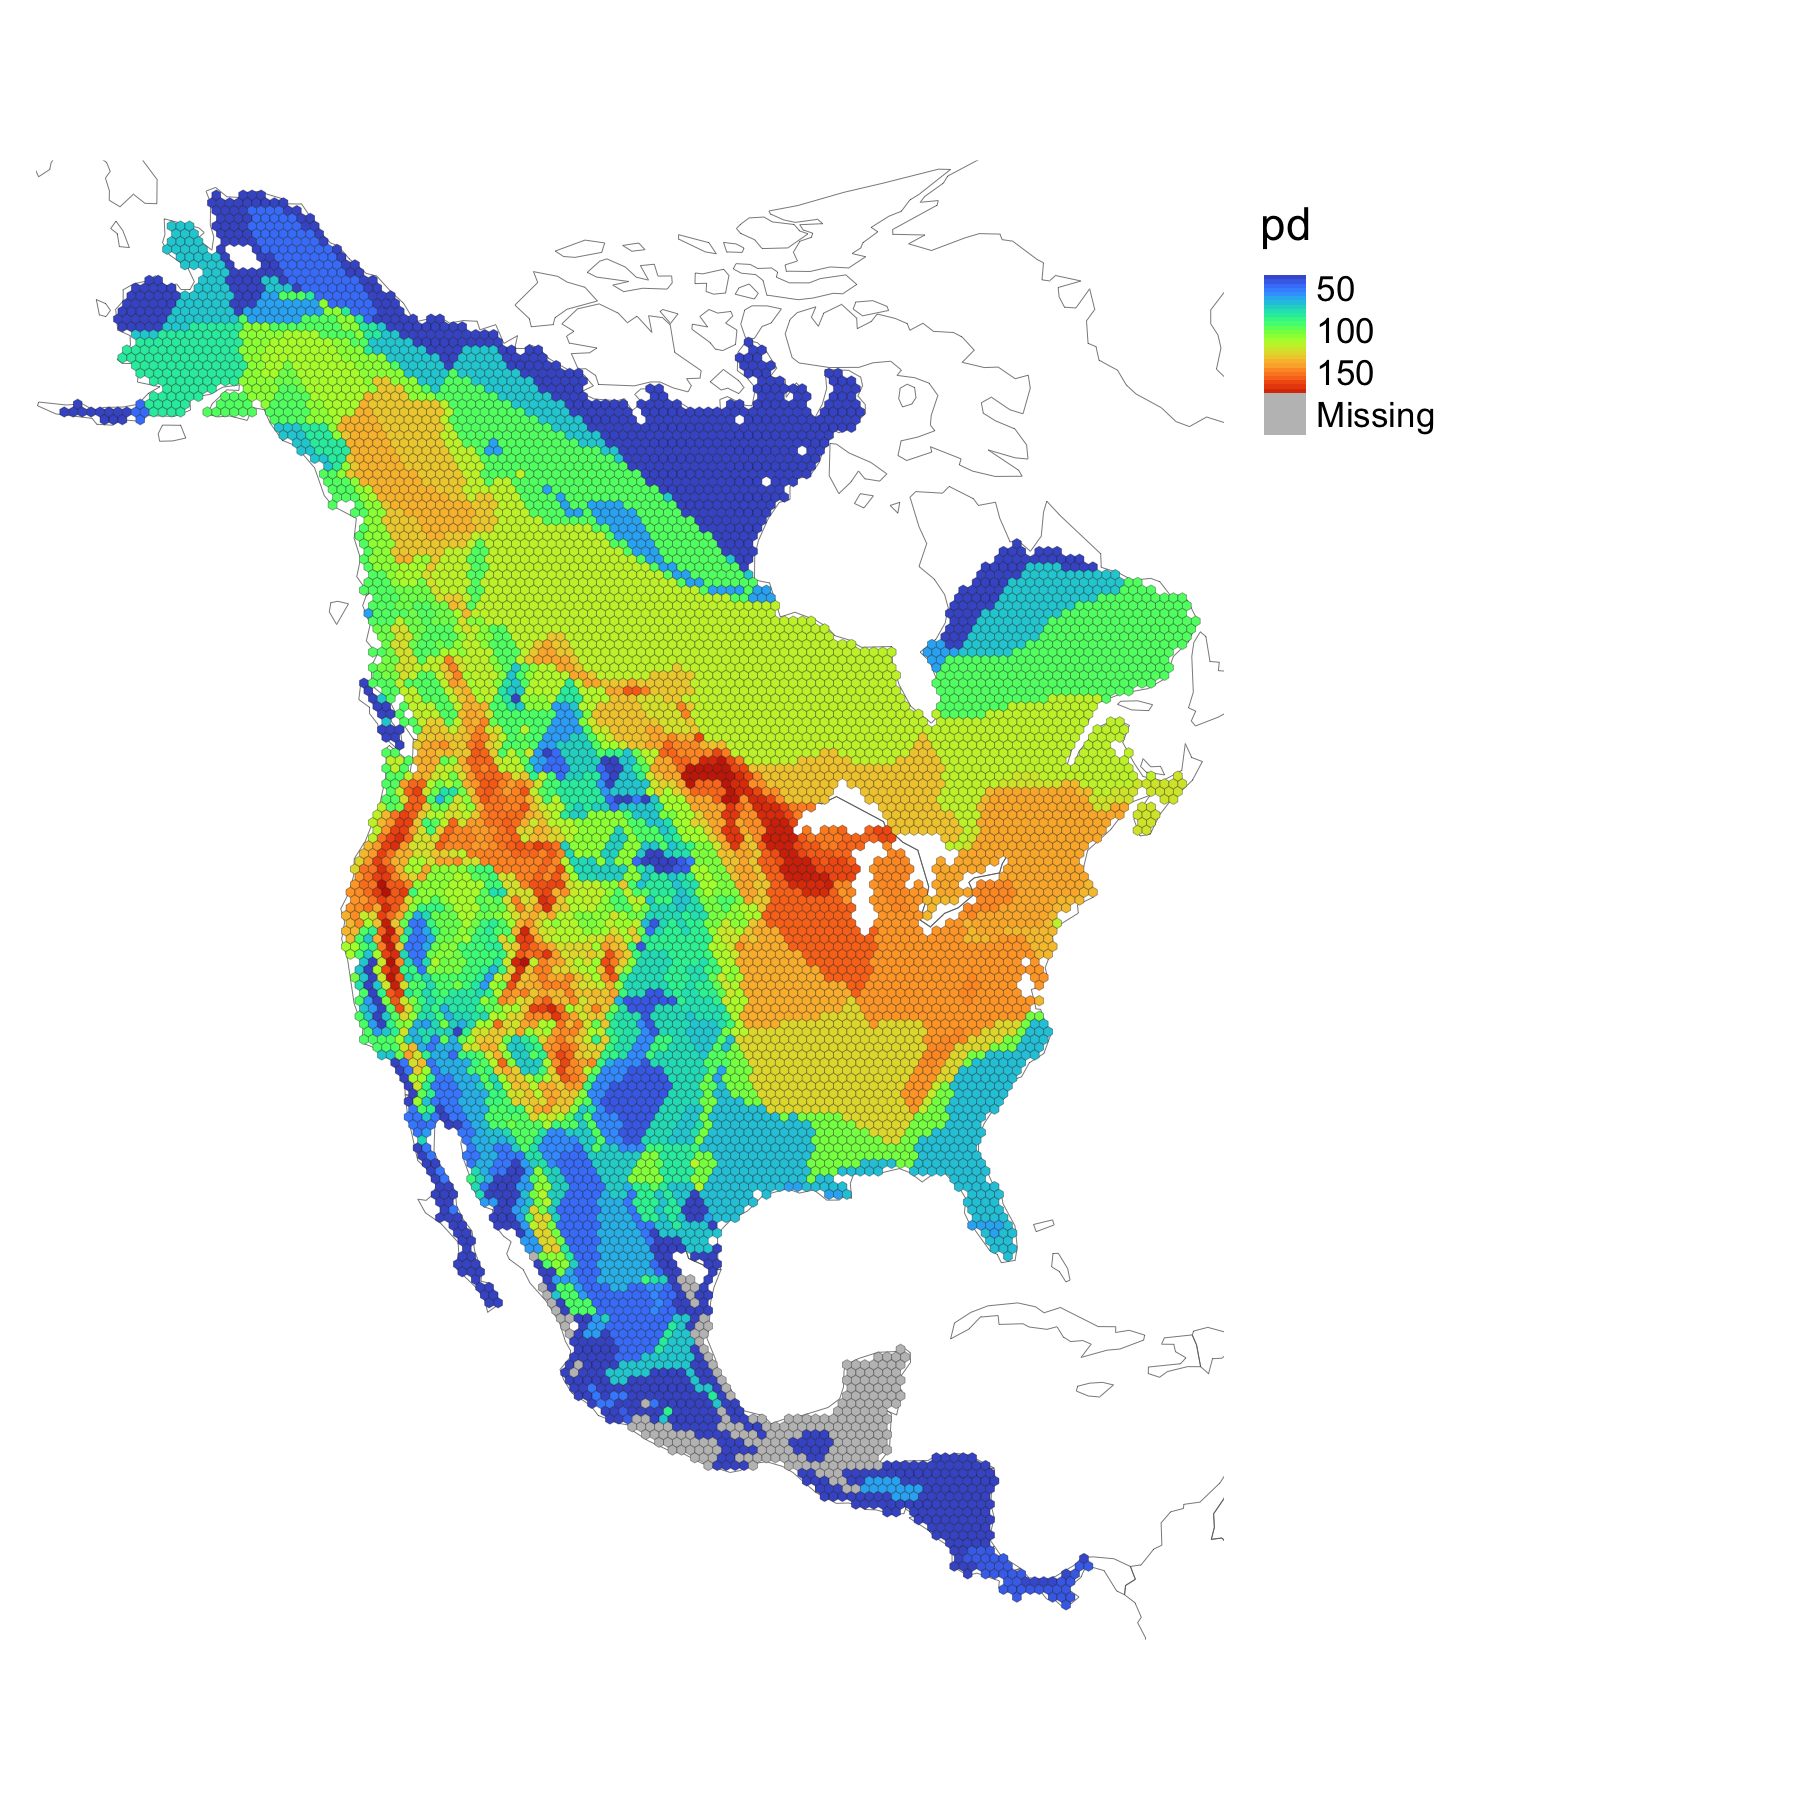
For instance, one can calculate Faith's phylogenetic diversity across grid cells by doing the following:
xx <- gridMetrics(squirrelEPM, metric = 'pd')
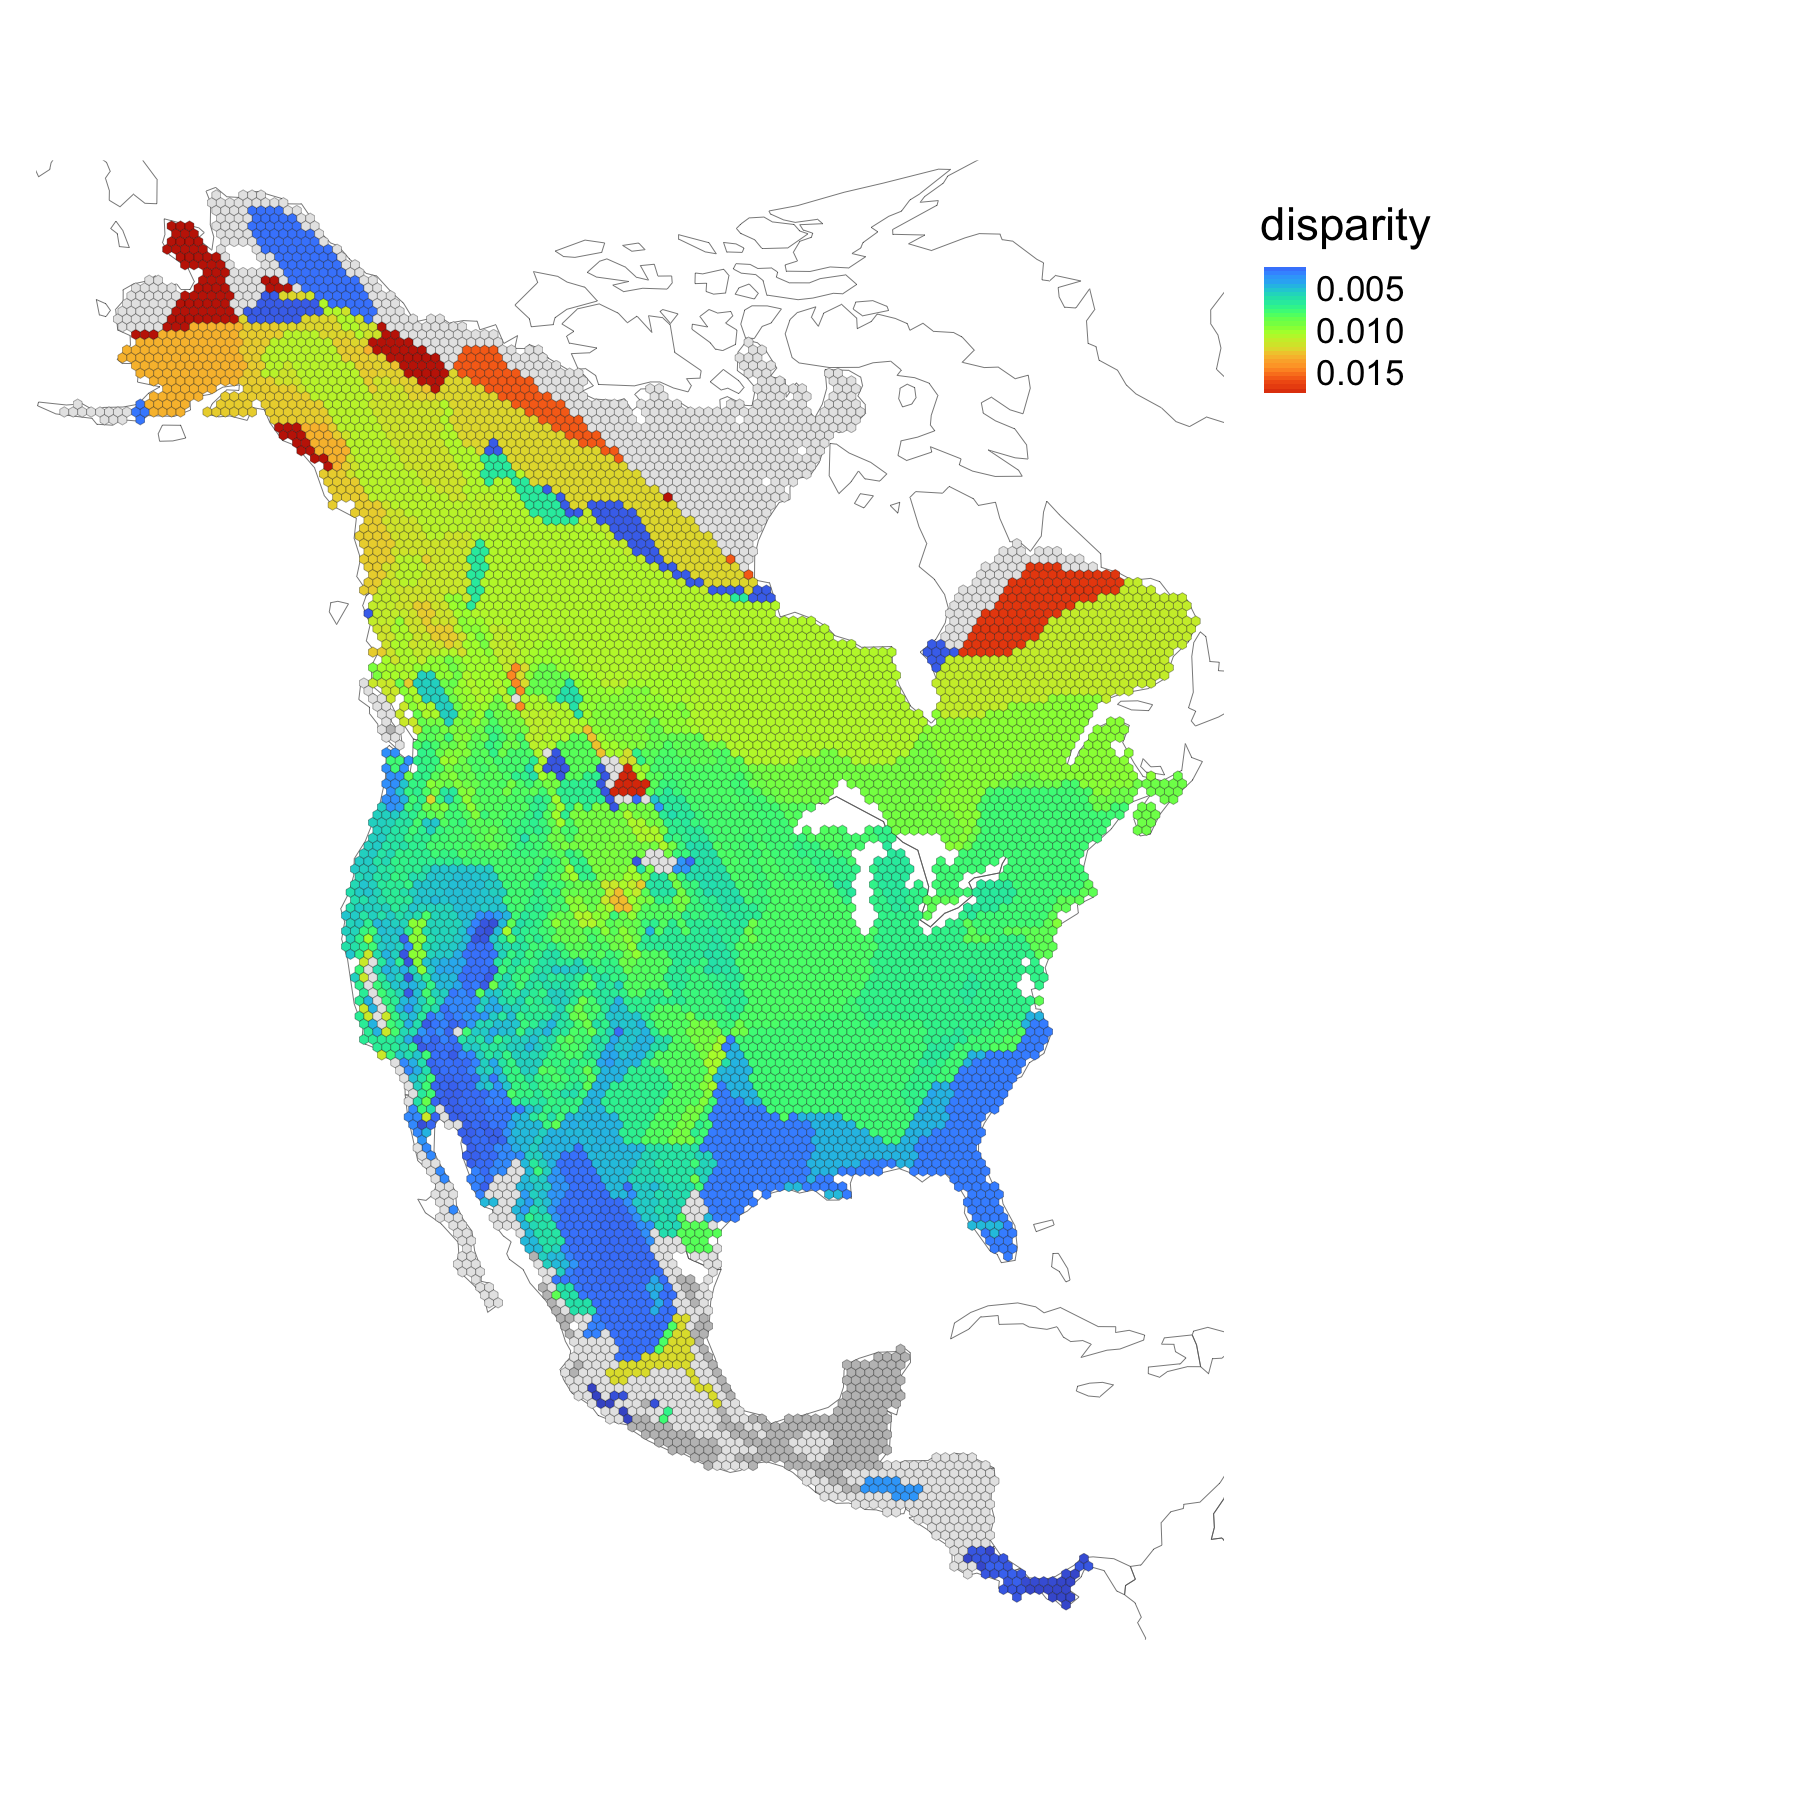
If we have multivariate shape data, we can calculate shape disparity, for instance:
xx <- gridMetrics(squirrelEPM, metric = 'disparity')
To implement metrics that are not available in the gridMetrics() function, you can specify your own function that will be applied to the set of taxa found in each grid cell.
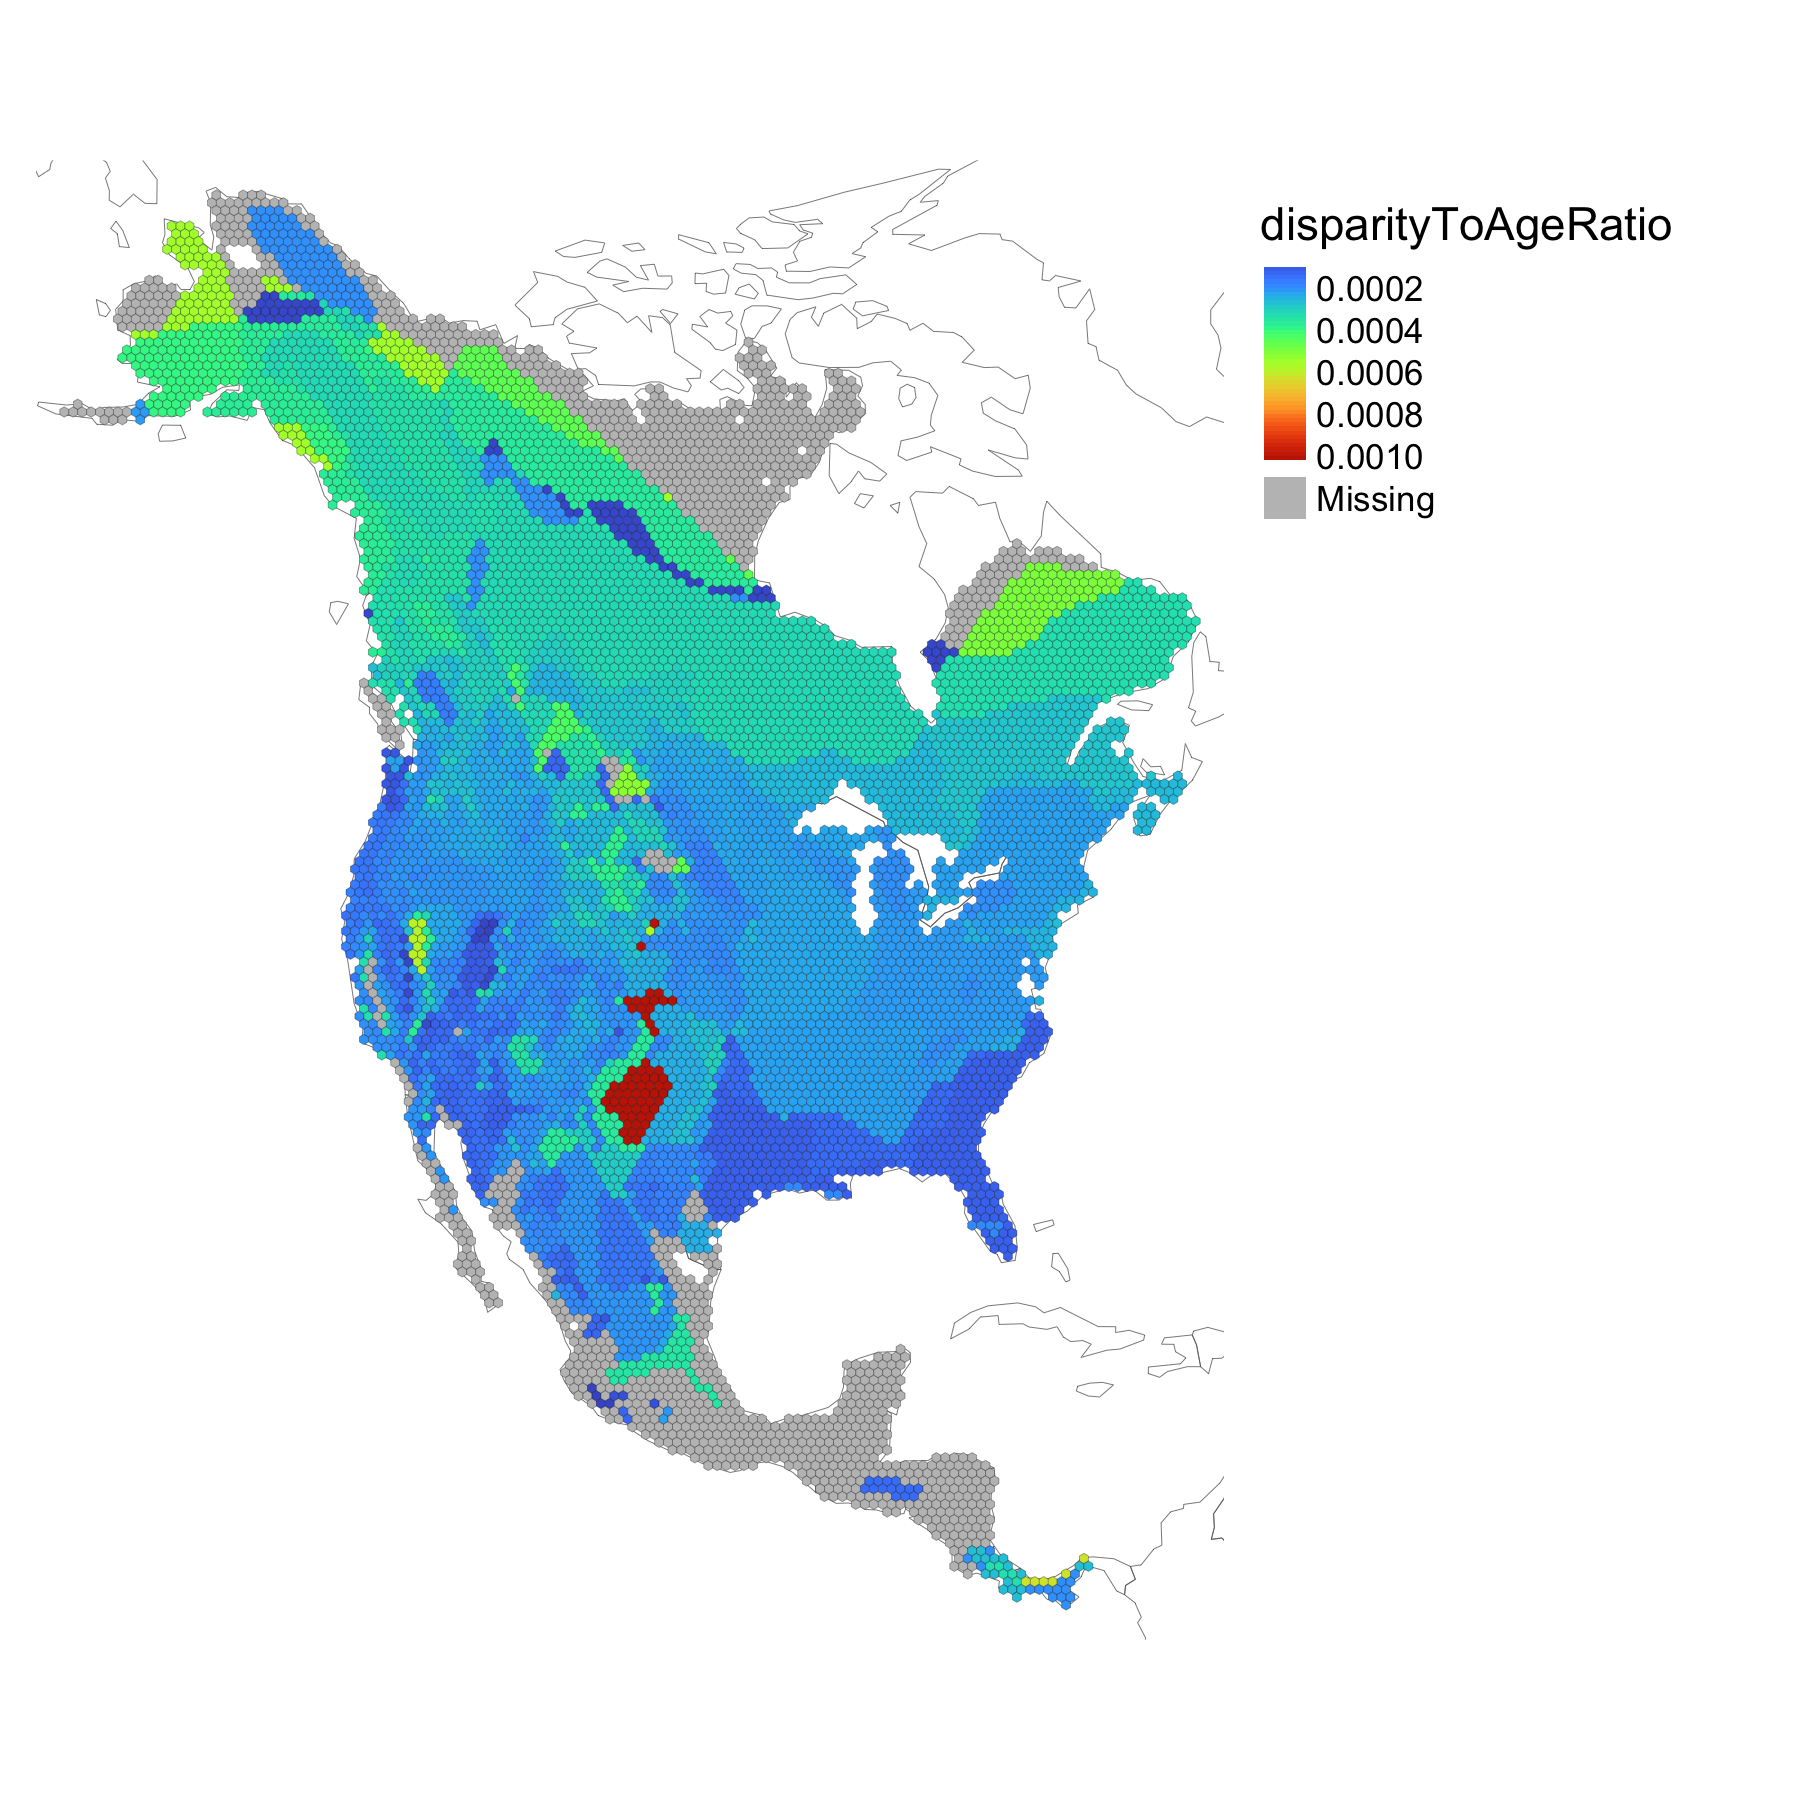
Let's say we were curious about the ratio of morphological disparity to the age of the phylogenetic node uniting the taxa found in each grid cell (this is a contrived example for demonstration purposes).
We can define a function which takes just one input, the species in a grid cell. A requirement is that we must refer to the trait data as dat and the phylogeny as phylo.
library(ape)

f <- function(gridSp) {
	sum(diag(cov(dat[gridSp,]))) / max(branching.times(extract.clade(phylo, getMRCA(phylo, gridSp))))
}
In the function f, the numerator is the way disparity is calculated in the epm package, where dat is the morphological data matrix (with species as rownames). In the denominator, we extract the pylogenetic clade that unites the taxa in a grid cell, and we get the maximum branching time of that clade.
Since both numerator and denominator are measures that only make sense if you have 2 or more taxa, we set minTaxCount = 2. In other words, cells with just 1 species will be skipped.
xx <- customGridMetric(squirrelEPM, fun = f, minTaxCount = 2, metricName = 'disparityToAgeRatio')
Diversity metrics can also be calculated that consider differences between grid cells and their neighbors. It is possible to quantify local turnover in terms of species composition (betadiv_taxonomic()), in terms of phylogenetic structure (betadiv_phylogenetic()) and in terms of morphological shape disparity (betadiv_disparity()).
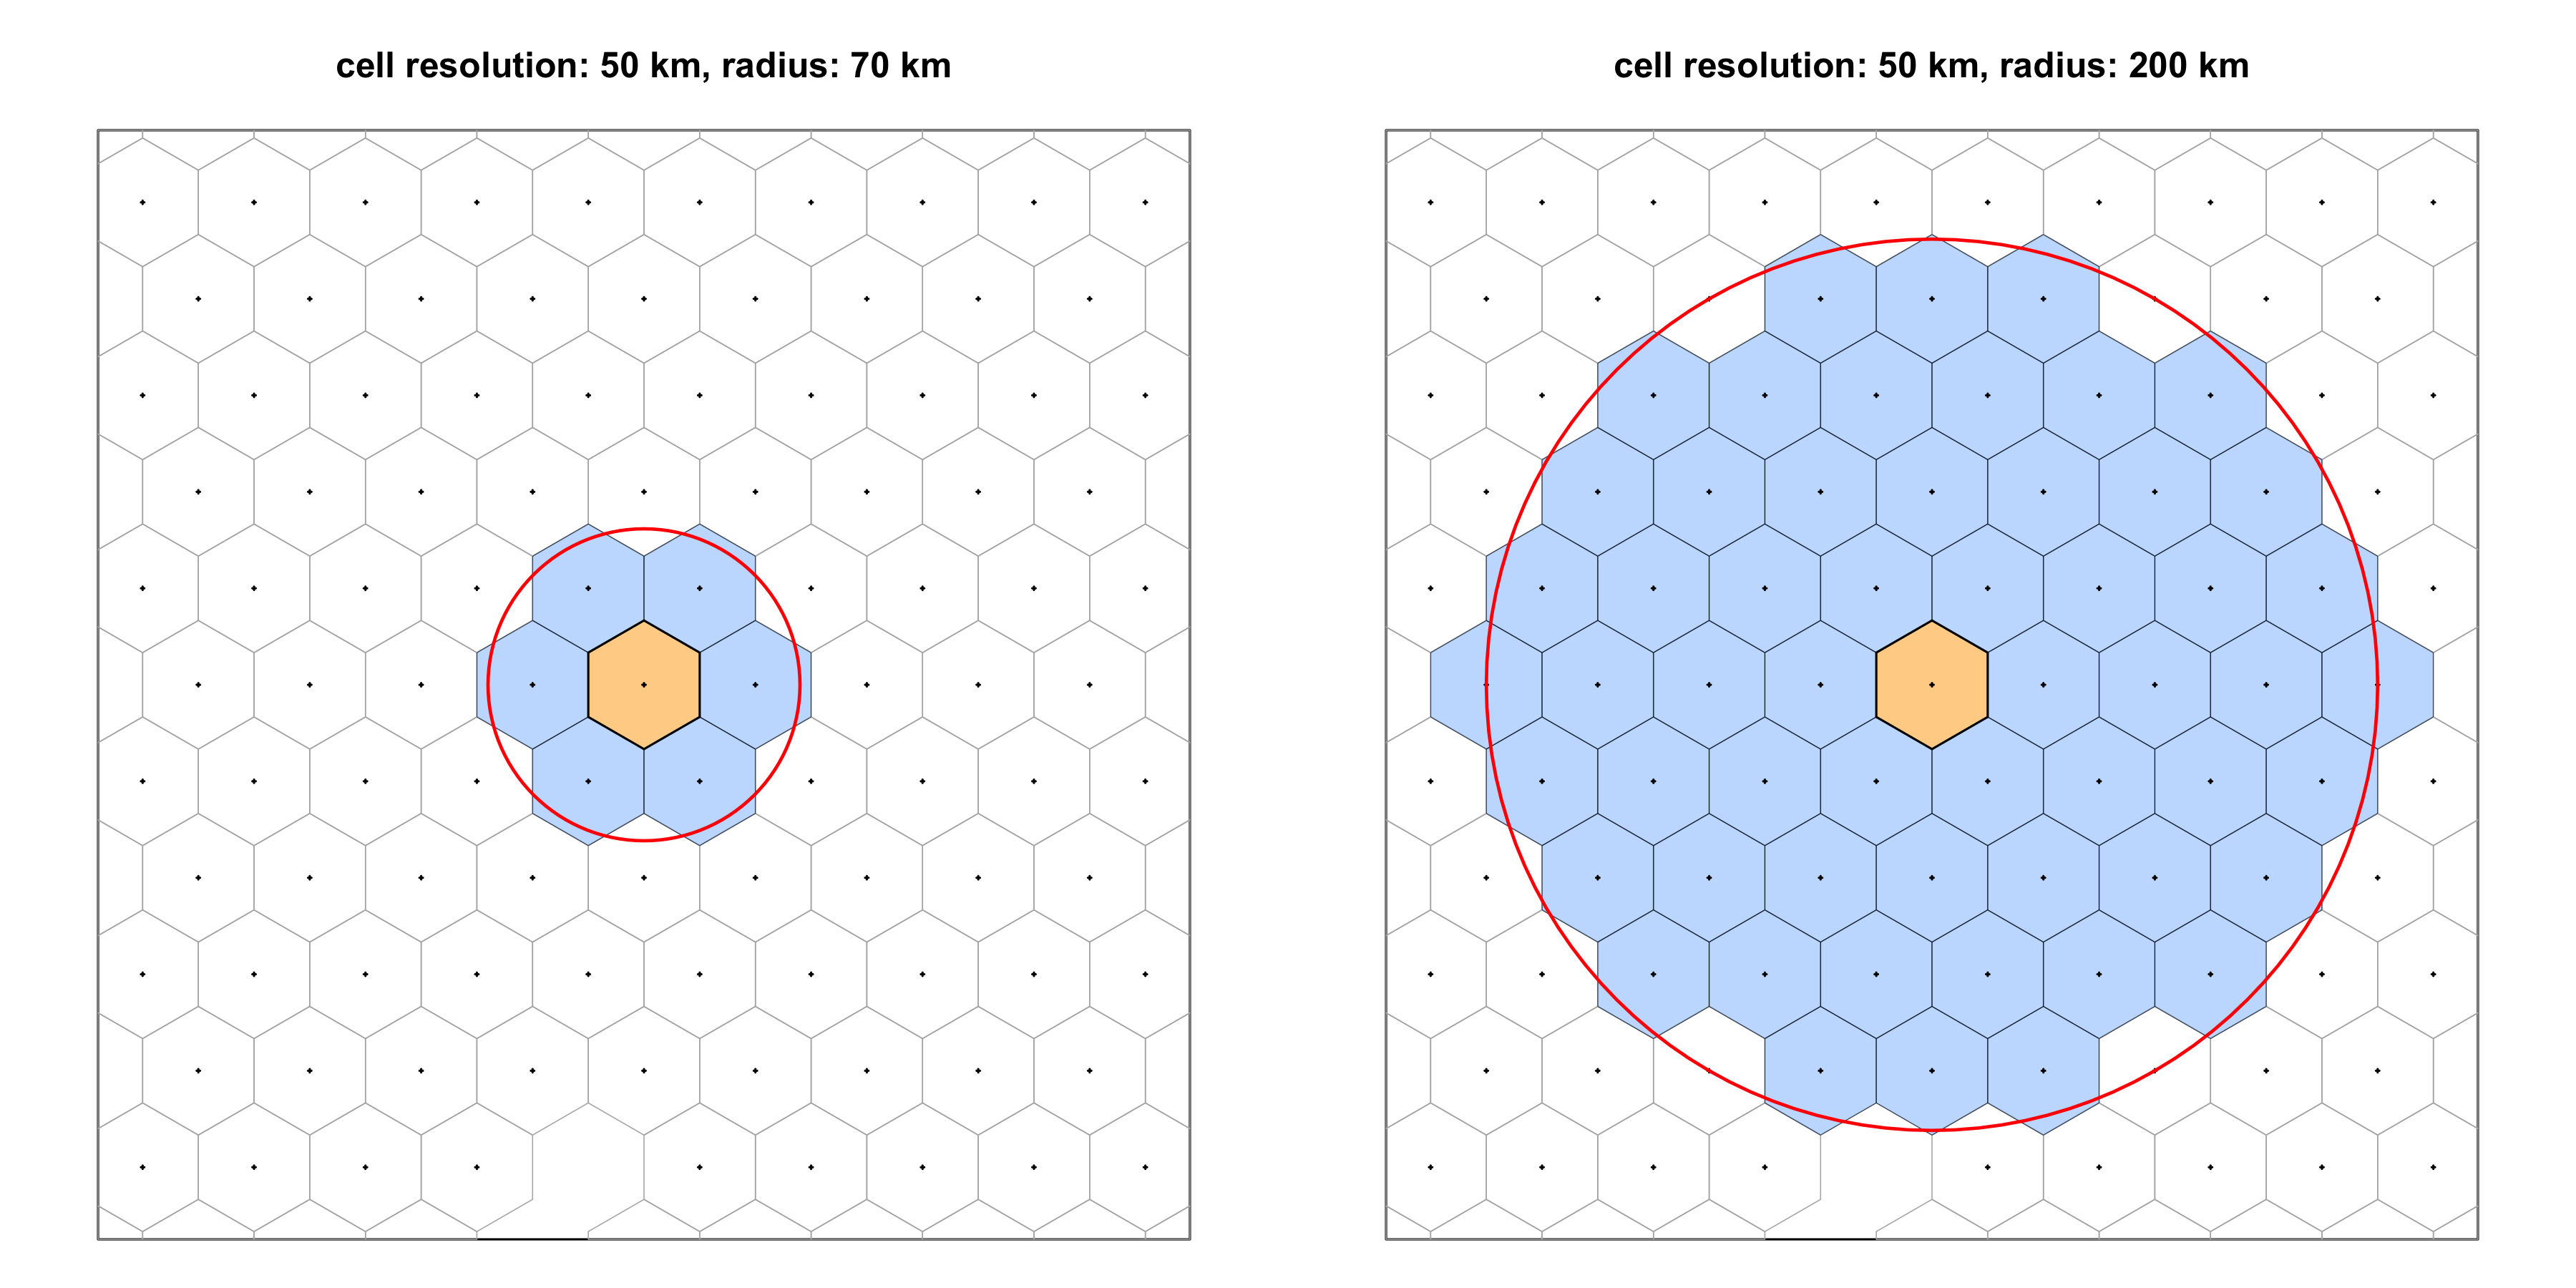
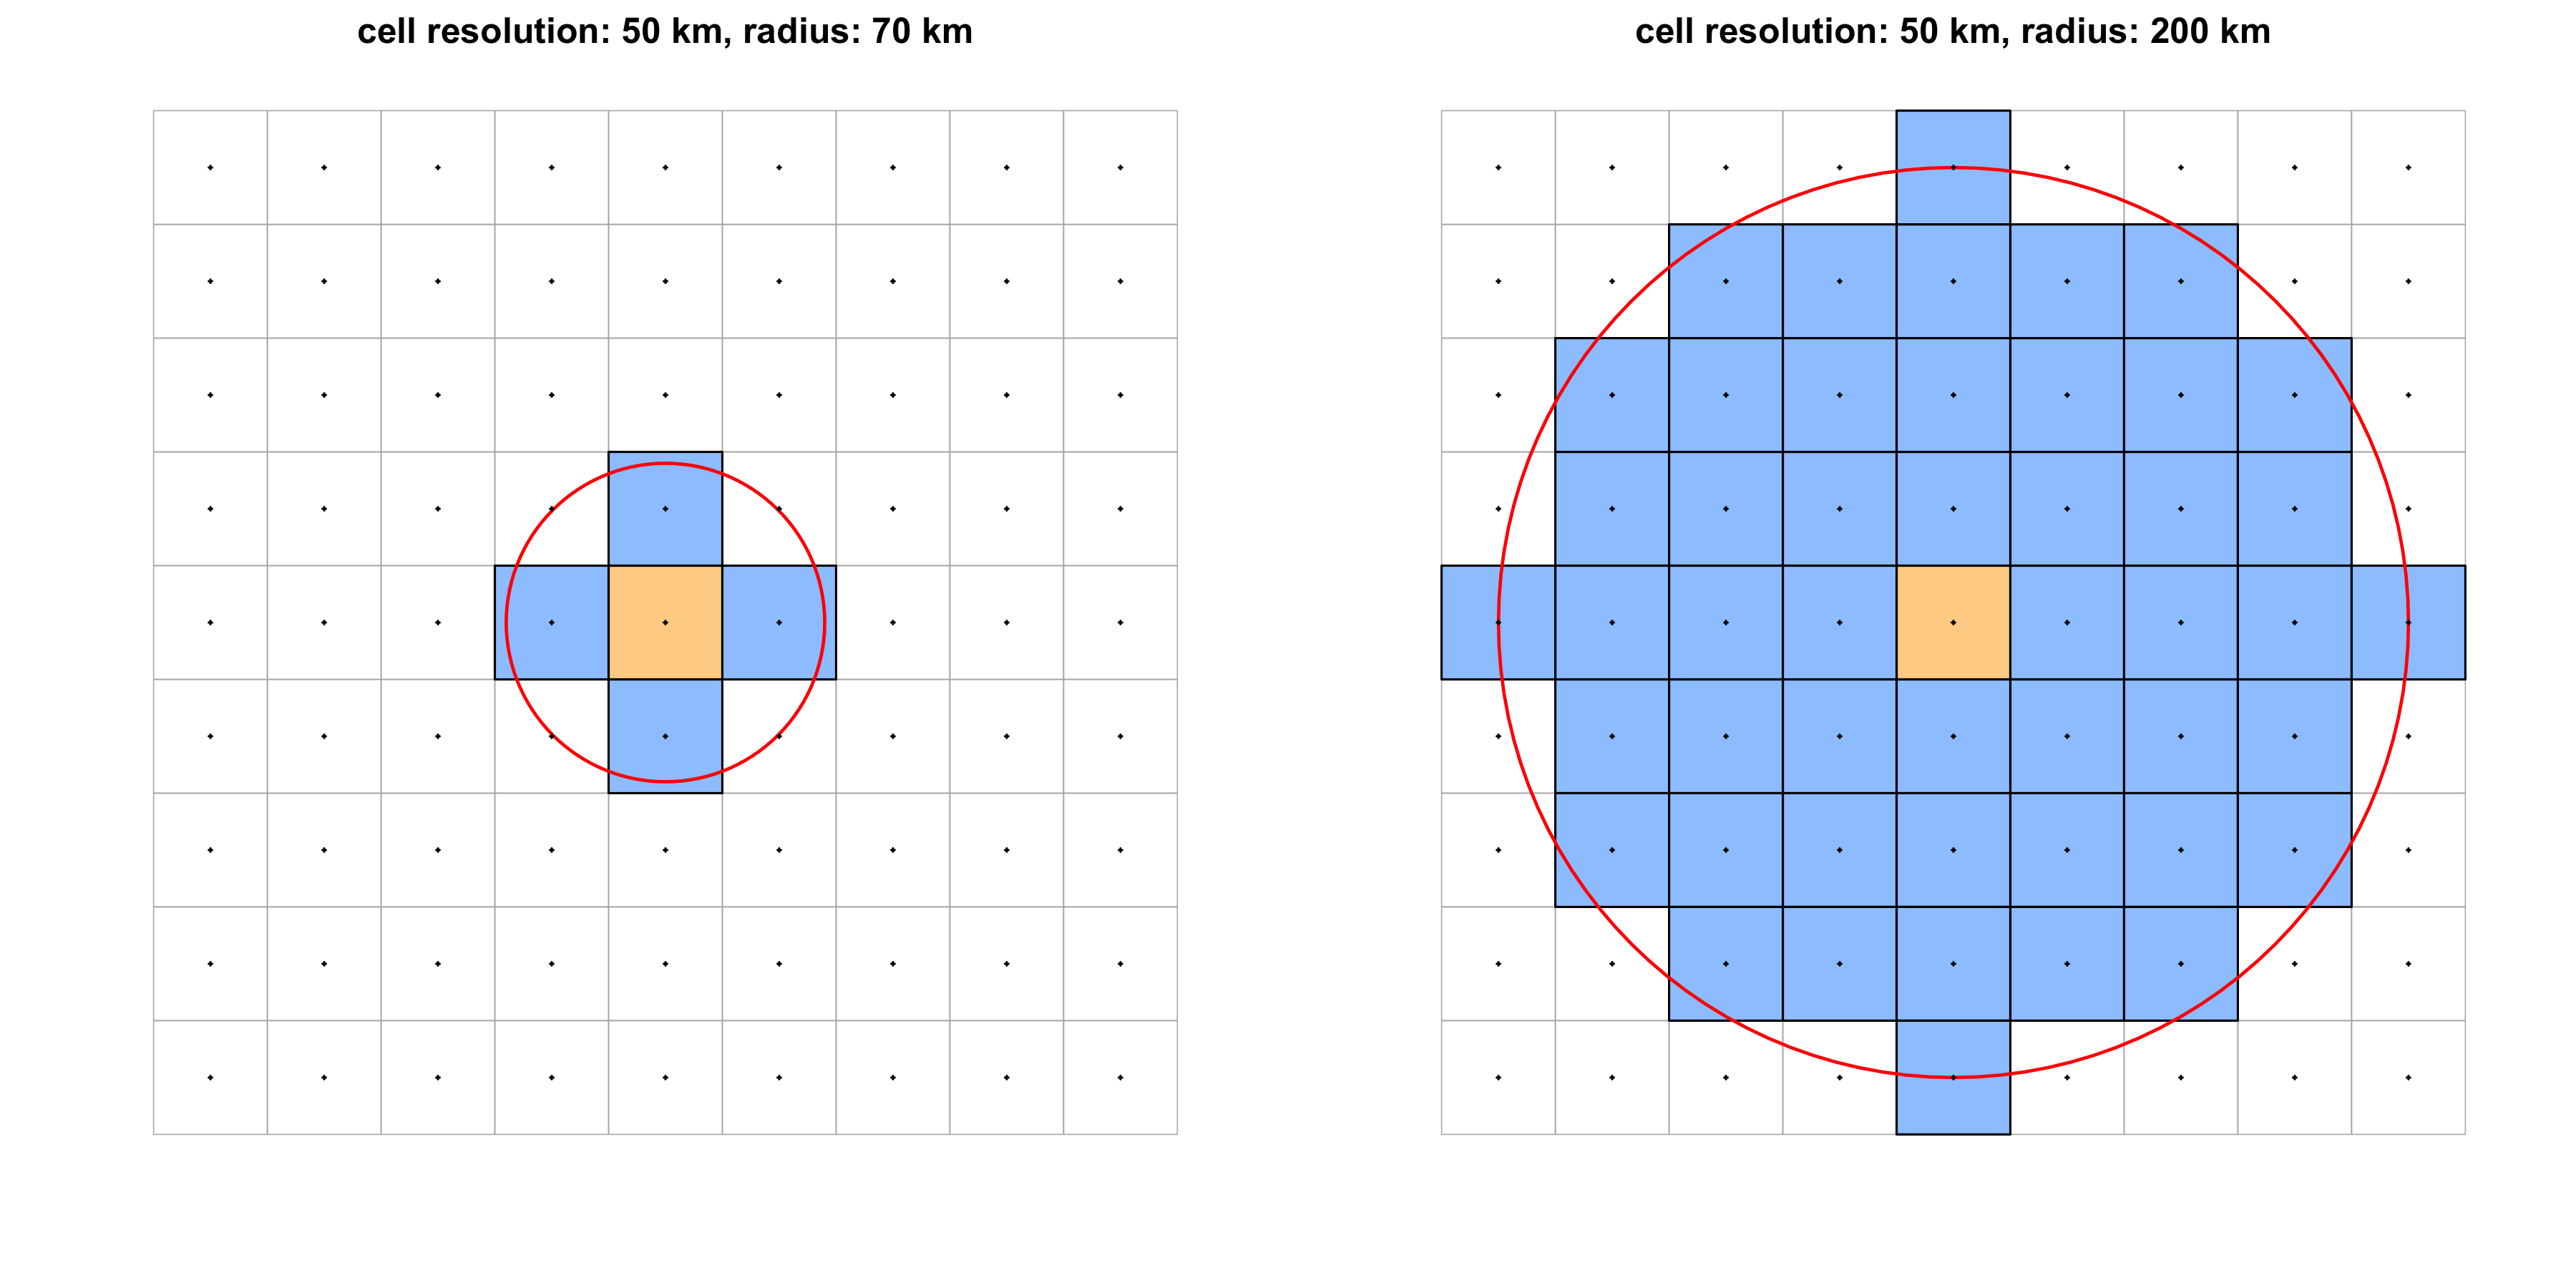
For these metrics, a radius must be specified that defines which grid cells will be considered as neighbors for each focal cell.
For hexagonal cells, this is what that would look like:
And for square cells:
For taxonomic and phylogenetic turnover, we've implemented the multi-site formulas from Baselga (2010, 2012) and Leprieur et al. 2012 that define two additive components that together represent overall turnover. The nestedness component represents turnover that is due to differences in richness, whereas the turnover component represents turnover that is not due to differences in richness.
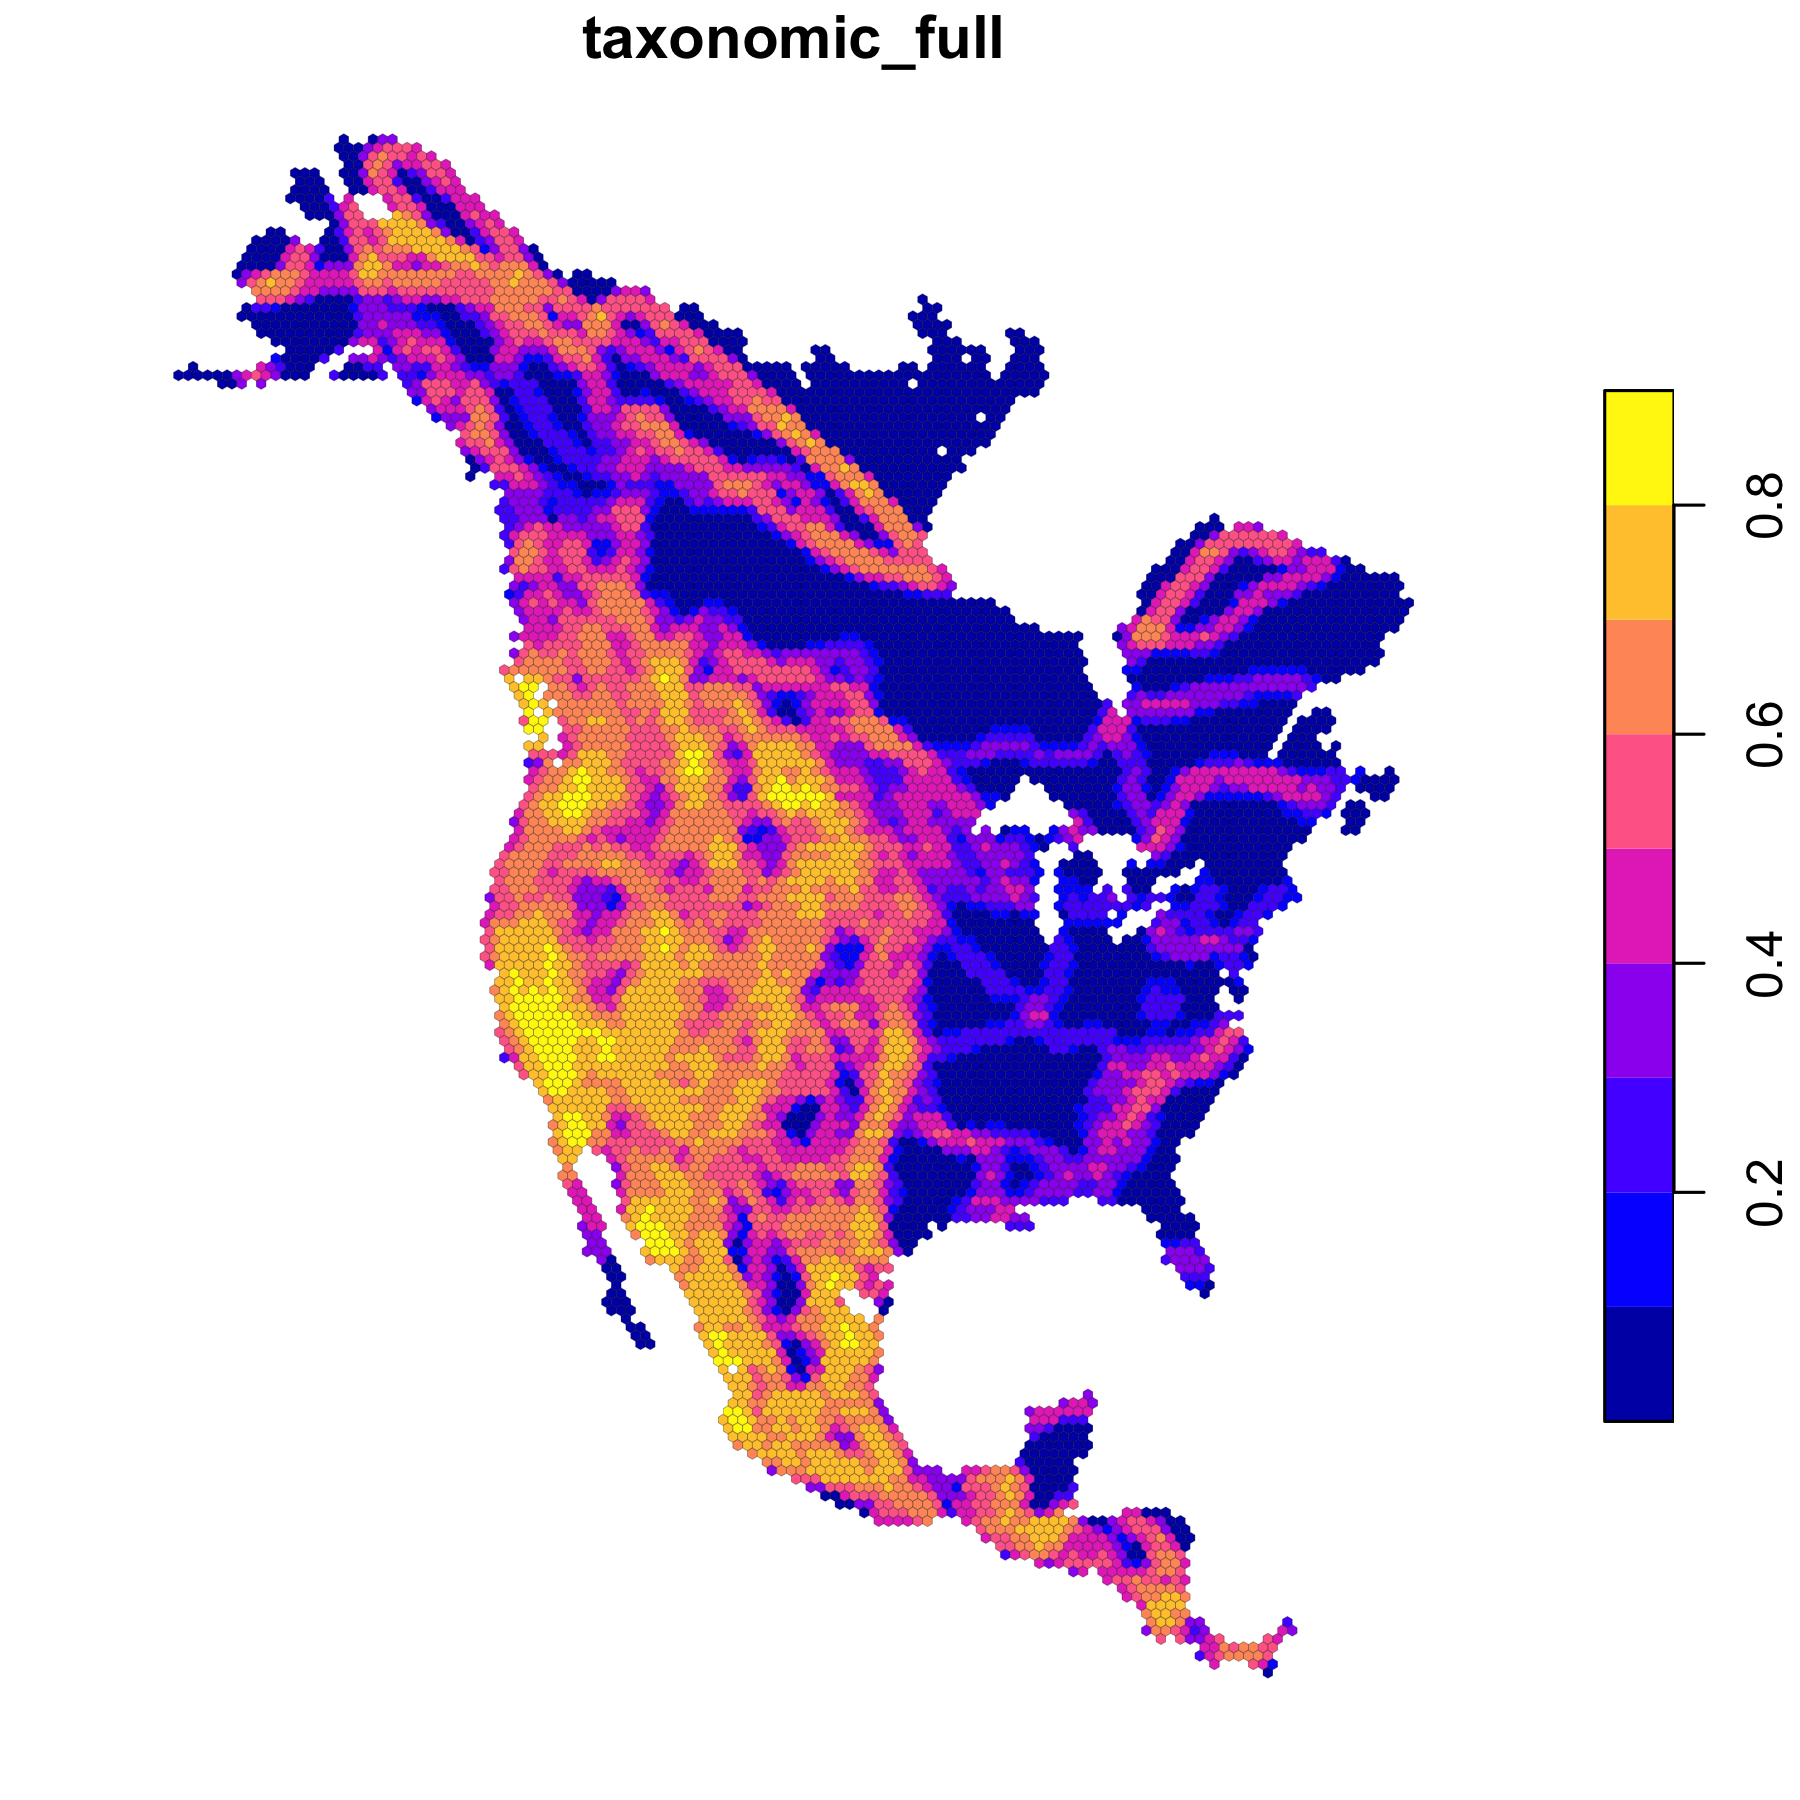
For instance, let's calculate taxonomic turnover for North American squirrels
xx <- betadiv_taxonomic(squirrelEPM, radius = 100000)
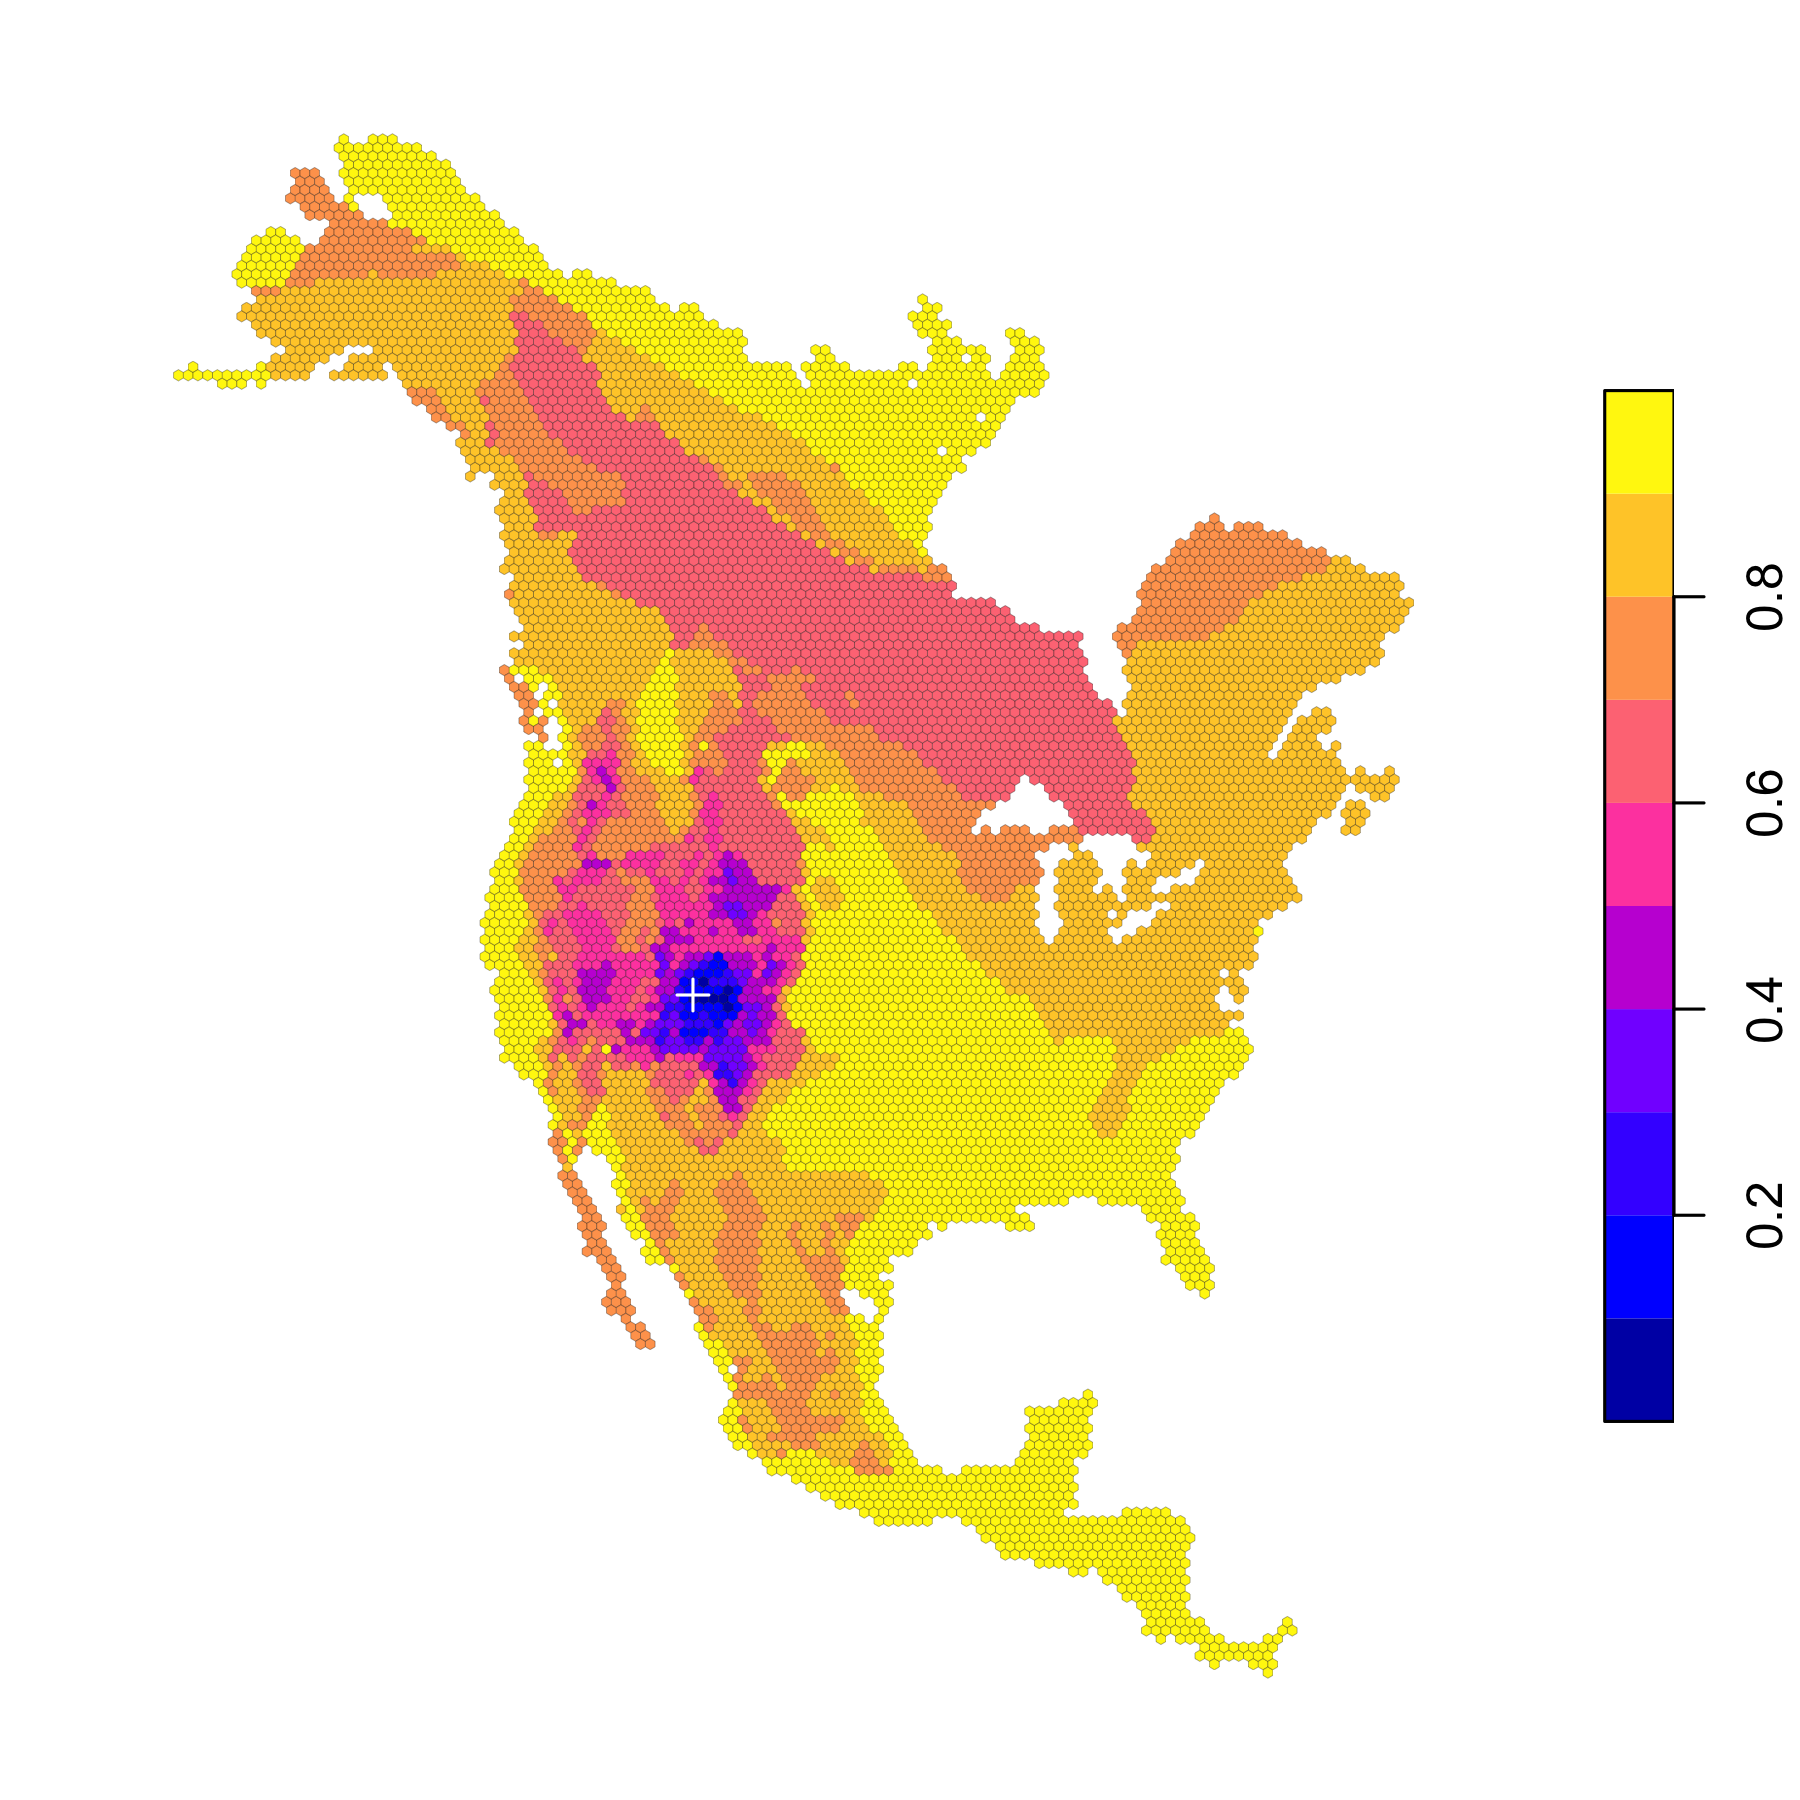
You can also calculate dissimilarity in taxonomic or phylogenetic diversity from some focal location to all other grid cells.
For instance, let's pick a location and provide it as a set of focal coordinates:
pt <- data.frame(matrix(c(-110, 39), nrow = 1))
pt <- st_as_sf(pt, coords = 1:2, crs = 4326)

# convert to our coordinate system
pt <- st_transform(pt, attributes(squirrelEPM)$crs)

xx <- betadiv_taxonomic(squirrelEPM, radius = 100000, focalCoord = pt)