Fix line and legend gallery compatibility [mpl compatibility]#248
Fix line and legend gallery compatibility [mpl compatibility]#248sselvakumaran wants to merge 10 commits into
Conversation


Merging this PR will degrade performance by 26.07%
|
| Benchmark | BASE |
HEAD |
Efficiency | |
|---|---|---|---|---|
| ❌ | test_select_lasso_message_1m |
89.3 ms | 120.8 ms | -26.07% |
Tip
Investigate this regression by commenting @codspeedbot fix this regression on this PR, or directly use the CodSpeed MCP with your agent.
Comparing agent/line-legend-gallery-compat (cf7cae4) with main (9b08085)

Footnotes
-
1 benchmark was skipped, so the baseline result was used instead. If it was deleted from the codebase, click here and archive it to remove it from the performance reports. ↩

|
for the horizontal barchart the xy one is severely cut off - only ‘estion 1’ is visible of ‘question 1’ for the y axis. as well, the borders on the top and bottom of the chart is not visible probably also due to this cutoff. the legend seems fine but it does not include the border it has (is this intentional or style? if a style choice then keep it but if it was asked for in the test then add it). also the items in the legend seem too far apart (is this a problem with 2x scale?) |
 sselvakumaran
changed the title
sselvakumaran
changed the title


|
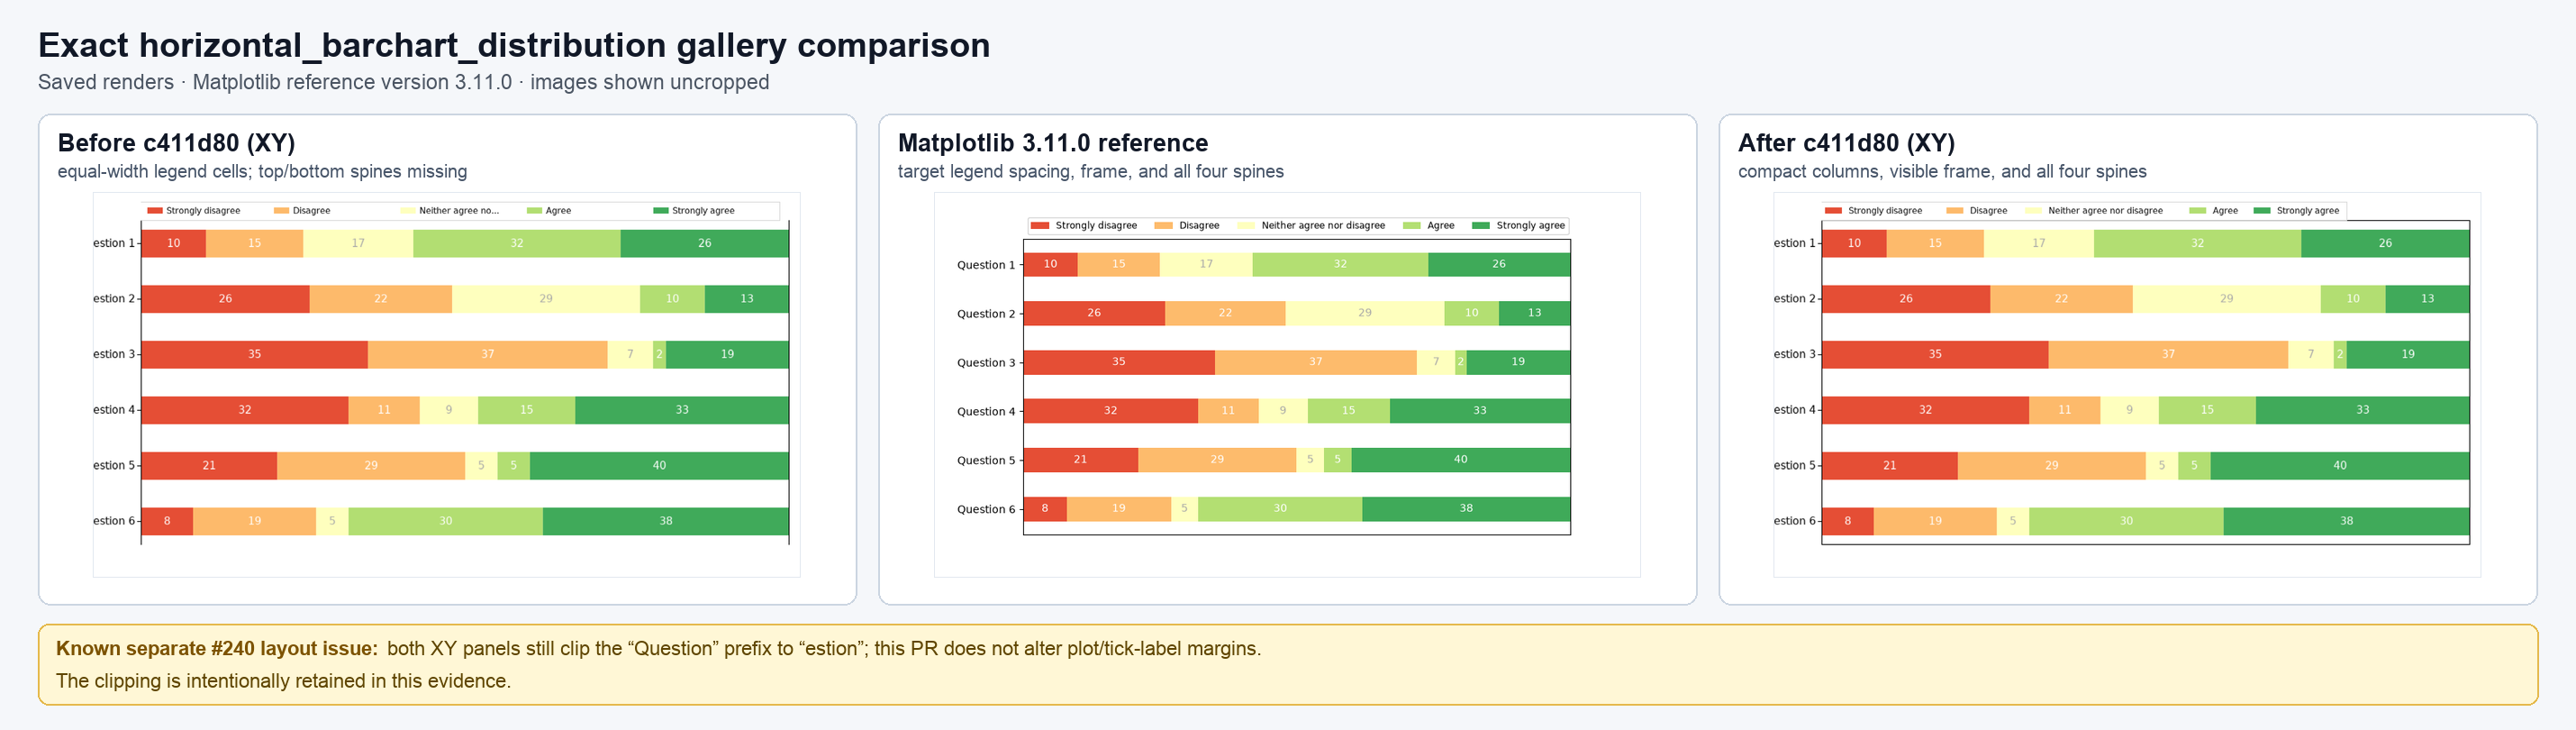
I reproduced the issues in the exact Matplotlib 3.11
The three panels are saved, uncropped renders. Both XY panels intentionally retain the clipped What changed:
The 2x export is not what caused the large spaces: those were equal-width legend cells. The new exact rerender has a visible legend frame and all four axes spines. Focused verification: 62 tests pass, Ruff passes, client typecheck/build passes, and the full 88-example gallery rerender completes with this example paired. I also tested the published #240 head ( |
|
Post-
No additional non-#240 code fix was warranted, so the PR remains clean at |

|
Important Review skippedDraft detected. Please check the settings in the CodeRabbit UI or the ⚙️ Run configurationConfiguration used: defaults Review profile: CHILL Plan: Pro Plus Run ID: You can disable this status message by setting the Use the checkbox below for a quick retry:
✨ Finishing Touches🧪 Generate unit tests (beta)
Comment |
The legend surface gained a public anchor option (2- or 4-value normalized
plot-rectangle geometry, the composition-API spelling of Matplotlib
bbox_to_anchor), and an anchored legend is exempt from the clip-to-plot-rect
that bounds static legends. Record both in spec/api/styling.md: the accepted
shapes, the y-up axes-fraction convention, how loc selects the pinned point,
the dropped containment clamp, and the narrowed static-export guarantee
including the per-legend/per-frame divergence between the SVG and native
raster backends.
The public legend(anchor=) option exempts an anchored legend from the
plot-rectangle clip that bounds static legends, so it can sit outside the
axes. _svg.py scopes that exemption per legend: each legend group keeps or
drops its own clip-path from its own options. The native rasterizer scoped
it per frame instead, computing one flag over the main legend and every
extra and gating the whole clip pass on it, so a single anchored legend
un-clipped every other legend in the figure.

Switch the raster pass to decide per legend. The clip is a stateful
command, so the rectangle is swapped only on a transition: an all-anchored
or all-bounded figure emits exactly the stream it did before, while a mixed
figure now clips its bounded legends and exempts only the anchored ones.

The browser needs no equivalent change -- each legend box is already its
own overflow-auto scroll container sized by --xy-legend-max-width/-height,
so the constraint is per element there rather than per frame.
The legend frame was sized from `len(label) * _LEGEND_CHAR_WIDTH`, a flat
per-character average. That cannot bound a proportional face: DejaVu's `m`
is over three times the width of its `l`, so "gamma" sets 42.6 px at the
11 px legend font against a 31.0 px estimate. Sizing each column to its own
labels removed the slack that had been hiding the error, and the 1 px border
then landed 7.6 px inside its own labels -- "alpha" and "gamma" visibly
crossed it.

Measure instead, using the advances the native rasterizer already blits.
`scripts/gen_font.py` now emits `python/xy/_fontmetrics.py` beside
`src/font.rs`, so the two tables cannot drift. Labels and the title are
ellipsized against the same measured budget, so a truncated string also fits
the column it was sized for. This is what the browser already does natively,
sizing each legend column to `max-content`, so all three renderers agree.

Measured for entries alpha/beta/gamma at 640x480 -- the widest label's right
edge relative to the frame's, where negative means the label overruns:

    merge-base   +8.375
    before       -7.625
    after        +4.000

Matplotlib insets the widest label from its frame by borderpad, +5.56 px on
the equivalent figure, so the sign and scale now agree.

Measuring the title's real extent also settles the titled-legend truncation
this branch had made worse: "Classes" over short entries rendered "Cla..." at
the merge-base and regressed to "Cl...", and now renders "Clas...". The
remaining budget bug -- the box grows by one border pad but the title is
ellipsized against two -- is deliberately left alone; it belongs to the
font-relative legend metrics stacked on top of this branch.

Also close the raster frame rectangle. `_rect_pts` is four corners, and
stroking it as an open polyline painted top/right/bottom while silently
dropping the left edge. Matplotlib's frame is a FancyBboxPatch with all four
sides, as are SVG's `<rect>` and the browser's CSS border.
1 participant

What changed
drawstyle="steps"as Matplotlib'ssteps-prealiasbbox_to_anchorgeometry across browser, SVG, and native PNGLegend, supportAxes.add_artist(), and render multiple explicit legend boxesPathCollection.legend_elements()for color and size handlesWhy
These were chained blockers in three official Matplotlib 3.11 line/marker gallery examples. Visual QA also caught two silent fidelity bugs after the scripts began exiting: native PNG dropped scatter alpha, and legend frames/styles were not actually applied.
Official references:
Gallery impact
horizontal_barchart_distribution.py: newly complete, 1/1 outputscatter_with_legend.py: newly complete, 3/3 outputsstep_demo.py: newly complete, 2/2 outputsline_demo_dash_control.pyadvances past round dash caps, then reaches the independentgapcolorblocker;legend(handlelength=4)is also still unsupportedThe survey's remaining left tick-label clipping is the margin work owned by #240. This PR deliberately does not change global margins/tick spacing.
Validation
543 passed, 65 skippedacross the full pyplot suite