Open Energy Dashboard (OED)
-
Updated
Jun 21, 2024 - JavaScript
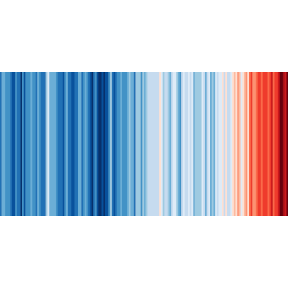
Global climate change refers to the rise of earth's temperature, caused by human factors. It originates from the greenhouse effect of certain gases in our atmosphere like carbon dioxide (CO2) or methane (CH4) that block the escaping heat. The concentration of these gases has risen dramatically by human impact since the mid of the 20th century, with the burning of fossil fuels (oil and gas) and deforestation being main causes of this rise. The observed and expected effects include more and longer periods of draught, wildfires and an increased number of extreme weather events.
Open Energy Dashboard (OED)
The front end of the treetracker web map app.
"What can I do about the climate crisis?" Here are 326 things you can do.
Open Source Fellow Sandbox
The Greenstand Wallet App
🔥 Global warming information and data
Resource Watch features hundreds of data sets all in one place on the state of the planet’s resources and citizens. Users can visualize challenges facing people and the planet, from climate change to poverty, water risk to state instability, air pollution to human migration, and more.
Help us build the most accessible and accurate climate tech resource on the planet 📓 🌍
Progressive Web Application that displays extracted data from the official web https://dadescovid.cat
Learn how you can help prevent earth’s climate breaking down.
Plant-for-the-Planet App allows you to plant trees with over 100 reforestation projects around the world.
An embeddable map that shows climate change projections. How hot will it be by 2070 if we don't do something about it? Accessible at https://climatechange.codeforafrica.org
Application and data for analyzing and structuring portfolios for climate investing.
Good Here helps you discover social impact startups, connect with the social impact community, and find social impact funding.
View resource consumption trends, history, analysis, and insights.
A CO2 budget countdown. Adapted to Extinction Rebellion styling.
Javascript tools to extract NASA-NEC GDDP Climate change daily data in CMIP5 Phase from 21 General Circulation Models (GCM`s). Available daily precipitation, maximum and minimum °T.
low-web extension, reduces data and carbon footprint of your internet browsing.
Helsinki Climate Watch - Climate strategy monitoring UI
🌎🏭📈 Data about the climate crisis, in your new tab. Get the extension for Firefox or Chrome today!
Created by Humanity