Measurements & Quantification
A lot of measurement implemented in Small Fish comes from the bigfish package (published work) for additional informations refer to the github page of the bigfish package.
-
Quantification
a. Levels of quantifications
b. Field of view level
c. Cell level
d. Single molecule level
e. Co-localization level -
Measurements
a. Measurements explanations
b. How to get the measurement you are looking for
In this section is explained how quantification is performed and in particular the different behaviours of the software when given cell segmentation or not.
In Small Fish quantification is organised on different levels :
- Field of view (fov level)
- Cellular level (cell level)
- Single molecule level (spot level)
- Co-localization level
Each of this level can results in one (or two for co-localization) data file containing a different scale of information. As an example the field of view data file will contain one line of measurements for every field of view that were processed whereas the cell data file will contain one line of measurements for every cell that were computed. It is then possible to link cells to their belonging field of view using unique identifiers, in this case named 'acquisition_id'.
Let's say we have computed 20 cells in our field of. In the fov datafile they will be 1 line reading acquisition_id = 1 but in the cell data file we will find 20 lines all reading acquisition_id = 1 but with a different cell_id.
The field of view level is mandatory it contains a variety of measurements that were taken on the fov as a whole such as total spot number, mean intensity as well as all the parameters given to the software for quantification. At this level one line of measurement represents one image stack the quantification is saved in filename with unique identifier acquisition_id.
It is important to understand that all measurements present in this level are never impacted by the segmentation given to the software and thus can be performed without segmentation at all. That is to say that the total spot number will give you the number of spot detected in the field of view independently of the fact they are found within segmentation masks or not.
Field of view level can generally be used for quantification of rna abundency, single molecule signal intensity, signal to noise ratio or to check what parameters were used.
The cell level is optional and requires cell segmentation to be performed it contains measurements on cells as individuals such as cell size, single molecule number inside nucleus, single molecule number inside foci... At this level one line of measurement represents one cell and the quantification is saved in filename_cell_result.
If you are not familiar with segmentation labels they consist in re-asignining an integer value to each pixel. Pixels with value 0 are considered background and pixels forming a cell are assigned a value superior to 0. By assigning a different pixel values to different cells we are able to distinguish one cell from another, this integer value is usually call label but it Small Fish it is called cell_id. Therefore it is important to remember that cell id is only unique within the same field of view meaning that the couple (acquisition_id, cell_id) is unique. This behavior is intended to allow matching cells during co-localization measurement.
Cell level quantification is the biggest part of Small Fish and and offer a large variety of measurements allowing user to quantify :
- nuclear single molecule abundancy
- cytoplasm single molecule abundancy
- spatial distribution of cytoplasmic spot respect to nuclei, membrane, protrusion...
- cell and nuclei size
- signal to noise ratio
- statics on signal in nuclei/cell
- single molecule polarization (PI)
- single molecule dispertion (DI)
- single molecule peripheral distribution (PDI)
- foci quantification
For cells the quantification is restrained to segmentation masks meaning that all spots, all clusters found outside of masks will be ignored and not refleted in cell measurements. Cell processing is handled by bigfish package it consists in extracting information from each cells individually using label segmentation label to that end cell are individually cropped from main image along with their nucleus and cytoplasm mask allowing ligther data processing during measurements computation. Used cropping is saved for each cell with name 'cell_bbox'.
The spot level is optional and does not require cell segmentation it is computed when the user enables the spot extraction option during detection and gives a valid path for saving. It considered single molecules as individuals and measure for each of them their intensity as well to which cluster it belongs, to which cell it belongs and if it is a nuclear spot. Contrary to other data files the spot data file is saved during quantification as it allows the software to not keep in memory information on intensities of each spots of each field of view computed.
This data file can become much more heavy since it contains one line per spot detected, it is saved as filename_spot_extraction with unique identifier spot_id.
Co-localization with Small Fish allows the user to quantifiy spatial proximity between two population of spots detected in seperate acquisitions. As an example if I want to quantify my multichannel image stack containing two different fluroescent reporters in two distinct channels I can start by segmenting cells followed with two round of detection (1 per channel) resulting in two acquisitions. Co-localization measurement will then enable me to quantify, cell by cell, the number, or fraction of single molecule from channel 1 co-localizing with channel 2.
Any time co-localization is tested the measurement of co-localization is taken both ways since testing the co-localization of a population of single molecule A with another population B is different than testing the population B with A (see illustration bellow).

To perform co-localization you can either perform at least 2 detections or load spot extraction. In the case when both selected acquisitions have cell level quantification (i.e cells were segmented) a cell to cell co-localization is performed otherwise a global co-localization is performed.
Global co-localization is achieved when at least one tested acquisition was not computed on cell level this will restrain the quantification to yield only one co-colocalization measurement per couple of acquisition tested. While this can still give you hints or ideas about the behaviour of your system a cell to cell quantification will be statiscally relevant as it will give a better signification to your mean and standard deviation values.
When saving results an additional data file will be created namely global_coloc_result containing measurements, acquisitions names and ids as well as the colocalisation distance used (see Co-localization section).
Cell to cell co-localization comes with a heavier data density which makes it a bit less comfortable to handle. First let's explain how cells are matched in the case of computing cell to cell co-localization with acquisition1 and acquisition2. Cells from acquisition1 and acquisition2 are matched using their cell_id which corresponds to the value of the segmentation label in the cell. Therefore it is important to understand the software will not check if you are performing the co-localization test between two acquisitions segmented identically. Needless to say if you perform co-localization measurement in different field of views or with different segmentation the measurements will be falsed.
When cell to cell co-localization is computed an additional data file named cell2cell_coloc_result is created containing one line of measurements for each cell. **These cells can be linked to cell data file using cell_id and the acquisition_id to link to cell level quantification. This data frame contains also the the colocalisation distance used (see Co-localization section).
Note : Data might be more comfortable to handle with one file per field of fiew in this case. To achieve this save results after testing all co-localization of interest for your fov and then click the reset button before moving on to next fov.
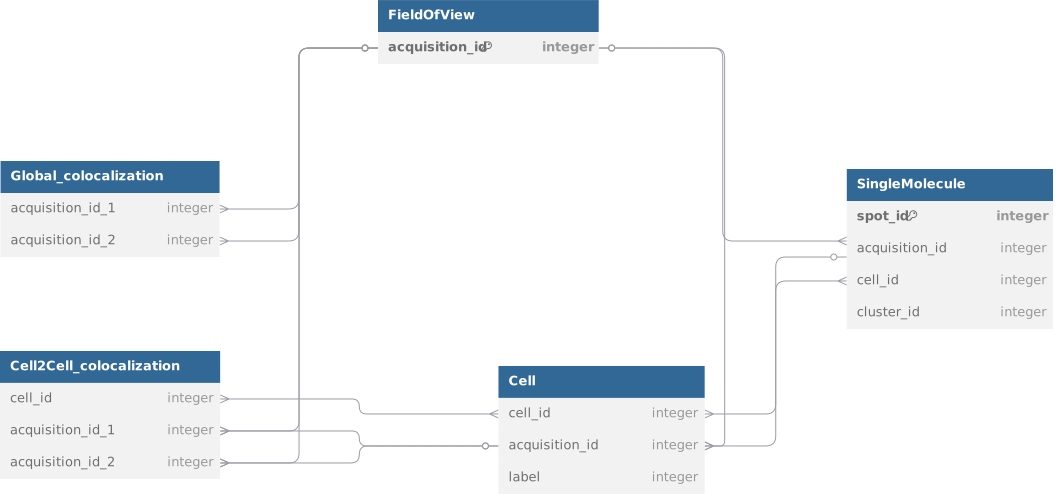
In this section you can find a graphical representation of the Small Fish database summing up identifiers across all levels.
Signal to noise measurement is performed using the metric from the fish-quant environnement. It aims at assessing the quality of specific signal confronted to background and is computed using the following formula :
For snr computation and general quantification (i.e quantification without cell segmentation), is considered as cell background signal, signal which is find in a region twice as large as the spot radius around detected spots without including signal from spot (understand signal in spot radius).
Measures including index distance such as index distance centrosome are normalised with the distance that would be expected if rna were uniformly distributed. In the case of centrosomal distance it means that the mean centrosomal distance is computed for the detected distribution and then divided by the mean of distance of each pixels in the cell.
Those 3 indexes are presented in Stueland M, Wang T, Park HY, Mili S. RDI Calculator: An Analysis Tool to Assess RNA Distributions in Cells. Sci Rep. 2019 Jun 4;9(1):8267. doi: 10.1038/s41598-019-44783-2. PMID: 31164708; PMCID: PMC6547641.
I chose to directly quote the paper for this description.
"The Polarization Index (PI) is calculated by identifying the centroid of the RNA signal and measuring its displacement from the centroid of the cell. This displacement is divided by the radius of gyration, calculated as the root-mean-square distance of all pixels to the centroid of the cell, in order to normalize the polarization to the size and elongation of the cell."
"where
"To derive the Dispersion Index (DI), the second moment of RNA pixel intensity positions relative to the centroid of the total RNA signal is calculated."
"where
The Peripheral Distribution Index (PDI) is calculated similar to the dispersion index, but in this case the second moment of RNA pixel intensity positions is calculated relative to the centroid of the nucleus14. This metric is not affected by the polarization of the RNA distribution. PDI value is 1 for a completely diffuse RNA, it is less than 1 for a perinuclear RNA and more than 1 for a peripherally distributed RNA
In this section you will find a summup of all measurements availables. Measurement in bold are detailed in section above.
See quantification section
| Measure | Explanation | Requires segmentation | Requires clustering | Type |
|---|---|---|---|---|
| acquisition_id | Unique identifier for field of views | No | No | Identifier |
| name | User given label for field of view | No | No | Parameter |
| spot_number | Total number of spot detected | No | No | Measure |
| spotsSignal_median | Median signal of single molecule | No | No | Measure |
| spotsSignal_mean | Mean signal of single molecule | No | No | Measure |
| spotsSignal_std | Standard deviation of single molecule signal | No | No | Measure |
| median_pixel | Median signal in fov | No | No | Measure |
| mean_pixel | Mean pixel in fov | No | No | Measure |
| snr_median | Median signal to noise ratio | No | No | Measure |
| snr_mean | Mean signal to noise | No | No | Measure |
| snr_std | Standard deviation of signal to noise | No | No | Measure |
| cell_medianbackground_std | Median value of signal in cells away from spots | No | No | Measure |
| cell_meanbackground_mean | Mean value of signal in cells away from spots | No | No | Measure |
| cell_meanbackground_std | No | No | Measure | |
| cell_stdbackground_mean | No | No | Measure | |
| cell_stdbackground_std | No | No | Measure | |
| cluster_number | Number of cluster detected | No | Yes | Measure |
| total_spots_in_clusters | Number of spots detected in clusters | No | No | Measure |
| cell_number | Number of cell detected | Yes | No | Measure |
| segmentation_done | Wheter segmentation was performed or not | No | No | Parameter |
| cyto_model_name | Name of cellpose model used for cytoplasm segmentation | Yes | No | Parameter |
| cytoplasm channel | Channel used for cytoplasm segmentation | Yes | No | Parameter |
| cytoplasm diameter | Object size in pixel given to cellpose for cytoplasm segmentation | Yes | No | Parameter |
| nucleus_model_name | Name of cellpose model used for nuclei segmentation | Yes | No | Parameter |
| nucleus channel | Channel used for nuclei segmentation | Yes | No | Parameter |
| other_nucleus_image | filename of nucleus image in case user is using a second image to perform segmentation | Yes | No | Parameter |
| nucleus diameter | Object size in pixel given to cellpose for cytoplasm segmentation | Yes | No | Parameter |
| Segment only nuclei | True/False parameter enabling user to ignore cytoplasm segmentation | Yes | No | Parameter |
| show segmentation | True/False parameter enabling user to use napari to visualize and edit segmentation | Yes | No | Parameter |
| saving path filename | full path to saved fodler where segmentation visuals were saved. | Yes | No | Parameter |
| image path | Full path to loaded image | No | No | Parameter |
| is_3D_stack | True if loaded image was considered a 3D stack | No | No | Parameter |
| is_multichannel | True if loaded image was considered a multi-channel stack | No | No | Parameter |
| do_dense_regions_deconvolution | True if user tried to perform dense region deconvolutions | No | No | Parameter |
| do_cluster_computation | True if user tried to perform cluster computation | No | No | Parameter |
| show_napari_corrector | True/False parameter enabling user to use napari to visualize and edit detection | No | No | Parameter |
| shape | Loaded image shape | No | No | Parameter |
| dim | Loaded image dimension | No | No | Parameter |
| reordered_shape | Shape of image after axis re-ordering | No | No | Parameter |
| threshold | Threshold value used for single molecule detection | No | No | Parameter |
| threshold penalty | Multiplicative factor applied to automatic threshold | No | No | Parameter |
| channel_to_compute | Channel on which was performed detection | No | No | Parameter |
| voxel_size_z | Size of a pixel in nanometer | No | No | Parameter |
| voxel_size_y | Size of a pixel in nanometer | No | No | Parameter |
| voxel_size_x | Size of a pixel in nanometer | No | No | Parameter |
| spot_size_z | Expected single molecule size | No | No | Parameter |
| spot_size_y | Expected single molecule size | No | No | Parameter |
| spot_size_x | Expected single molecule size | No | No | Parameter |
| log_kernel_size_z | Size of Laplacian of Gaussian filter in pixel, optional, will be computed from spot size if not given | No | No | Parameter |
| log_kernel_size_y | Size of Laplacian of Gaussian filter in pixel, optional, will be computed from spot size if not given | No | No | Parameter |
| log_kernel_size_x | Size of Laplacian of Gaussian filter in pixel, optional, will be computed from spot size if not given | No | No | Parameter |
| minimum_distance_z | Minimum distance between detected spots, optional, will be computed from spot size if not given | No | No | Parameter |
| minimum_distance_y | Minimum distance between detected spots, optional, will be computed from spot size if not given | No | No | Parameter |
| minimum_distance_x | Minimum distance between detected spots, optional, will be computed from spot size if not given | No | No | Parameter |
| alpha | Dense region deconvolution parameter, distribution percentile for reference spot building | No | No | Parameter |
| beta | Dense region deconvolution parameter, multiplicative factor applied to distribution median for bright pixel thresholding | No | No | Parameter |
| gamma | Dense region deconvolution parameter | No | No | Parameter |
| deconvolution_kernel_z | Dense region deconvolution parameter, optional, used to specify kernel size (nanometers) for gaussian blur pre-processing | No | No | Parameter |
| deconvolution_kernel_y | Dense region deconvolution parameter, optional, used to specify kernel size (nanometers) for gaussian blur pre-processing | No | No | Parameter |
| deconvolution_kernel_x | Dense region deconvolution parameter, optional, used to specify kernel size (nanometers) for gaussian blur pre-processing | No | No | Parameter |
| cluster size | Expected size of clusters in nanometer, parameter used by DBSCAN algorithm to find core points | No | No | Parameter |
| min number of spots | Minimum number of spots for single molecules to form a cluster, parameter used by DBSCAN algorithm | No | No | Parameter |
| nucleus channel signal | Channel given for nucleus releated feature | Yes | No | Parameter |
| show_interactive_threshold_selector | True/False parameter enabling interactive napari visualization of threshold during detection | No | No | Parameter |
| spots_extraction_folder | if fullpath is provided spots quantification will be extracted to this location | No | No | Parameter |
| spots_filename | if provided spots quantification result filename | No | No | Parameter |
| do_spots_csv | True/False parameter indicating if spots quantification was saved to csv format | No | No | Parameter |
| do_spots_excel | True/False parameter indicating if spots quantification was saved to csv excel | No | No | Parameter |
| do_spots_feather | Will be removed in future version | No | No | Parameter |
| voxel_size | Size of a pixel in nanomter | No | No | Parameter |
| spot_size | Expected single molecule size | No | No | Parameter |
| log_kernel_size | Size of Laplacian of Gaussian filter in pixel, optional, will be computed from spot size if not given | No | No | Parameter |
| minimum_distance | Minimum distance between detected spots, optional, will be computed from spot size if not given | No | No | Parameter |
| deconvolution_kernel | Dense region deconvolution parameter, optional, used to specify kernel size (nanometers) for gaussian blur pre-processing | No | No | Parameter |
See quantification section
| Measure | Explanation | Requires segmentation | Requires clustering | Type |
|---|---|---|---|---|
| acquisition_id | Identifier for reference to field of view quantification | Yes | No | Identifier |
| name | User given label for field of view | Yes | No | Parameter |
| cell_id | Cell identifier not unique amongst different filed of views. Corresponds to the value of this cell's pixel in segmentation label | Yes | No | Identifier |
| cell_bbox | coordinates of cell bounding boxe | Yes | No | Measure |
| index_mean_distance_cell | Normalised mean value of distance between detected spots and cell membrane | Yes | No | Measure |
| index_median_distance_cell | Normalised median value of distance between detected spots and cell membrane | Yes | No | Measure |
| index_mean_distance_nuc | Normalised mean value of distance between detected spots and nucleus | Yes | No | Measure |
| index_median_distance_nuc | Normalised median value of distance between detected spots and nucleus | Yes | No | Measure |
| proportion_rna_in_nuc | Fraction of detected spots found within nucleus | Yes | No | Measure |
| nb_rna_out_nuc | Number of spots found outside nucleus mask | Yes | No | Measure |
| nb_rna_in_nuc | Number of spots found inside nucleus mask | Yes | No | Measure |
| index_polarization | Yes | No | Measure | |
| index_dispersion | Yes | No | Measure | |
| index_peripheral_distribution | Yes | No | Measure | |
| index_rna_nuc_edge | Normalised number of spots detected closter than 500 nanometers from nucleus | Yes | No | Measure |
| index_rna_nuc_radius_500_1000 | Normalised number of spots detected in region spaning from 500 nanometers to 1000 nanometers from nucleus | Yes | No | Measure |
| index_rna_nuc_radius_1000_1500 | Normalised number of spots detected in region spaning 1000 nanometers to 1500 nanometers from nucleus | Yes | No | Measure |
| index_rna_nuc_radius_1500_2000 | Normalised number of spots detected in region spaning 1500 nanometers to 2000 nanometers from nucleus | Yes | No | Measure |
| index_rna_nuc_radius_2000_2500 | Normalised number of spots detected in region spaning 2000 nanometers to 2500 nanometers from nucleus | Yes | No | Measure |
| index_rna_nuc_radius_2500_3000 | Normalised number of spots detected in region spaning 2500 nanometers to 3000 nanometers from nucleus | Yes | No | Measure |
| index_rna_cell_radius_0_500 | Normalised number of spots detected closter than 500 nanometers from cell membrane | Yes | No | Measure |
| index_rna_cell_radius_500_1000 | Normalised number of spots detected in region spaning from 500 to 1000 nanometers from cell membrane | Yes | No | Measure |
| index_rna_cell_radius_1000_1500 | Normalised number of spots detected in region spaning from 1000 to 1500 nanometers from cell membrane | Yes | No | Measure |
| index_rna_cell_radius_1500_2000 | Normalised number of spots detected in region spaning from 1500 to 2000 nanometers from cell membrane | Yes | No | Measure |
| index_rna_cell_radius_2000_2500 | Normalised number of spots detected in region spaning from 2000 to 2500 nanometers from cell membrane | Yes | No | Measure |
| index_rna_cell_radius_2500_3000 | Normalised number of spots detected in region spaning from 2500 to 3000 nanometers from cell membrane | Yes | No | Measure |
| proportion_rna_nuc_edge | Proportion of spots detected closer than 500 nanometers from nucleus | Yes | No | Measure |
| proportion_rna_nuc_radius_500_1000 | Proportion of spot detected in region spaning from 500 nanometers to 1000 nanometers from nucleus | Yes | No | Measure |
| proportion_rna_nuc_radius_1000_1500 | Proportion of spot detected in region spaning from 1000 nanometers to 1500 nanometers from nucleus | Yes | No | Measure |
| proportion_rna_nuc_radius_1500_2000 | Proportion of spot detected in region spaning from 1500 nanometers to 2000 nanometers from nucleus | Yes | No | Measure |
| proportion_rna_nuc_radius_2000_2500 | Proportion of spot detected in region spaning from 2000 nanometers to 2500 nanometers from nucleus | Yes | No | Measure |
| proportion_rna_nuc_radius_2500_3000 | Proportion of spot detected in region spaning from 2500 nanometers to 3000 nanometers from nucleus | Yes | No | Measure |
| proportion_rna_cell_radius_0_500 | Proportion of spots detected closer than 500 nanometers from cell membrane | Yes | No | Measure |
| proportion_rna_cell_radius_500_1000 | Proportion of spot detected in region spaning from 500 nanometers to 1000 nanometers from cell membrane | Yes | No | Measure |
| proportion_rna_cell_radius_1000_1500 | Proportion of spot detected in region spaning from 1000 nanometers to 1500 nanometers from cell membrane | Yes | No | Measure |
| proportion_rna_cell_radius_1500_2000 | Proportion of spot detected in region spaning from 1500 nanometers to 2000 nanometers from cell membrane | Yes | No | Measure |
| proportion_rna_cell_radius_2000_2500 | Proportion of spot detected in region spaning from 2000 nanometers to 2500 nanometers from cell membrane | Yes | No | Measure |
| proportion_rna_cell_radius_2500_3000 | Proportion of spot detected in region spaning from 2500 nanometers to 3000 nanometers from cell membrane | Yes | No | Measure |
| proportion_rna_in_foci | Fraction of spots deteted in foci | Yes | No | Measure |
| proportion_nuc_area | Ratio of nucleus area on total cell area | Yes | No | Measure |
| cell_area | cell area in squared pixel | Yes | No | Measure |
| nuc_area | nucleus area in squared pixel | Yes | No | Measure |
| cell_area_out_nuc | cytoplasm area without nucleus in squared pixel | Yes | No | Measure |
| nucleus_mean_signal | mean signal in nucleus (from nucleus channel signal) | Yes | No | Measure |
| nucleus_median_signal | median signal in nucleus (from nucleus channel signal) | Yes | No | Measure |
| nucleus_max_signal | maximum signal in nucleus (from nucleus channel signal) | Yes | No | Measure |
| nucleus_min_signal | minimum signal in nucleus (from nucleus channel signal) | Yes | No | Measure |
| snr_mean | Yes | No | Measure | |
| snr_median | Yes | No | Measure | |
| snr_std | Yes | No | Measure | |
| cell_center_coord | Pixel coordinates of cell centroid | Yes | No | Measure |
| foci_number | Number of foci detected in cell | Yes | Yes | Measure |
| foci_in_nuc_number | Number of foci detected in nucleus | Yes | Yes | Measure |
| clustered_spot_number | Number of spot detected in clusters | Yes | Yes | Measure |
| free_spot_number | Number of spot detected outside of clusters | Yes | Yes | Measure |
| total_rna_number | Number of spot detected in cell | Yes | Yes | Measure |
See quantification section
| Measure | Explanation | Requires segmentation | Requires clustering | Type |
|---|---|---|---|---|
| acquisition_id | Identifier refering to field of view quantification | No | No | Identifier |
| spot_id | Unique indentifier for spots | No | No | Identifier |
| intensity | Intensity of detected spot | No | No | Measure |
| cell_label | Label of cell at spot location, this matches cell_id identifier from cell results table | Yes | No | Identifier |
| in_nucleus | Boolean value indicating if spot was detected inside nucleus | Yes | No | Measure |
| coordinates | Pixel coordinates of detected spot | No | No | Measure |
| cluster_id | Index indicating to which cluster the spots belongs. If -1 then spot is not in a cluster | No | Yes | Measure |
See quantification section
| Measure | Explanation | Requires segmentation | Requires clustering | Type |
|---|---|---|---|---|
| name1 | User given label to first acquisition of the co-localization pair | No | No | Parameter |
| name2 | User given label to second acquisition of the co-localization pair | No | No | Parameter |
| acquisition_id_1 | Identifier in field of view quantification of first acquisition from the tested pair | No | No | Indentifier |
| acquisition_id_2 | Identifier in field of view quantification of second acquisition from the tested pair | No | No | Identifier |
| colocalisation_distance | Maximum distance that can separate co-localizing spots | No | No | Parameter |
| spot1_total | Number of detected spots in first acquisition | No | No | Measure |
| spot2_total | Number of detected spots in second acquisition | No | No | Measure |
| fraction_spots1_coloc_spots2 | Fraction of spots from first acquisition co-localizing with at least one spot from second acquisition | No | No | Measure |
| fraction_spots2_coloc_spots1 | Fraction of spots from second acquisition co-localizing with at least one spot from first acquisition | No | No | Measure |
| fraction_spots2_coloc_cluster1 | Fraction of spots from second acquisition co-localizing with at least one clustered spot from first acquisition | No | Yes | Measure |
| fraction_spots1_coloc_cluster2 | Fraction of spots from first acquisition co-localizing with at least one clustered spot from second acquisition | No | Yes | Measure |
| fraction_cluster1_coloc_cluster2 | Fraction of clustered spots from first acquisition co-localizing with at least one clustered spot from second acquisition | No | Yes | Measure |
| fraction_cluster2_coloc_cluster1 | Fraction of clustered spots from second acquisition co-localizing with at least one clustered spot from first acquisition | No | Yes | Measure |
| fraction_spots1_coloc_free2 | Fraction of spots from first acquisition co-localizing with at least one free spot from second acquisition | No | Yes | Measure |
| fraction_spots2_coloc_free1 | Fraction of spots from second acquisition co-localizing with at least one free spot from first acquisition | No | Yes | Measure |
See quantification section
| Measure | Explanation | Requires segmentation | Requires clustering | Type |
|---|---|---|---|---|
| cell_id | Appear as index of frame (rows instead of columns). Value of cell label | No | No | Index |
| clustered_spot_number | No | No | Measure | |
| clustered_spots_with_clustered_spots_count | No | No | Measure | |
| clustered_spots_with_clustered_spots_fraction | No | No | Measure | |
| spots_with_clustered_spots_count | No | No | Measure | |
| spots_with_clustered_spots_fraction | No | No | Measure | |
| spots_with_spots_count | No | No | Measure | |
| spots_with_spots_fraction | No | No | Measure | |
| total_rna_number | No | No | Measure | |
| voxel_size | No | No | Measure | |
| pair_name | No | No | Measure | |
| acquisition_id_1 | No | No | Measure | |
| acquisition_id_2 | No | No | Measure | |
| colocalisation_distance | No | No | Measure |