Co‐localization
With small fish you can perform co-localization post quantification. To do so select two acquisitions in main menu (Ctrl + click) and click on Compute colocalization.
Numerous measurement of co-localization between two fluorescent channel use spatial correlation of intensities. In Small fish we take advantage of the dection on single molecules to count co-localization events as a mean of quantification allowing to quantify co-localization rates between mRNAs. A co-localization event is counted when two single molecules are found in the same pixel (i.e : same coordinates) however to allow for more flexibility in quantification a co-localization range can be defined. In this case a event is counted every time that a molecule is found at an euclidian distance inferior to co-localization range.
Note : Even with a segmentation performed in 2D, if detection was performed in 3D the euclidian distance used will be 3D.
Note that when counting co-localization events between a population of single molecule A with a population B you might not have the same count than when couting co-localization events of population B with population A (see illustration).
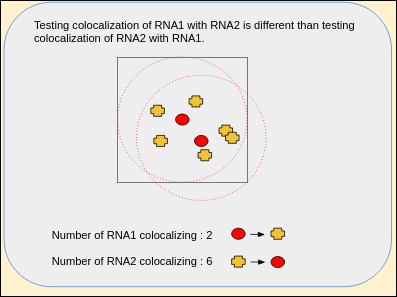
Finally, performing co-localization with small fish will add a new table when saving results which will depend of wether segmentation was performed or not.
When segmentation was not performed Small fish is not able to discriminate events between cell and a global count is returned. Furthermore, co-localization rate is computed as the number of co-localizing single molecules divided with the total number of single molecule which can yield very different results from computing co-localization rates per cell and looking at the mean of the resulting distribution. This is useful to have a glimpse at co-localization behaviour without bothering to do cell segmentation however for statiscally relevant arguments one should perform segmentation.
When segmentation was performed, co-localization events and rates will be computed cell wise allowing to use cells as statistical units.
Note : If co-localization was computed both with and without segmentation in one instance of Small fish, saving results will yield 2 tables.
All both directions (A->B and B->A) are tested for all combination between the two populations all spots and clustered spots this is a lot of information and the result table can get pretty messy. This sections presents an example to understand how to read the table and what the forward and backward indicators mean.
First, let us have a look at the first columns composing my cell2cell_coloc table for a co-localization test between Population A and Population B.

We can notice this quantification contains 5 cells (1 cell per line), for clarity purpose I renamed my acquisitions "Population A" and "Population B". This can be achieved using the rename function in the main menu. The first columns contain the parameters of your quantification as well as the total rna number indicating how many single molecules were detected in this cell which is used for co-localization fraction computation.
Then let us move on to the co-localization columns.

The first line indicates we are looking at co-localization of spots with spots (understand all spots with all spots), we can see the event count (number of single molecules finding a neighbour in other population) while the fraction columns divide this number with the total rna number. Now importantly notice the forward and backward columns, they indicate how the column name from first line should be read this will become important when looking at spots co-localizing with clustered_spots.

Here the first column indicate the number of cluster detected for population B this hints that following columns implicate clustered spots from population B and not from population A.
The column spots_with_clustered_spots - forward indicate co-localization from all spots of population A with clustered spots of population B. Whereas spots_with_clustered_spots - backward indicate co-localization from clustered spots of population B with all spots of population A. Understand that the forward indicator should make you read the column title from left to right, so spots_with_clustered_spots remains spots_with_clustered_spots. While the backward indicator should make you read the column title from right to left and in this case spots_with_clustered_spots should be understood clustered_spots B with spots A.
Co-localization of clustered spots A with spots B is found in the next columns.

In these columns, againg hinted by first column, clustered_spots always refers to population A. Finally, for the clustered spots against clustered spots columns the logic is similar to spots against spots.
