User interface
*Graphical interface is build on Napari package and FreeSimpleGUI
Small fish provides a basic but easy to use graphical interface, when launching the software the main menu will be prompted.
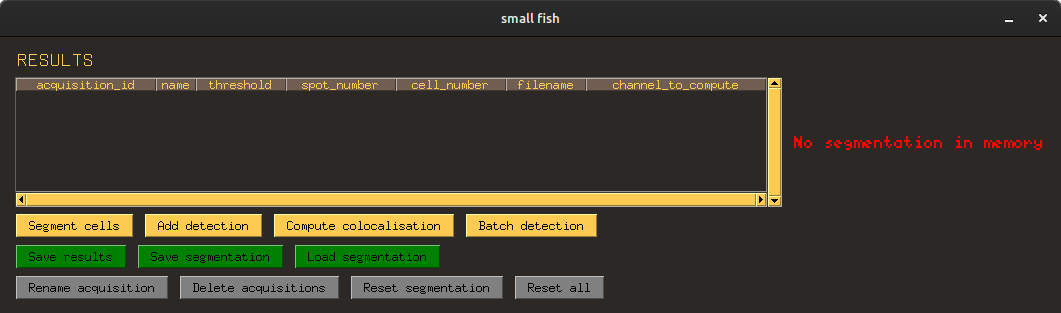
The results frame will give you a quick sumary of the quantifications you performed and let you know if a segmentation mask is already loaded in memory.
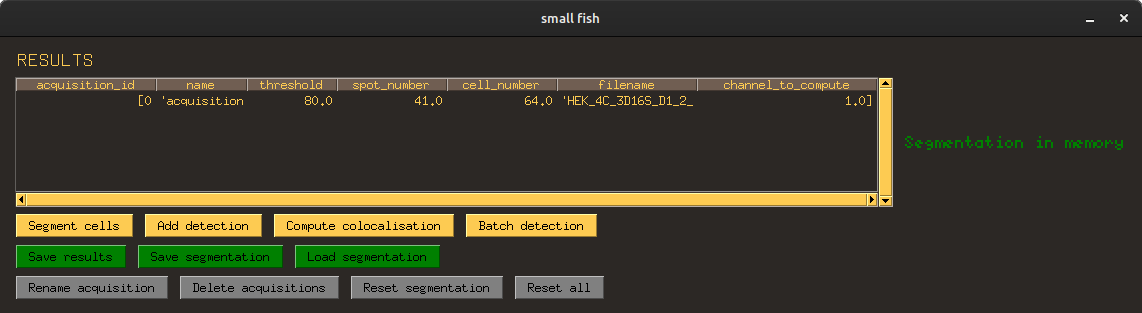
Here is quick overview of the button functionalities :
- Segment cells : Launch a new segmentation
- Add detection : Launch a new detection
- Compute colocalisation : Perform co-localization quantification with 2 selected acquisition (Ctrl+click in result frame to select)
- Batch detection : Open batch mode interface
- Save results : Select a folder and save results in csv or xlsx
- Save segmentation : save segmentation loaded in memory as npy or npz file
- Load segmentation : loads previously saved segmentation, see below to load segmentation masks from outside Small Fish
- Rename acquisition : Allow user to label an acquisition, useful to label data with cell treatment, cell line ...
- Delete acquisition : Delete selected acquisition in results (click or ctrl + click)
- Reset segmentation : Discard segmentation masks loaded in memory
- Reset all : Discard segmentation and all acquisitions
During segmentation or detection you will be asked to load an image to analyse, select the image you want to segment or quantify by clicking the browse button. Then tick the 3D stack and Multichannel stack accordingly to help the software understand the spatial information it should find.
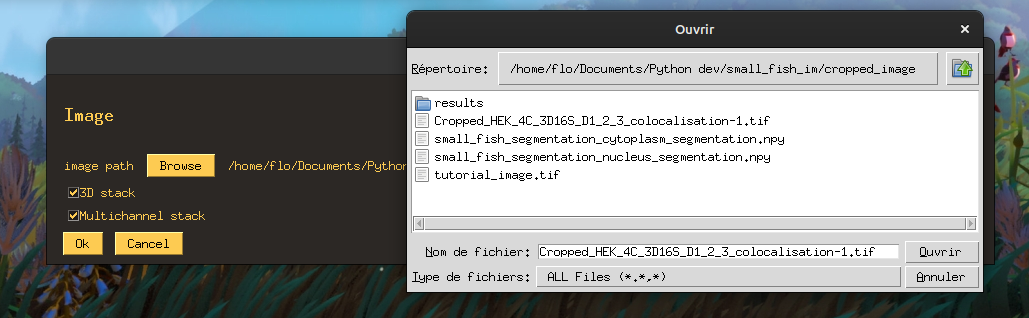
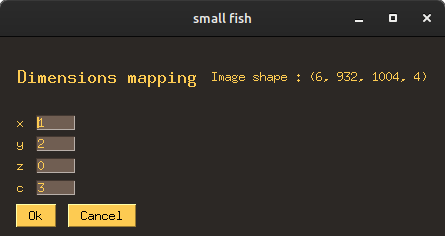
After clicking OK you will be prompted with a mapping menu. It promps the shape of your image in the order axis are stored into your image stack, they are numbered from 0 to the number of dimension of your image -1. e.g : For a monochannel 3D stack, 3 dimensions are expected (z, y, x) which will numbered from 0 to 2.
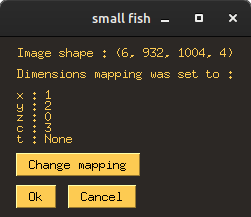
It should be auto mapped and it most likely doesn't need any change. However in cases where your z axis is larger than xy or your channel axis (c) is larger than other axis it will be incorrectly mapped. If so click the change mapping button and fill the axis order accordingly to the prompted shape.
is a python open source image viewer allowing user to interact with images in various manners. In SmallFish it is used as a mean to check or modify quantification (segmentation and detection).
Naparis comes with a 3D view which is very useful to evalute 3D detection on all z-slices in a glimpse. When enabling 3D view Napari will display a max projection of all z-slices, when left clicking user can modify the angle of visualisation allowing a proper 3D rendering. Altough, for spot quantification one can be used to evalute results based on MIPs, to do so you can simply enable the 3D mode and not change the angle of visualisation.
You can then use mouse wheel to zoom in or out of the picture, and to slide across the view you may press shift while using left click.
| 2D view | 3D view (maximum projection) (zoomed in) |
|---|---|
 |
 |
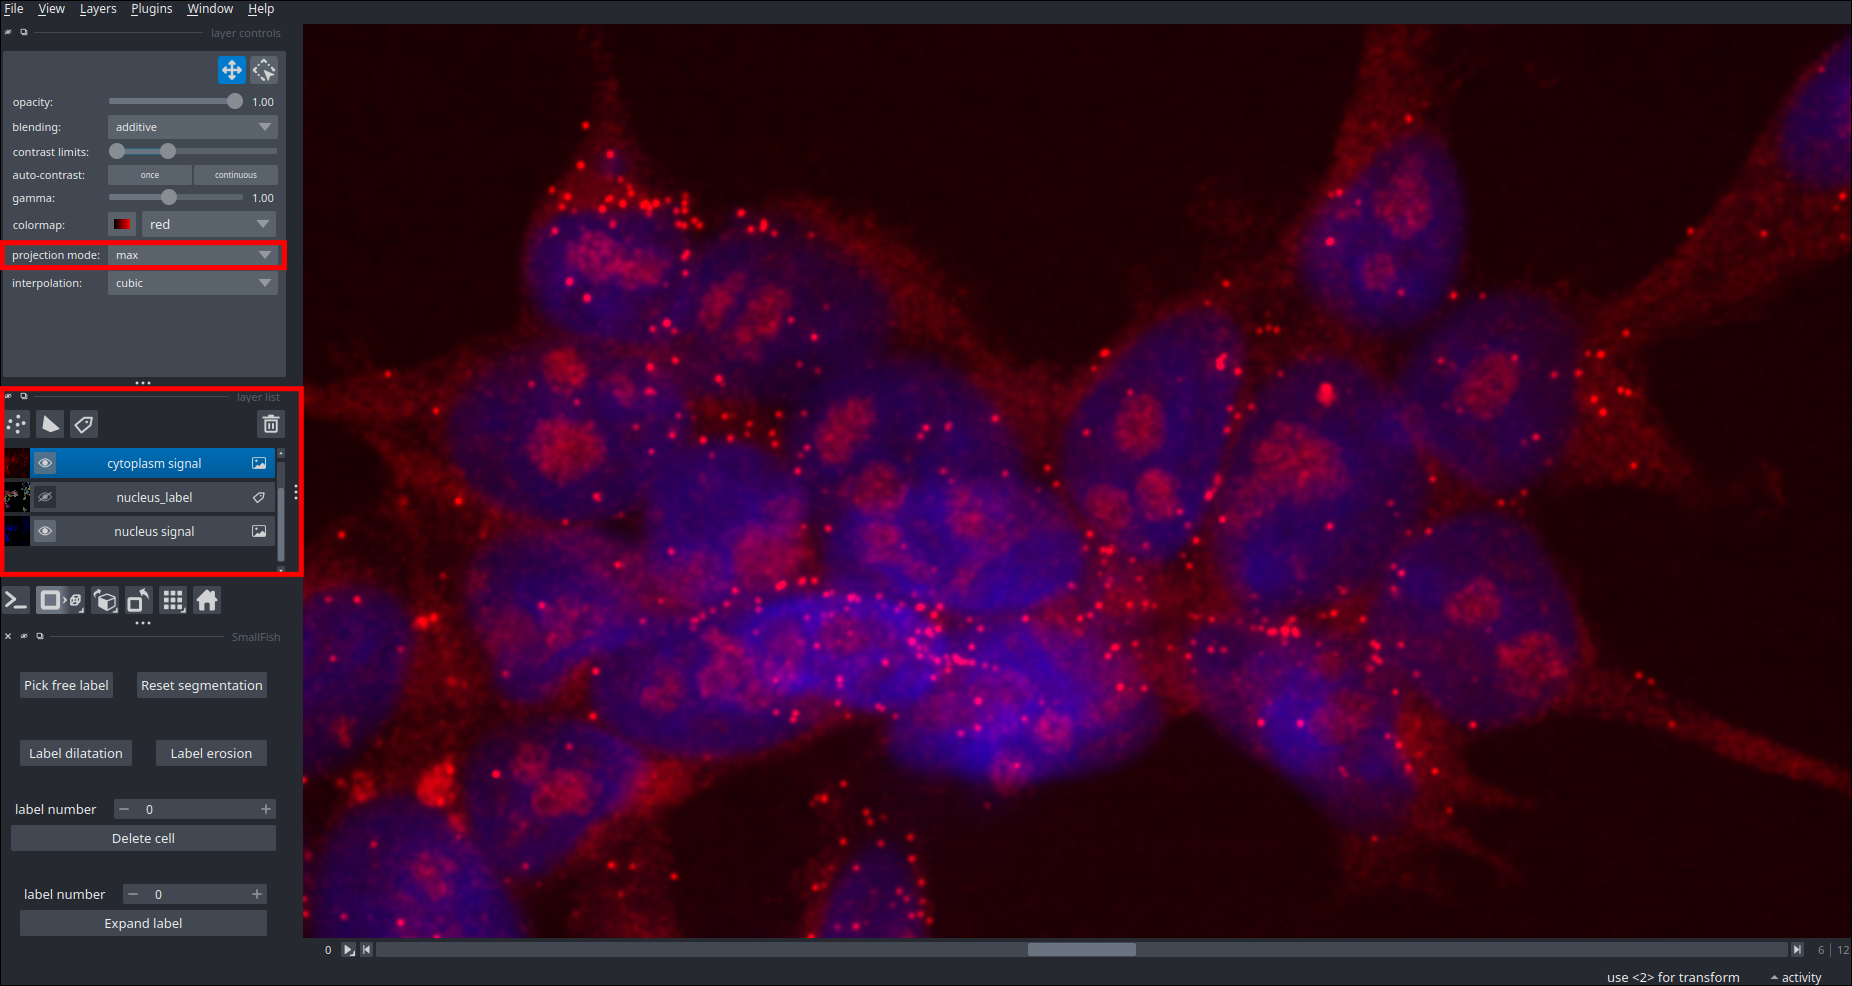
Napari offers a possibility of more advanced projection while staying in 2D mode. To do so right-click on scroll bar allowing you to go through the z axis, in the pannel you can choose how many slices you want to include in your projection (above and below the viewed slice). By default napari will project using mean rule but you can choose individually on each layer the kind of projection you want.
| no projection | fish max proj and dapi mean proj |
|---|---|
 |
 |
To read a value from a layer in Napri (ie image intensity, segmentation label...) the user must ensure the layer is clicked as it is impossible to interact with a layer without selecting it.
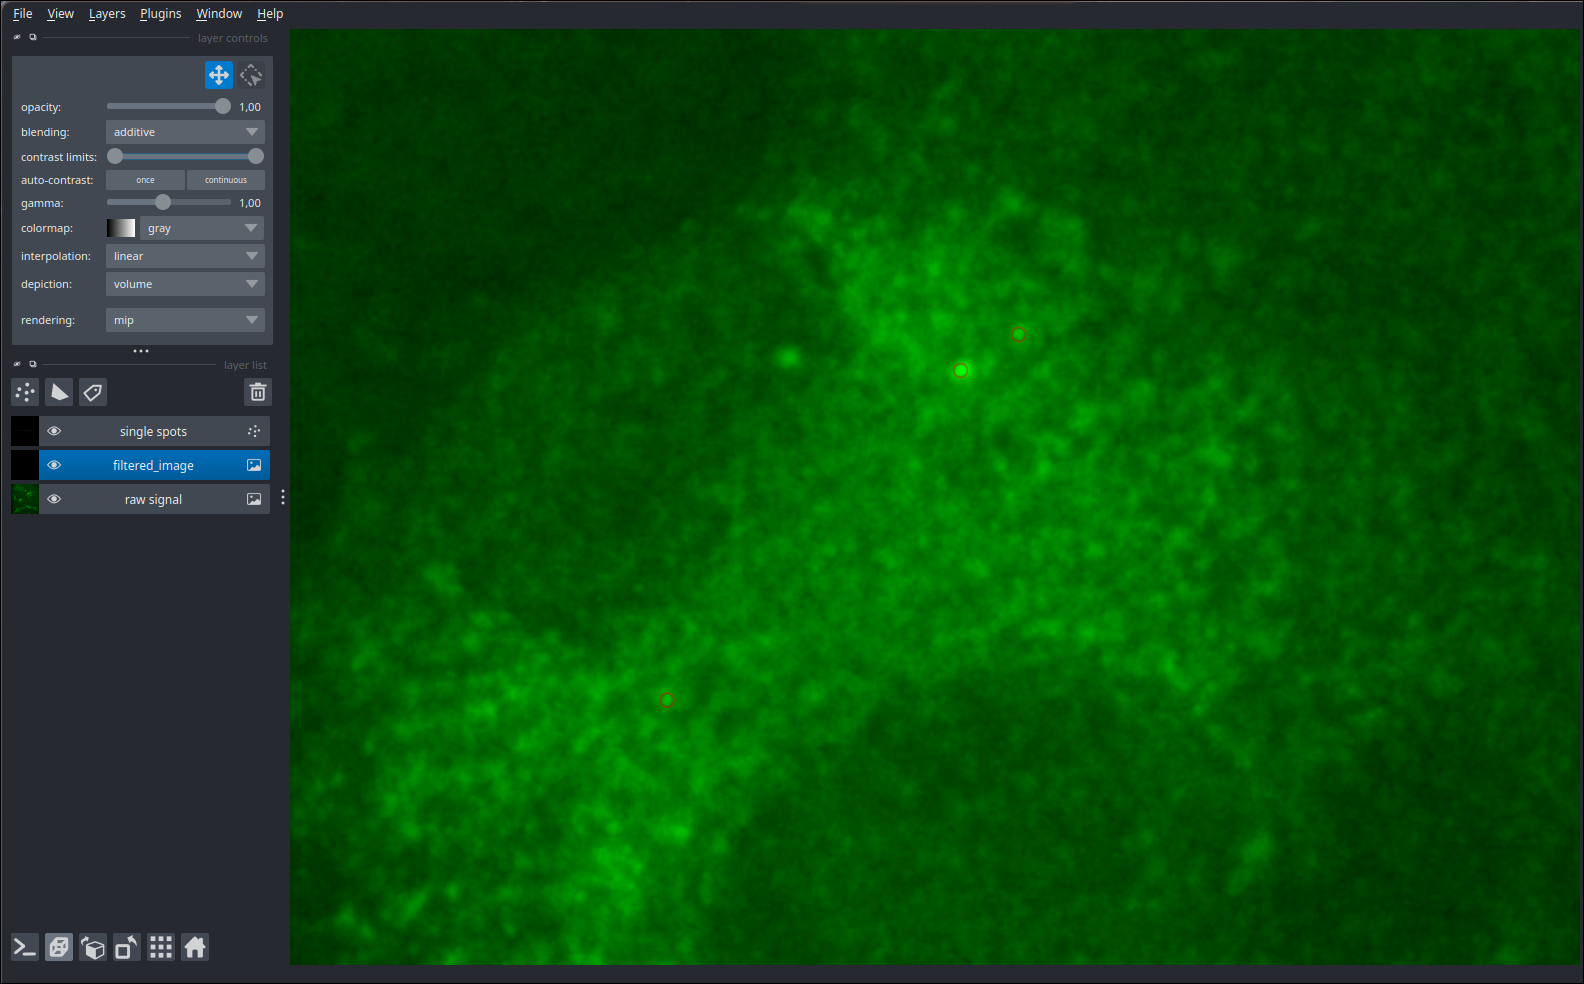
To select a spot from a spot layer simply select the layer first, ensure you are in selection mode  , then click or ctrl+click if you want to select multiple spots. To select all spots in this z-slice use Ctrl+A shortcut and to select all spots in all slices use Shift + A shortcut.
If you don't have your own screenshot software you can take some with or without Napari interface shown by going in : Files -> Save screenshot
Napari is build on QT graphical implementation and it is know to have conflicts with some drivers for AMD CPU. The bugs are being fixed by the Napari community and some solutions are available on the internet for specific errors you may encounters. There is no alternative in Small Fish to interact directly with quantification than Napari, it is though possible to save quantifications visuals to assess quantification quality post process.
In this section is detailed how to use the Small Fish custom tools for segmentation in Napari. To access details on how segmentation is handled please refer to the segmentation section. To access Napari visualisation for segmentation first click segment cells in main menu and make sure to tick the show segmentation option during parameters selection.

Here is a display of what you should typically get after running segmentation.

You will find here a visualisation of segmentation after cellpose was run. Hopefully segmentation went well but it is not always the case and you might have less trouble simply correcting the output manually than re-training a model in cellpose to have better performance. To do so Small Fish adds a set of tools on the bottom left.
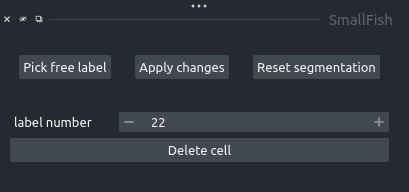
To add a cell to segmentation you might use the brush and filler (bucket icon) tools on both cytoplasm_label layer and nucleus_label layer. But to do so you must first select a label number that is free, a simple way to do this is to click Pick free label button in the SmallFish toolbox.
When finished you can press the 'apply changes' button to propagate your segmentation on all 3D slices, if you forget to press this button upon exit the software will apply changes on its own.
Note : If different label numbers when apply on same pixel (yx) but on different slice (z) software will keep maximum label value. This behavior can be visualized by using the apply changes button.
To remove a cell from segmentation you must remove all its pixel from cytoplasm and nucleus labels. A simple way to do so is to select the according cell number with the color picker tool and to click the Delete cell button.
To correct a cell you can use the brush or eraser tools by first selecting the layer you want to modify (nucleus_label or cytoplasm_label) and then modify it. By default the option preserve labels is enabled allowing you to modify only the label number that is currently selected, this option can be untick on the left of the viewer. Additionaly, When 3D rendering is disabled you can modify the contour parameter (default 0) to visualize the borders of segmentation instead of fully colored cells.
To increase or decrease the size of segmented nuclei or cytoplasm dilation and erosion buttons are available, to use them simply select any label layer and click on the dilatation or erosion button. An example of the operations is shown below outside the segmented label, in brown, is shown the dilatation result and inside, in pink, the erosion result.

If you made any mistakes or want to revert to segmentation as cellpose predicted it you can click on the **Reset segmentation button.
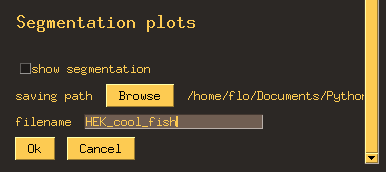
It is possible to save a png visual of segmentation by puting a folder and a name in Segmentation plots in segmentation settings.
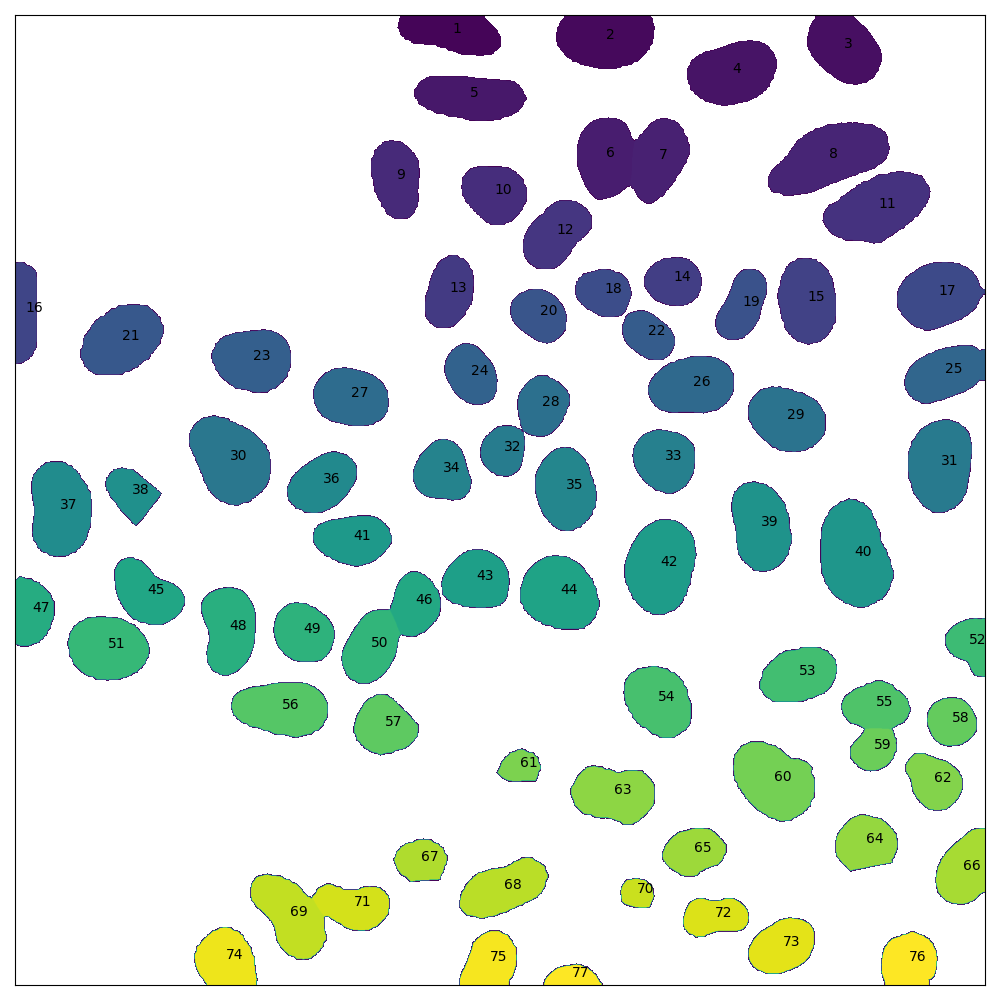
After validation of cell segmentation, Small Fish will save png visuals aimed at inspecting or sharing segmentation performance. Two files will be available for both nuclear and cytoplasm signal : segmentation boundaries (left), or label map (right). On boundaries visuals nuclei boundaries are shown in blue and cytoplasm boundaries in red.
| Segmentation boundaries | Label map |
|---|---|
 |
 |
 |
 |
This option allows the user to load previously segmented cells either with small fish or any other software given that they are saved in .npy (numpy format). Loading cytoplasm mask is optional but loading nucleus mask is optional. Remember that in case you have no nucleus marker but you want to perform cytoplasm segmentation you can load you cytoplasm mask as nucleus or as both nucleus and cytoplasm.
In case you want to load masks saved as .npz files make sure they is only one mask saved in the file as this format allows for multiple masks to be saved together.
To correct detection before quantification, you will need to tick the option Open results in Napari when selecting an image.

To add spots simply select the single spots layer on the left of the viewer and select the adding spot option . When adding spots it is recommended to turn off 3D rendering as it will always place new spots on the middle z-slice.
To remove a spot or cluster select it (first select the selection tool) and press the delete key.
In Napari you can modify the clustering results before proceeding to quantification. Before doing anything, make sure you will be working with an appropriate threshold and you are done adding/removing spots. Then you can play with the clustering parameters (see detection section) to find your optimal initial setup. From there a few functonnalities are available.
To add cluster you cannot use the add button as for the spots. First select the single spots and the selection tool , select the spots you would like to use to form a new cluster and click the Create Cluster button. The position of the new cluster will be the centroid of all selected spots.
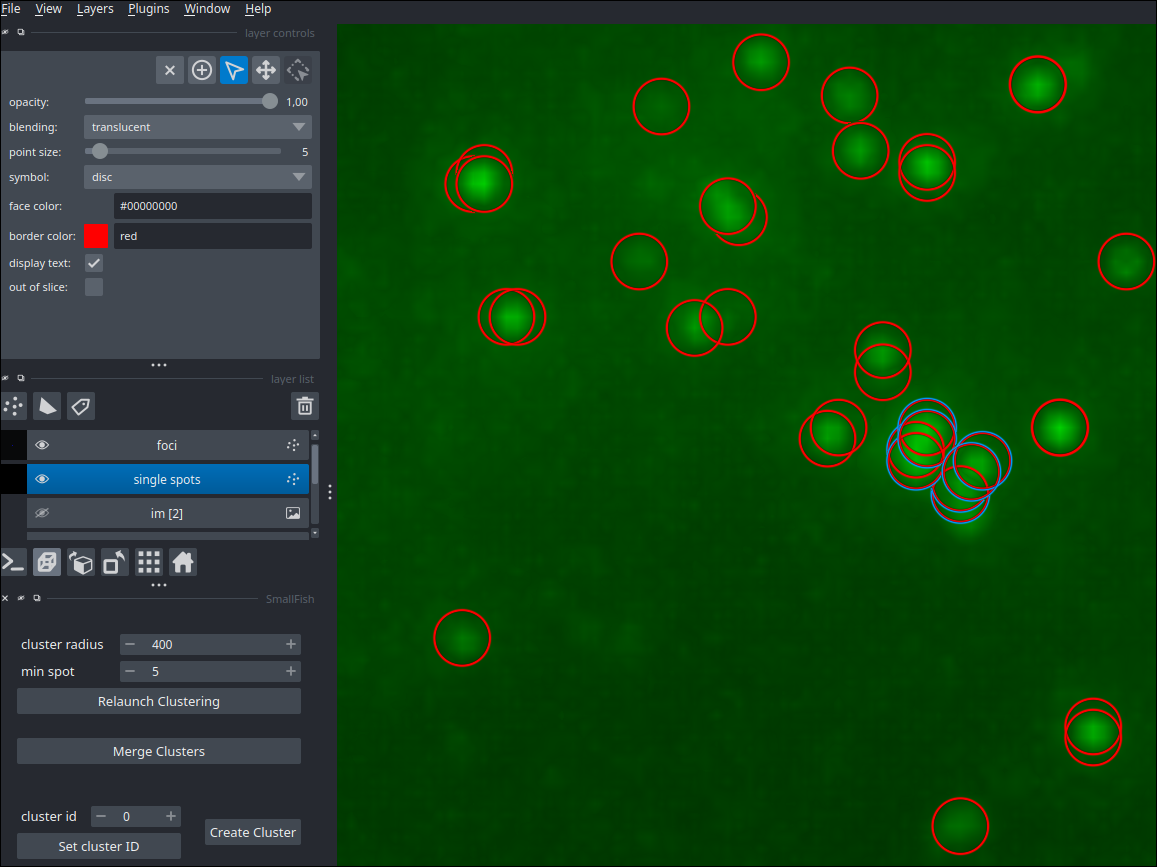
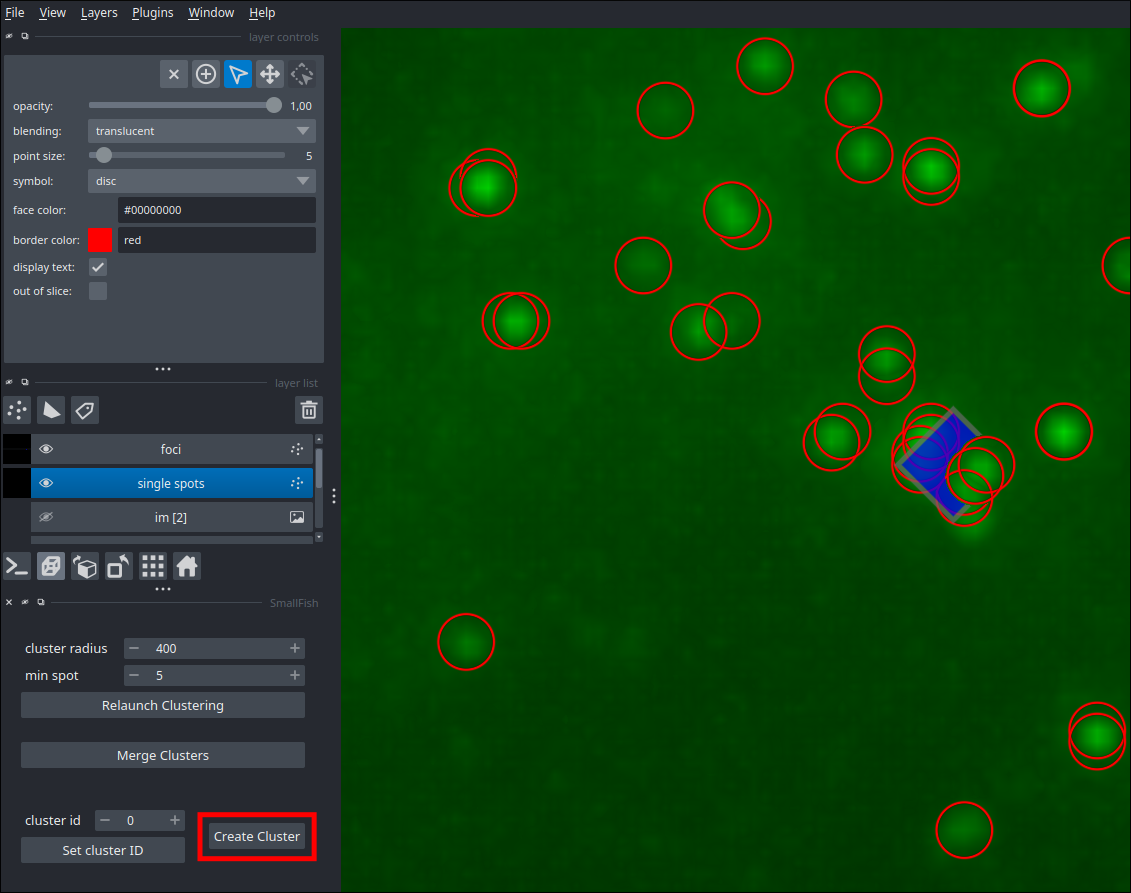
When selecting cluster using the foci layer and the selection tool, belonging spots will be filled in green. Additionally you can the and the bottom left corner of the window the cluster_id value and the number of single molecules inside the cluster.
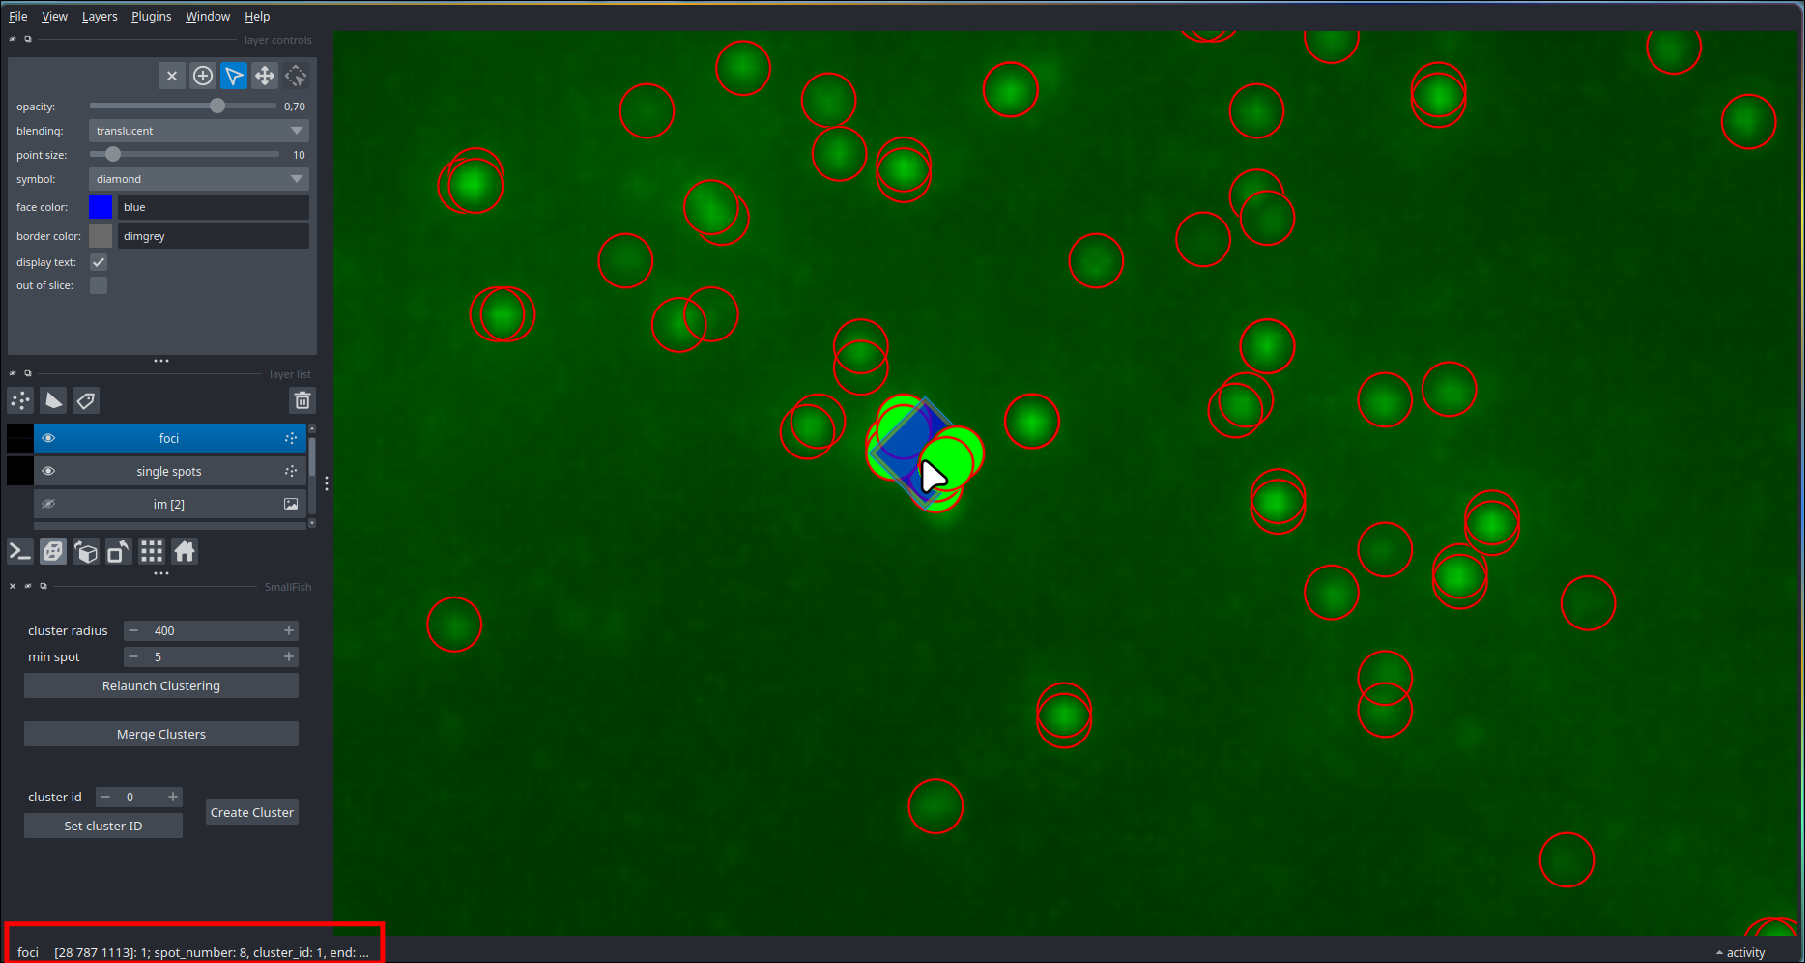
After retrieving the cluster id (see above), you can select a one or several spots and add them to the cluster using the Set Cluster ID button. On the contrary to remove a spot from a cluster but keep the spot you can set the cluster ID to -1.
To merge cluster, select at least two clusters in the foci layer and click the Merge Clusters button. The new cluster will get all spots from merged clusters and its postion will be the centroid of all selected spots.
Similarly to spots, you can select cluster in the foci layer and press the delete key to remove them. Note that any cluster that drops to 0 spot will be deleted.