Detection
Spot detection is performed using the BigFish package (published work : cite).
To detect single molecule a LoG threshold based algorithm is performed. Users can use 2 parameters to impact spot detection : threshold, and spot_size.
Fluorescent single molecules appears on FISH images as bright, most often tiny, spots, the idea of this algorithm is to detect variation of intensity in regions of diameters equal to spot size parameter.
- A gaussian blur is first applied, filtering out intensity variation due to noise and focusing dection at a spatial scale matching the spot size.
- Secondly, we use a Laplaccian (intensity second derivative) to detect intensity maxima.
- Thirdly a maximum filter finds local maxima according to the spot_size.
- Automatic or user selected threshold is applied to select local maxima considered as single molecules.
For each single molecule pixel coordinates of local maxima are passed down to the software as the single molecules positions.
Note that it is only on the image resulting from LoG filters that the threshold is applied on meaning that the threshold value should NOT be based on original intensity values.
This algorithm can have really good performance given that you are willing to use a user set threshold. However regions with a high density of spot such as transcription site or foci will yield only one or two spots due to the max filter. To adress this issue a dense region deconvolution algorithm can be used, see section 2.
An automatic threshold can be used to avoid user bias but the quality of this automatic threshold is strongly impacted by the quality of the signal to noise ration of your image. The automatic threshold will be used whenever the user leaves a blank in the threshold parameter.
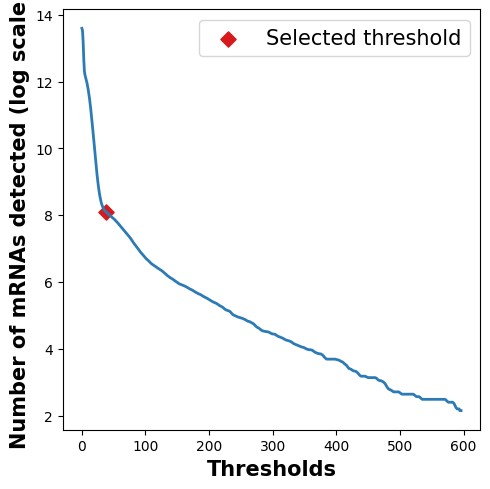
To compute the automatic threshold the software will plot the number of single molecules detected versus the threshold used (see below).
| Correct signal to noise ratio | Bad signal to noise ratio |
|---|---|
 |
|
Logically the curve is always decreasing and should hit a critical threshold where all background points are already filtered leading to an inflexion point. The automatic threshold is set by detecting the curve's inflexion point. This point can be more or less well defined depending on the quality of your signal and the presence of different spot population (i.e. : single molecules and clusters). In the case where the user wants to use automatic threshold but is not satisfied with the result the threshold penalty parameter can be used and will act as a multiplicator of the automatic threshold.
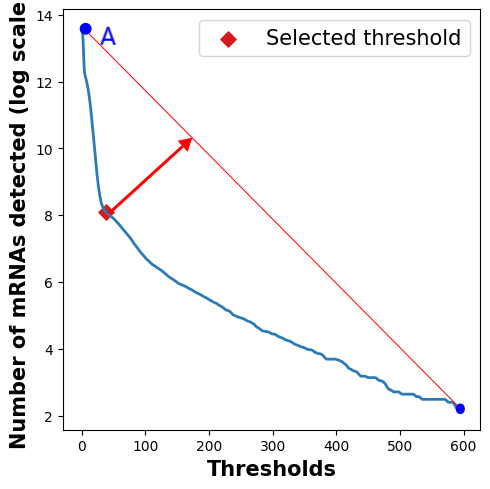
Inflexion point is computed using a maximum distance rule. Let us consider the elbow curve going from A to B, assuming it does follow an elbow shape (L shape) the inflexion is the point farther from the AB segment.
-
spot size : Expected size of single molecule in nanometers (zyx). This parameter is used to compute Gaussian blur and maximal filter kernel sizes. For diffraction limited spots, the same value as the voxel size can be used. Note that it is possible to use a value lower than the voxel size but will make the algorithm much more sensible to noise, in case the the spot size is too low, the software will return an error.
-
threshold : Threshold value used AFTER application of detection filters (see above). If no threshold is set (blank space) an automatic threshold will inferred (see above).
-
threshold penalty : Multiplicative factor applied only when using automatic threshold. If blank set to 1.
-
LoG kernel size : Size of the LoG kernel. It equals the standard deviation (in pixels) used for the gaussian kernel (one for each dimension). One value per spatial dimension (zyx or yx dimensions). If it’s a scalar, the same standard deviation is applied to every dimensions. If None, we estimate it with the voxel size and spot radius.
-
minimum distance : Minimum distance (in pixels) between two spots we want to be able to detect separately. One value per spatial dimension (zyx or yx dimensions). If it’s a scalar, the same distance is applied to every dimensions. If None, we estimate it with the voxel size and spot radius.
If your image has dense bright regions the spot dection algorithm might yield an underestimated number of spots because of the size of the maximum filter (see section 1). In such a case you can use this algorithm to compute a more accurate estimation of single molecule numbers in dense regions. This algorithm is based on the detected spots and 3 user defined parameters : alpha, beta, gamma.
The aim of this algorithm is to get a more accurate estimation of single molecule number by fitting Gaussian spots into the intensity signal of the image.
First of all a Gaussian blur is applied to the image according to the gamma parameter removing noise and setting spatial scale accordingly.
To get the fitting parameters a reference spot is computed as the alpha-percentile of the spot distribution by default the median spot is taken as the reference spot (i.e. : alpha = 0.5)
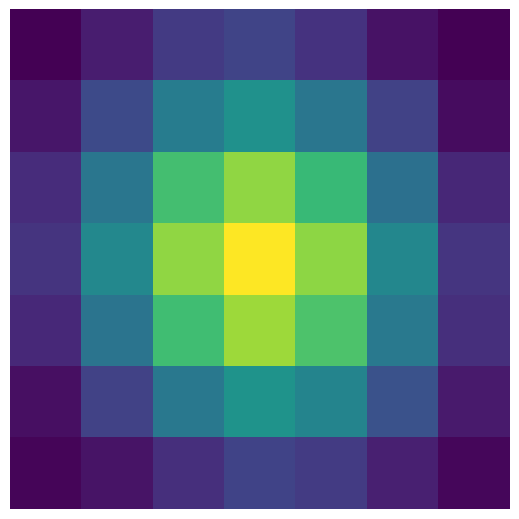
Then bright regions are detected as regions with at least 4 connected pixel above an intensity threshold. This threshold is defined with :
Threshold = beta x median_intensity With median_intesity being the actual median intensity independently of alpha value.
The algorithm will then try to compute more accurate estimation of single number in those bright regions by reconstructing the original signal using only the reference spot. At each iteration the algorithm will add one spot randomly in the bright region and compute the residual sum square (RSS) between the reconstructed and the original signal. As soon as the RSS starts increasing the last added spot will be removed and all the new spots are kept for the software quantification.
-
alpha : Percentile for reference spot selection, float between 0 and 1.
-
beta : Penalty for bright region detection, is applied as a multiplicative factor of the median spot intensity.
-
gamma : Multiplicative factor use to compute the gaussian kernel size:
$kernel\space size = \frac{\gamma.spot\space radius}{voxel\space size}$ We perform a large gaussian filter with such scale to estimate image background and remove it from original image. A large gamma increases the scale of the gaussian filter and smooth the estimated background. To decompose very large bright areas, a larger gamma should be set. .
-
deconvolution kernel : Standard deviation used for the gaussian kernel (one for each dimension), in pixel. If it’s a scalar, the same standard deviation is applied to every dimensions. If None, we estimate the kernel size from ‘spot_radius’, ‘voxel_size’ and ‘gamma’
Small Fish provides additional quantification by discriminating spots forming clusters from "free" spots. The cluster detection is based on well described Density Based Spatial Clustering of Applications with Noise. (DBSCAN) (add citations) and uses the sklearn package implementation. The user needs to give 2 parameters for this algorithm : cluster size and min spot number.
The idea for this algorithm is that each point having more than min spot number spots in its surrounding (cluster_size) is labelled as a core point and its surrounding spots as directly reachable points. All directly reachable points are checked to see if they fit the neighbouring spot condition too. In such a case they become core points allowing the cluster to grow. Spots that are not assigned to clusters are called outliers.
In Small Fish all core and directly reachable points are considered as clustered spots and outliers as free spots. If you are using the clustering feature is it recommended to use the dense region deconvolution algorithm as well.

- cluster_size : Expected size of a cluster in nanometers.
- min spot number : Minimum number of spot that must be found in neighborhood for a spot to be considered a core point
There is currently not subpixel fitting implementation in Small Fish, all single molecules are detected with to plus/minus one pixel precision.