Spectrum Test
The Spectrum test basically displays the voltage of every frequency from 1... sample rate/2. It is one of the most ubiquitous and useful tests in the application. (1)
Click the image below to watch the Spectrum Test video.
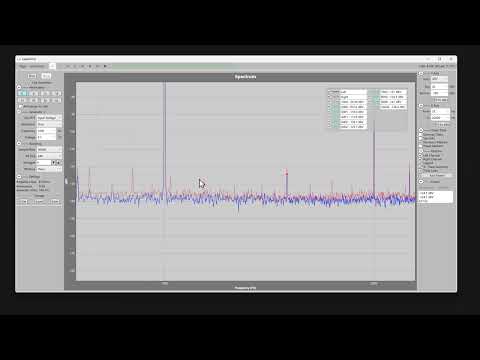
Generally you run the test with a single frequency Sine wave. With a theoretical perfect DUT this signal would graph as a horizontal line at 0 (no voltage at any frequency) other than a spike at the fundamental sine frequency with height = the RMS voltage of the signal. In practice, there are three other common distractions.
-
Power line hum, showing up as (sometimes fat) spikes at 60Hz and multiples thereof in the US (50Hz elsewhere).
-
Harmonic distortion, showing up as spikes at the n * fundamental frequencies.
-
Background noise, showing up as lots of 'grass' in the horizontal line.
Here's a picture of Spectrum measuring a 1KHz sine wave - with those issues and markers on them to make it very clear. This image was created with a loopback connection on the QA403, so it is much cleaner than a typical power amp test.

The test definition includes the Attenuation block, the usual Generator options and usual sampling options and that's about it. So, pick a frequency and voltage click run and there's the spectrum. The cursor area on the right shows the amplitude of the spectrum at the mouse position.
The Summary Data box for the spectrum test is extensive. It updates in real-time as the test runs repeatedly and it displays numerous standard audio statistics for the first two displayed channels (including files you Get).


The Data Summary shown on the right above differs by:
- Check off the % - Data Summary option to show values in V instead of %
- Use Y axis units of dBu to cause the two absolute voltages (N and Fundamental) to display in dBu
Other Spectrum Options include->
- Check Harmonic Markers on to have the program automatically add a marker on each harmonic.
- Check Power Markers to have it add a marker on each Power harmonic (up to 3). There is a Setting to pick 50 or 60Hz power line.
Note 1: actually the frequency distance between data points is FFT Size / Sample Rate Hz.