03_df_to_sp
May 2, 2018 - Mike McMahon (mike.mcmahon@dfo-mpo.gc.ca)
This function takes a dataframe and converts in to a SpatialPointsDataframe.
The sp package cannot plot a data.frame (with valid coordinates) by default:
> str(data)
'data.frame':	1435 obs. of  5 variables:
 $ MISSION  : chr  "ATC1970176" "ATC1970176" "ATC1970176" "ATC1970176" ...
 $ SETNO    : int  10 13 15 17 1 23 26 28 2 32 ...
 $ LATITUDE : num  44.7 44.8 44.2 44.3 44.3 ...
 $ LONGITUDE: num  -60.9 -60.1 -59.9 -60.5 -62.2 ...
 $ TOTNO    : int  1642 1107 41 560 947 7 3463 102 369 246 ...
> sp::plot(data)
Error in plot.window(...) : need finite 'xlim' values
...
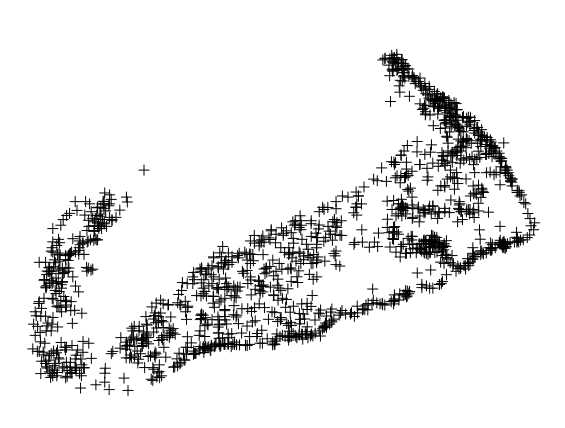
but if we run the same data against this function, it gets converted from a data.frame to a SpatialPointsDataFrame, and can be plotted.
> data_sp = df_to_sp(data)
> str(data_sp)
Formal class 'SpatialPointsDataFrame' [package "sp"] with 5 slots
...
>sp::plot(data_sp)