14_Data_Sets
May 2, 2018 - Mike McMahon (mike.mcmahon@dfo-mpo.gc.ca)
This is a SpatialPolygonsDataFrame of the NAFO divisions. It is derived from the file that was available on the VDC. The primary fields of interest are NAFO_1, NAFO_2, NAFO_3 and NAFO_BEST. NAFO_BEST is always populated with the most detailed NAFO subunit possible, while the _1, _2 and _3 in the names of the other columns essentially refer to how many characters exist in each field following the integer.
> tail(NAFOSubunits@data)
    OBJECTID Shape_Leng  Shape_Area NAFO_1 NAFO_2 NAFO_3 NAFO_BEST
0          1  33.508870   5.1751418     6A   <NA>   <NA>        6A
1          2  36.842889  12.6304564     6B   <NA>   <NA>        6B
109      192  10.905534   1.0828271     4W    4WD   <NA>       4WD
110      193   3.999996   0.8055399     4W    4WE   <NA>       4WE
140      249   6.907884   2.5544606     3P    3PS   3PSH      3PSH
141      290   7.354711   1.7175268     4V    4VS   4VSB      4VSB
Show code for plotting full dataset.
sp::plot(NAFOSubunits)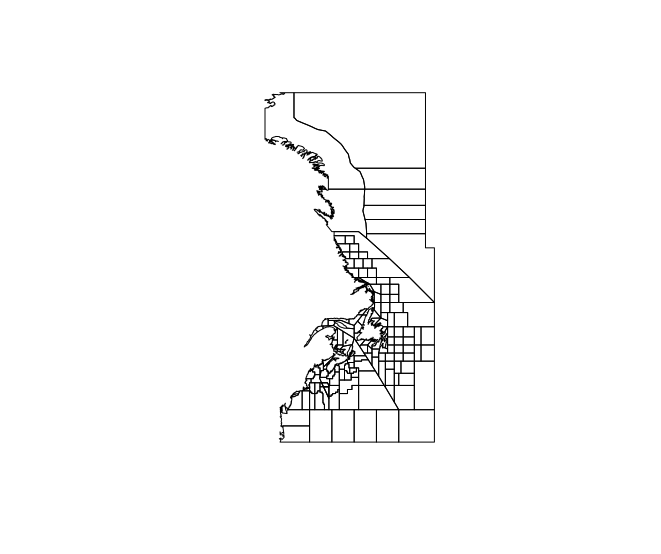
Show code for plotting detailed extent (with labels)
# change the extent
NAFOSubunits@bbox[1,]<-c(-63,-58)
NAFOSubunits@bbox[2,]<-c(45,48)
# plot it
sp::plot(NAFOSubunits)
# label it by NAFO_BEST
library(maptools)
invisible(text(maptools::getSpPPolygonsLabptSlots(NAFOSubunits), labels=as.character(NAFOSubunits$NAFO_BEST), cex=1.0))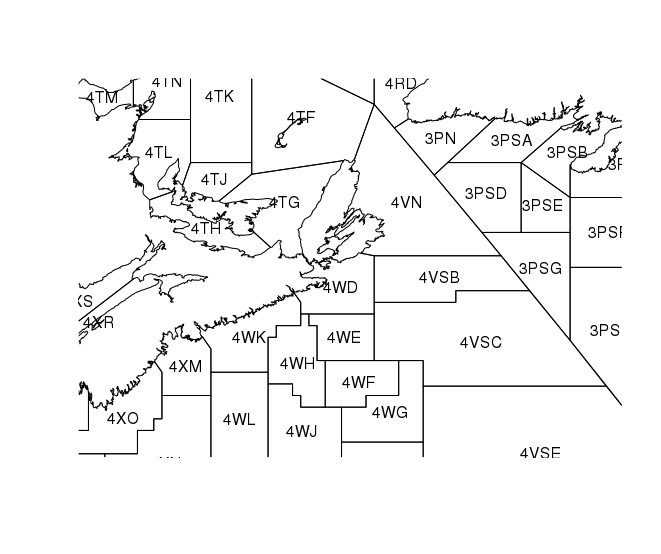
This is a SpatialPolygonsDataFrame of 2min grid cells for the Maritimes region. This grid is often used when aggregating data.
sp::plot(grid2Min)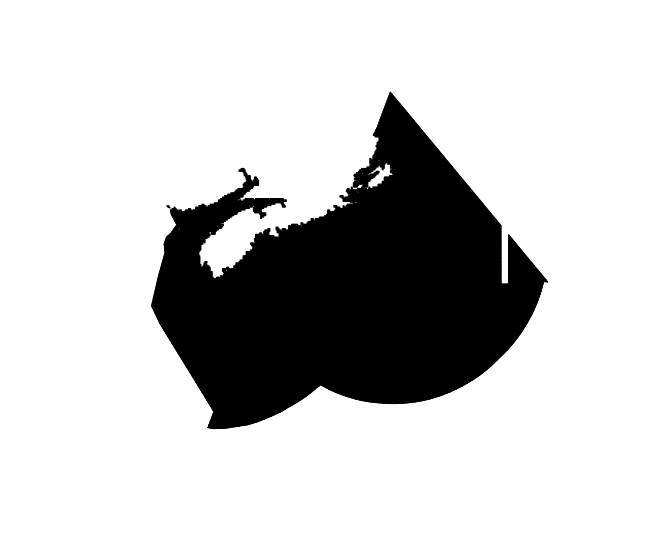
A smaller extent shows the detail.
# change the extent
grid2Min@bbox[1,]<-c(-63.80,-63.60)
grid2Min@bbox[2,]<-c(44.40,44.70)
# plot it
sp::plot(grid2Min)
# add the nafo subunits for context
sp::plot(NAFOSubunits, add=T, border="blue") #add the NAFO areas for context and relative size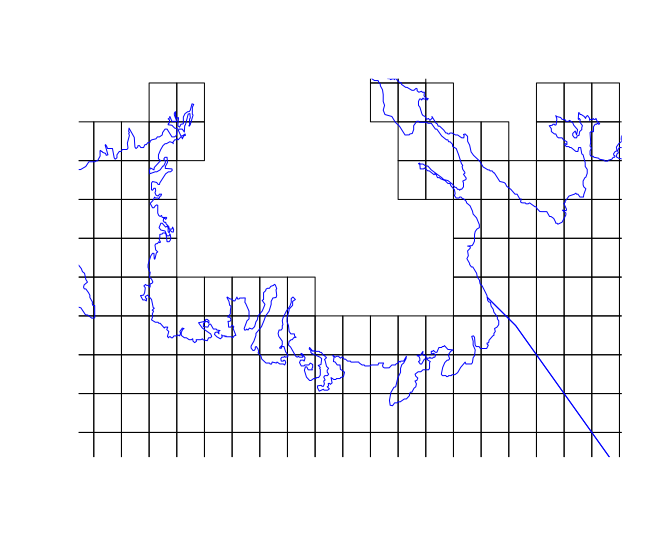
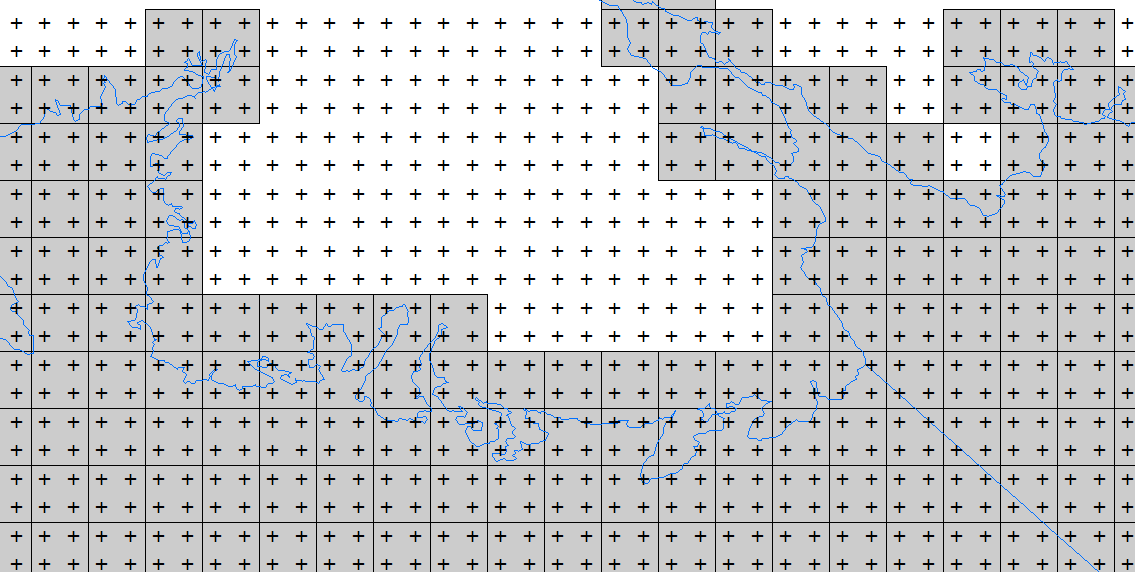
It should be noted that in the 2 min grid squares were intentionally constructed so that they did *NOT## overlap lines of longitude and latitude. Since data is often reported to the nearest degree or minute, the offset grid ensures that these common values fall into the appropriate cell, and is not subject to "edge effects" that sometime occur when spatial data lands on a line. Below, crosshairs indicate the intersections of the minutes of longitude and latitude.