Architecture Dashboard
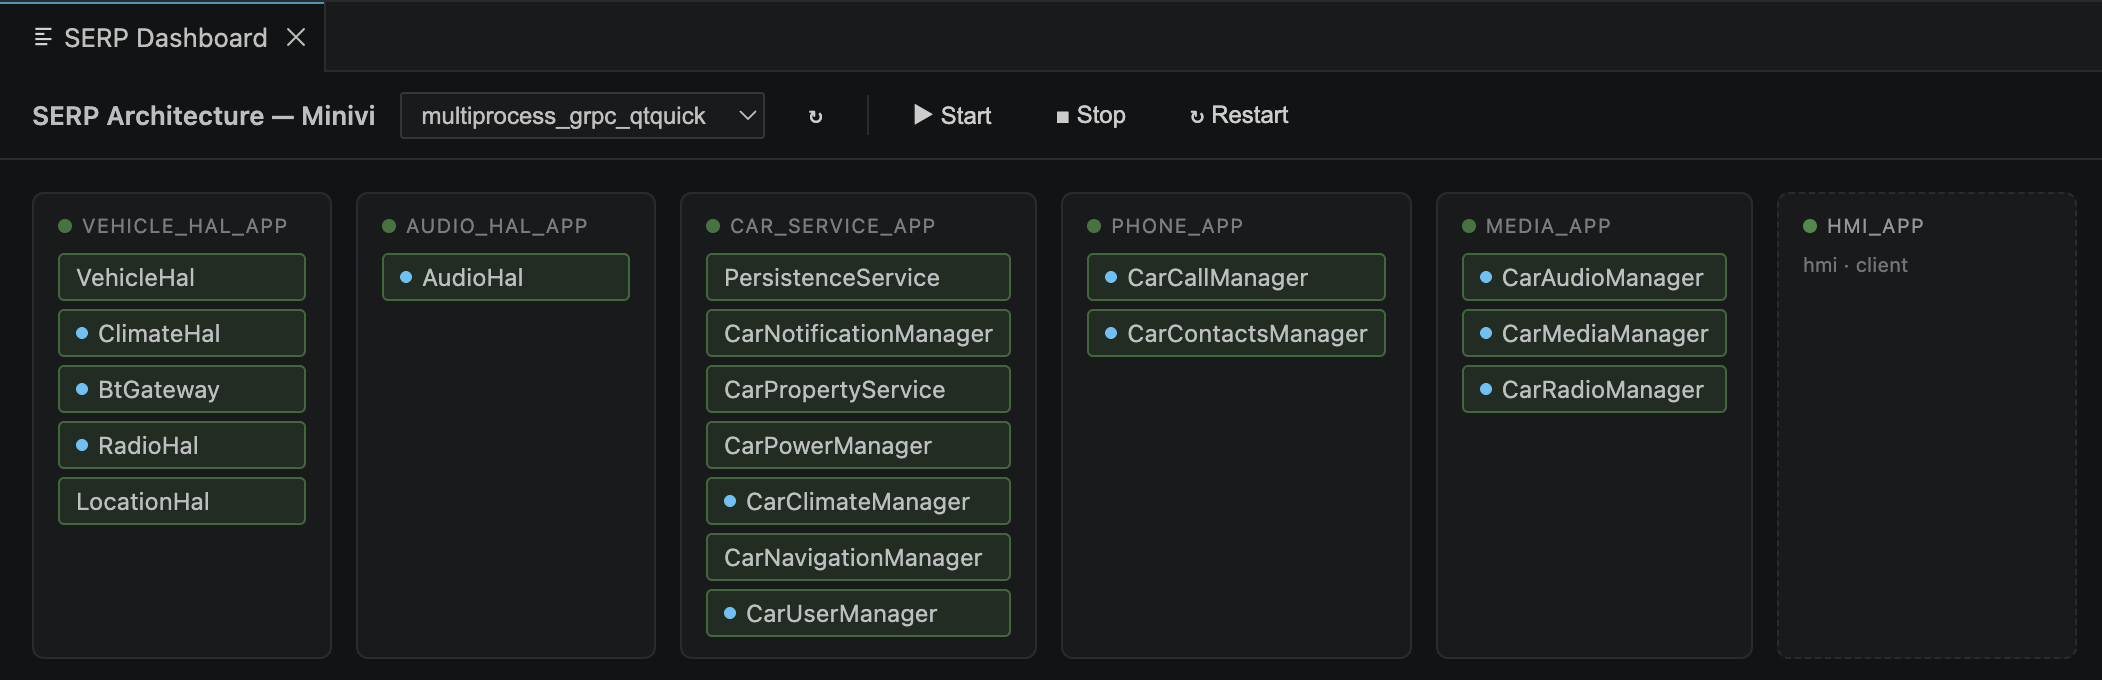
The Architecture Dashboard is an interactive live view of the active deployment. It shows all processes as cards, displays live CPU and memory stats, renders dependency arrows between communicating processes, and lets you start, stop, and inspect any part of the running system — all from a single panel.
Use any of the following:
-
Keyboard shortcut:
Ctrl+Option+D(macOS) /Ctrl+Alt+D(Linux/Windows) -
Command Palette:
Ctrl+Shift+P→SERP: Architecture Dashboard - Explorer toolbar: click the Dashboard button
The dashboard opens as a VS Code webview panel. It can be dragged to a separate editor column to keep it visible alongside code.
Each process in the active deployment is represented by a process card. Cards are laid out to reflect the service topology.
Each card shows:
| Element | Description |
|---|---|
| Process name | Clickable — opens the process detail panel |
| Status dot | Green (running), red (stopped), grey (unknown/unreachable) |
| CPU% | Live CPU utilization, updated every 4 seconds |
| MEM | Live memory usage, updated every 4 seconds |
| Service chips | Each service hosted by this process; clickable — opens the service detail panel |
SVG arrows are drawn between process cards to represent inter-process communication. Arrow direction follows the uses / implements relationships defined in the specs: an arrow from process A to process B means A calls services hosted by B.
Arrows are updated automatically when the deployment model changes (for example, after regenerating specs).
A dropdown at the top of the dashboard lets you switch between deployments without closing the panel. Switching updates all cards, arrows, and stats to reflect the selected deployment.
| Button | Description |
|---|---|
| Start | Start all processes in the active deployment |
| Stop | Stop all processes in the active deployment |
| Restart | Stop then start the full deployment |
Right-click a process card, or expand the card's action menu, to access:
| Action | Description |
|---|---|
| Restart | Restart this process only |
| Stop | Stop this process only |
| Open Log Terminal | Open a VS Code terminal streaming this process's stdout/stderr |
Clicking a service chip opens the Service Detail Panel (a slide-in panel within the dashboard), which shows:
- The interface the service implements (link to
.sidl.yaml) - Available methods, properties, and notifications
- Links to the implementation file and generated base class
- Active AI sessions scoped to this service
- A shortcut to open the Runtime Inspector for this service
The extension backend polls process CPU and memory utilization from the OS every 4 seconds and pushes updates to the webview. The polling runs only while the dashboard panel is visible and pauses automatically when the panel is hidden or closed.
- Explorer — Project tree and toolbar actions
- Runtime Inspector — Call methods and watch properties on running processes
- Build Profiles — Enable the runtime debug backend for inspector access