Runtime Inspector
The Runtime Inspector lets you call methods, read and watch properties, and subscribe to notifications directly on a running process — without writing any client code. It connects to the process's runtime debug backend over gRPC (macOS and Linux) or DBus (Linux).
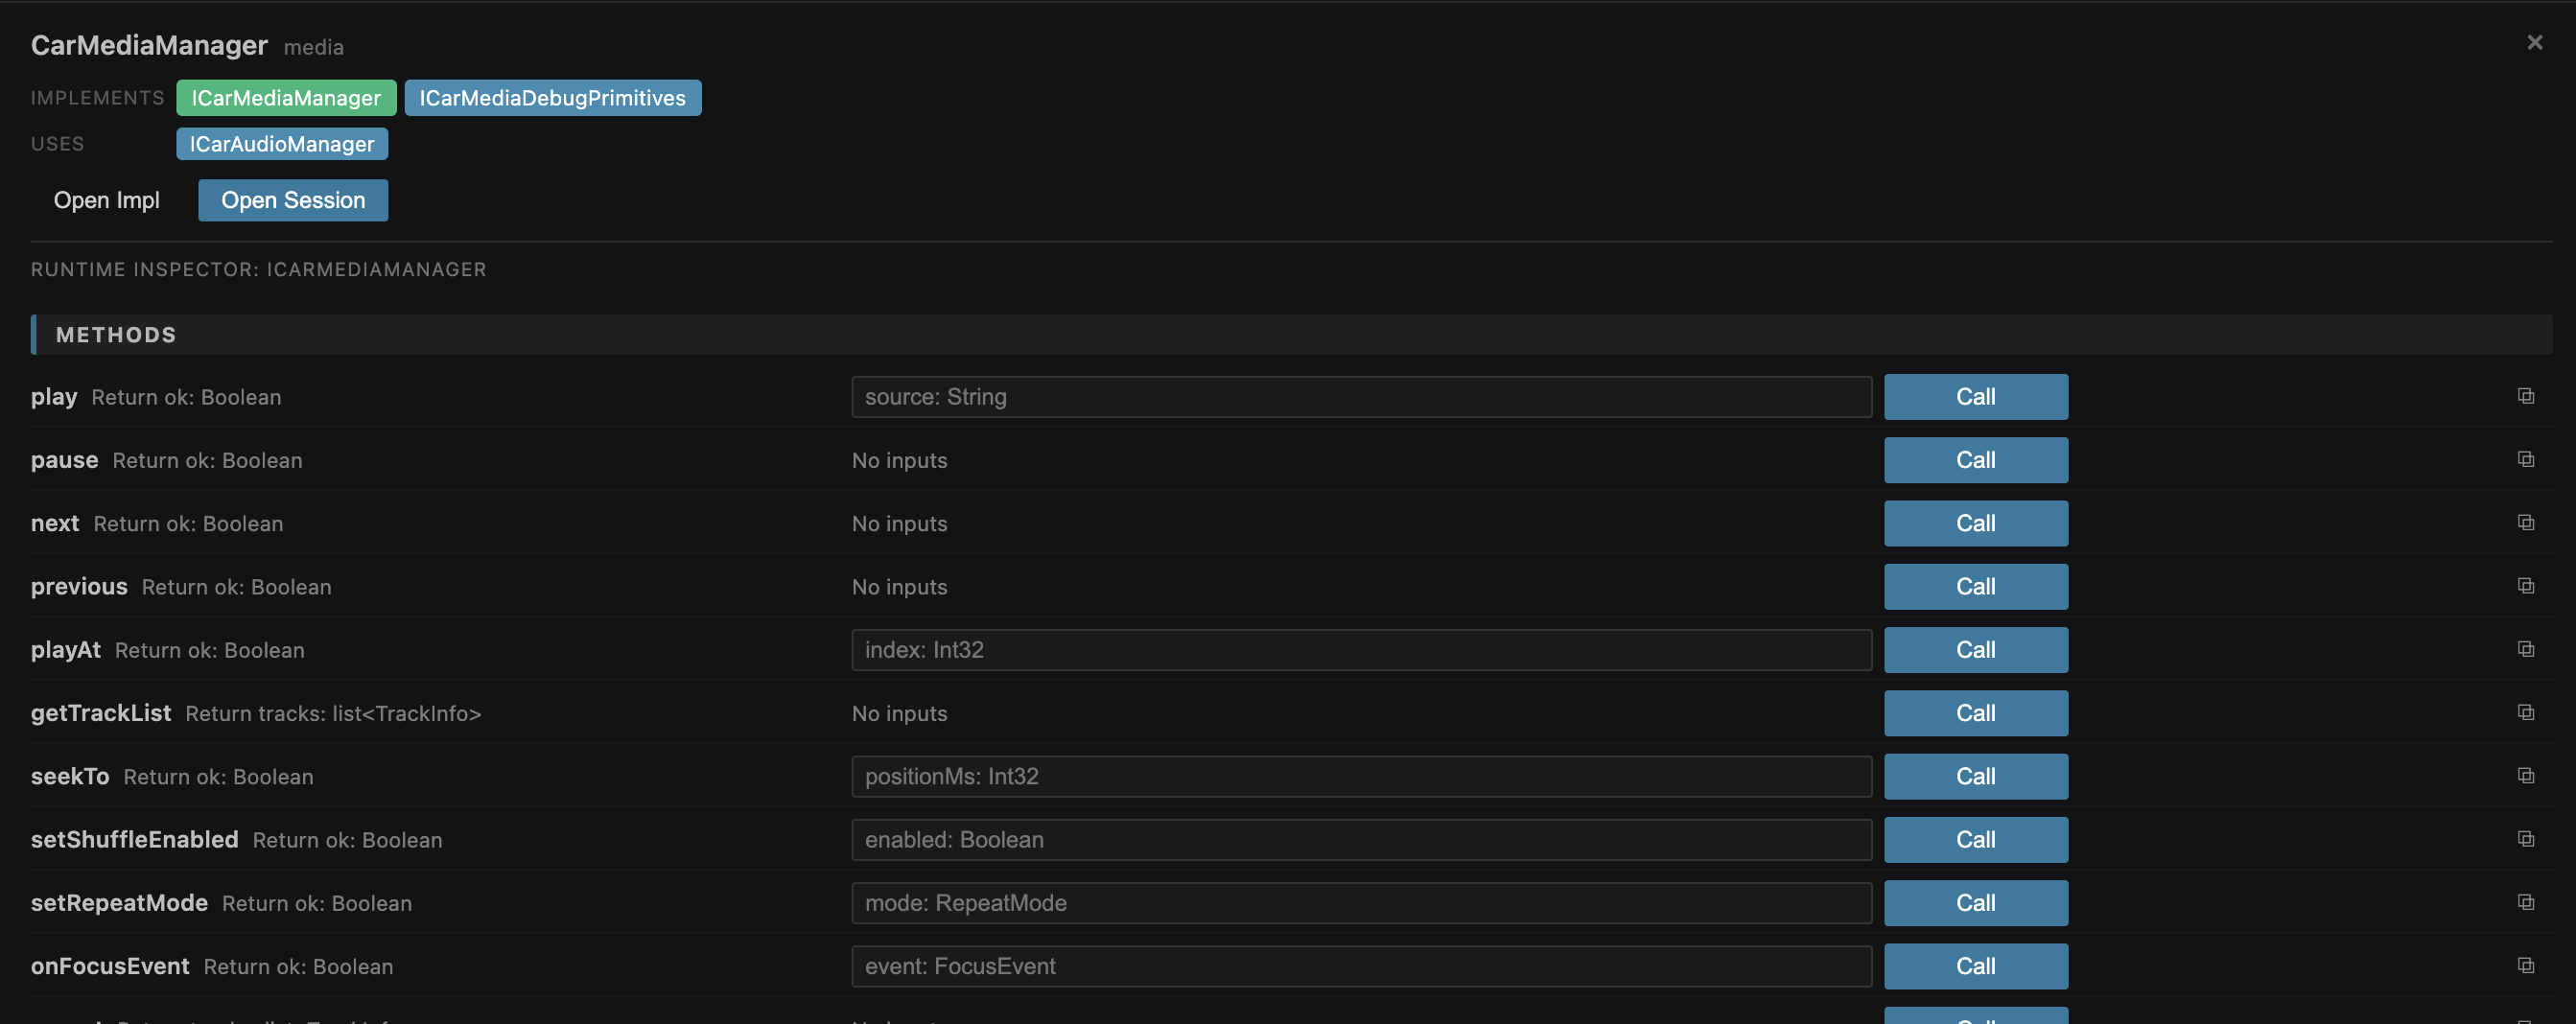
The Runtime Inspector requires a process that was built with the runtime debug backend enabled. Not all build profiles enable it.
| Requirement | Details |
|---|---|
| Build profile | Must be Dev (gRPC) or Dev (DBus). The Auto and Release profiles do not enable the runtime debug backend. See Build Profiles. |
| grpcurl (macOS) | Required for the gRPC transport. Install with brew install grpcurl. |
| gdbus (Linux, DBus) | Required for the DBus transport. Available by default as part of glib on most Linux distributions. |
| Running process | The target process must be running. |
- Open the Architecture Dashboard (
Ctrl+Option+D/Ctrl+Alt+D). - Click on a service chip to open the Service Detail Panel.
- Expand the Runtime section — it lists all registered methods, properties, and notifications for that service.
If the Runtime section is greyed out or shows "Runtime not available," the process was not built with a Dev profile. Change the build profile, rebuild, and restart the process.
- Click a method name to expand its call form.
- Fill in the typed input fields (string, number, boolean) for each parameter.
- Click Call.
- The return value appears inline beneath the call form. If the call fails, the error message is shown instead.
Each call is independent — you can call the same method multiple times with different arguments.
| Action | Description |
|---|---|
| Read | Polls the current value of the property once and displays it next to the property name. |
| Watch | Subscribes to live value changes. The displayed value updates automatically whenever the property changes in the running process. Click Unwatch to stop. |
Multiple properties can be watched simultaneously.
Click Subscribe on any notification to start receiving events. Incoming events appear in a live log beneath the notification name, showing:
- Timestamp of the event
- Argument values carried by the notification
Click Unsubscribe to stop receiving events. The log is preserved until the panel is closed or cleared manually.
When you interact with the Runtime Inspector, the extension spawns a short-lived subprocess:
-
gRPC transport: spawns
grpcurland calls theserp.Runtime1gRPC service that the process exposes on port50060. -
DBus transport: uses
gdbus callto invoke theserp.Runtime1DBus interface registered on the session bus.
Both transports use the same logical interface. The choice of transport is determined by the active Build Profile.
The runtime debug backend is compiled into the process only when the project is built with the SERP_BUILD_RUNTIME_GRPC=ON or corresponding DBus flag set by the build script. See Build Profiles for details.
| Symptom | Likely cause | Fix |
|---|---|---|
| Runtime section is greyed out | Process built with Auto or Release profile |
Switch to Dev (gRPC) or Dev (DBus), rebuild, restart |
grpcurl: command not found |
grpcurl not installed | brew install grpcurl |
| Call returns connection refused | Process is not running, or wrong port | Start the process; verify build profile |
| DBus call fails on macOS | DBus is a Linux transport | Switch to Dev (gRPC) on macOS |
- Build Profiles — Enable the runtime backend and select the transport
- Architecture Dashboard — Navigate to services and open the inspector
-
SERP AI Sessions — AI sessions can also invoke runtime methods via the
serp_runtime_callMCP tool