

|
How to export the image of prediction lines and observations in high resolution? |
Replies: 4 comments 10 replies

|
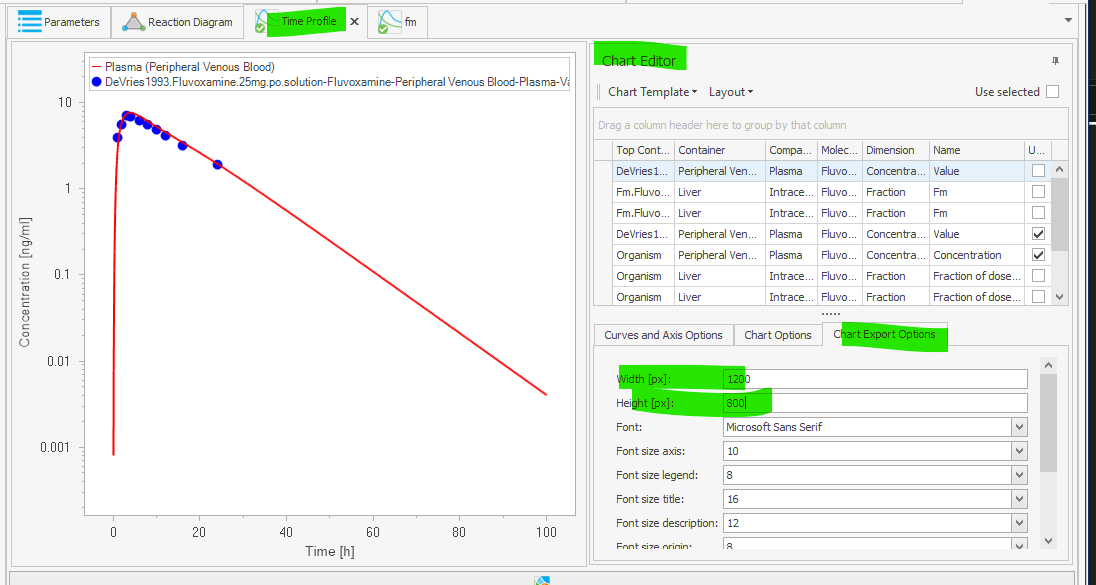
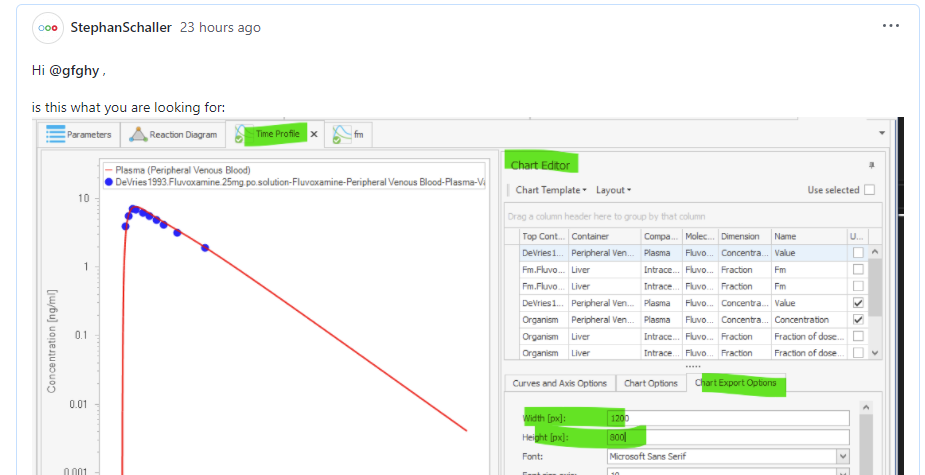
Hi @gfghy , is this what you are looking for: This will export, both simulated curves and observed data point in a figure. |

|
Thank you for your answer. However, I still have several questions: 1. After exporting the data points of the prediction line to Excel, how to make the prediction line fit well with the measured points? 2. How to add confidence intervals? |
|
Hi @gfghy , for this we have parameter identification directly in PK-Sim: https://docs.open-systems-pharmacology.org/shared-tools-and-example-workflows/parameter-identification |
|
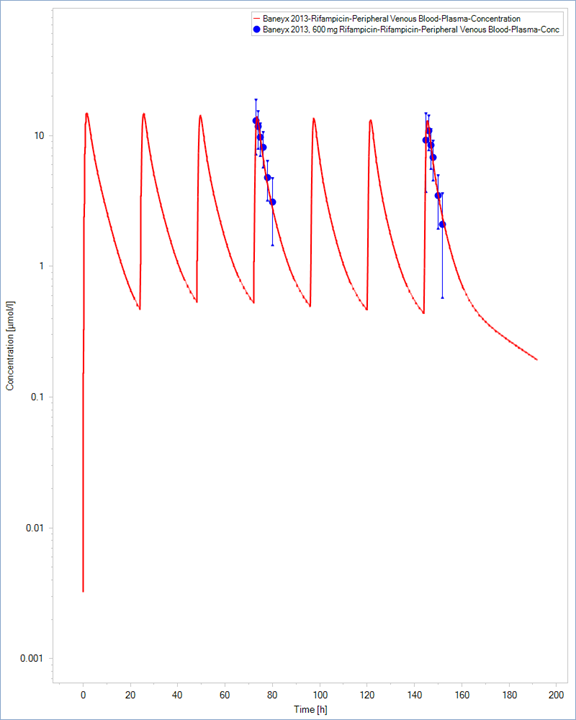
Thank you for your answer again. But i mean that i do not know how to add the confidence intervals after drawing the prediction lines and observations outside the software? And back to the first question, can you tell me how to draw the prediction line and make it fit well with the measured points after export "Time Profile Analysis" to excel? Because the image i export only contain a predicted file like the following figure, i have to use the exported data of predicted file and observed data to make a piture with both of them. But i am not good at it. I really need your help. If you have any other efficient way, please tell me, thank you very much. |

I can't see a figure. Please copy&paste into the chat. Thx |

|
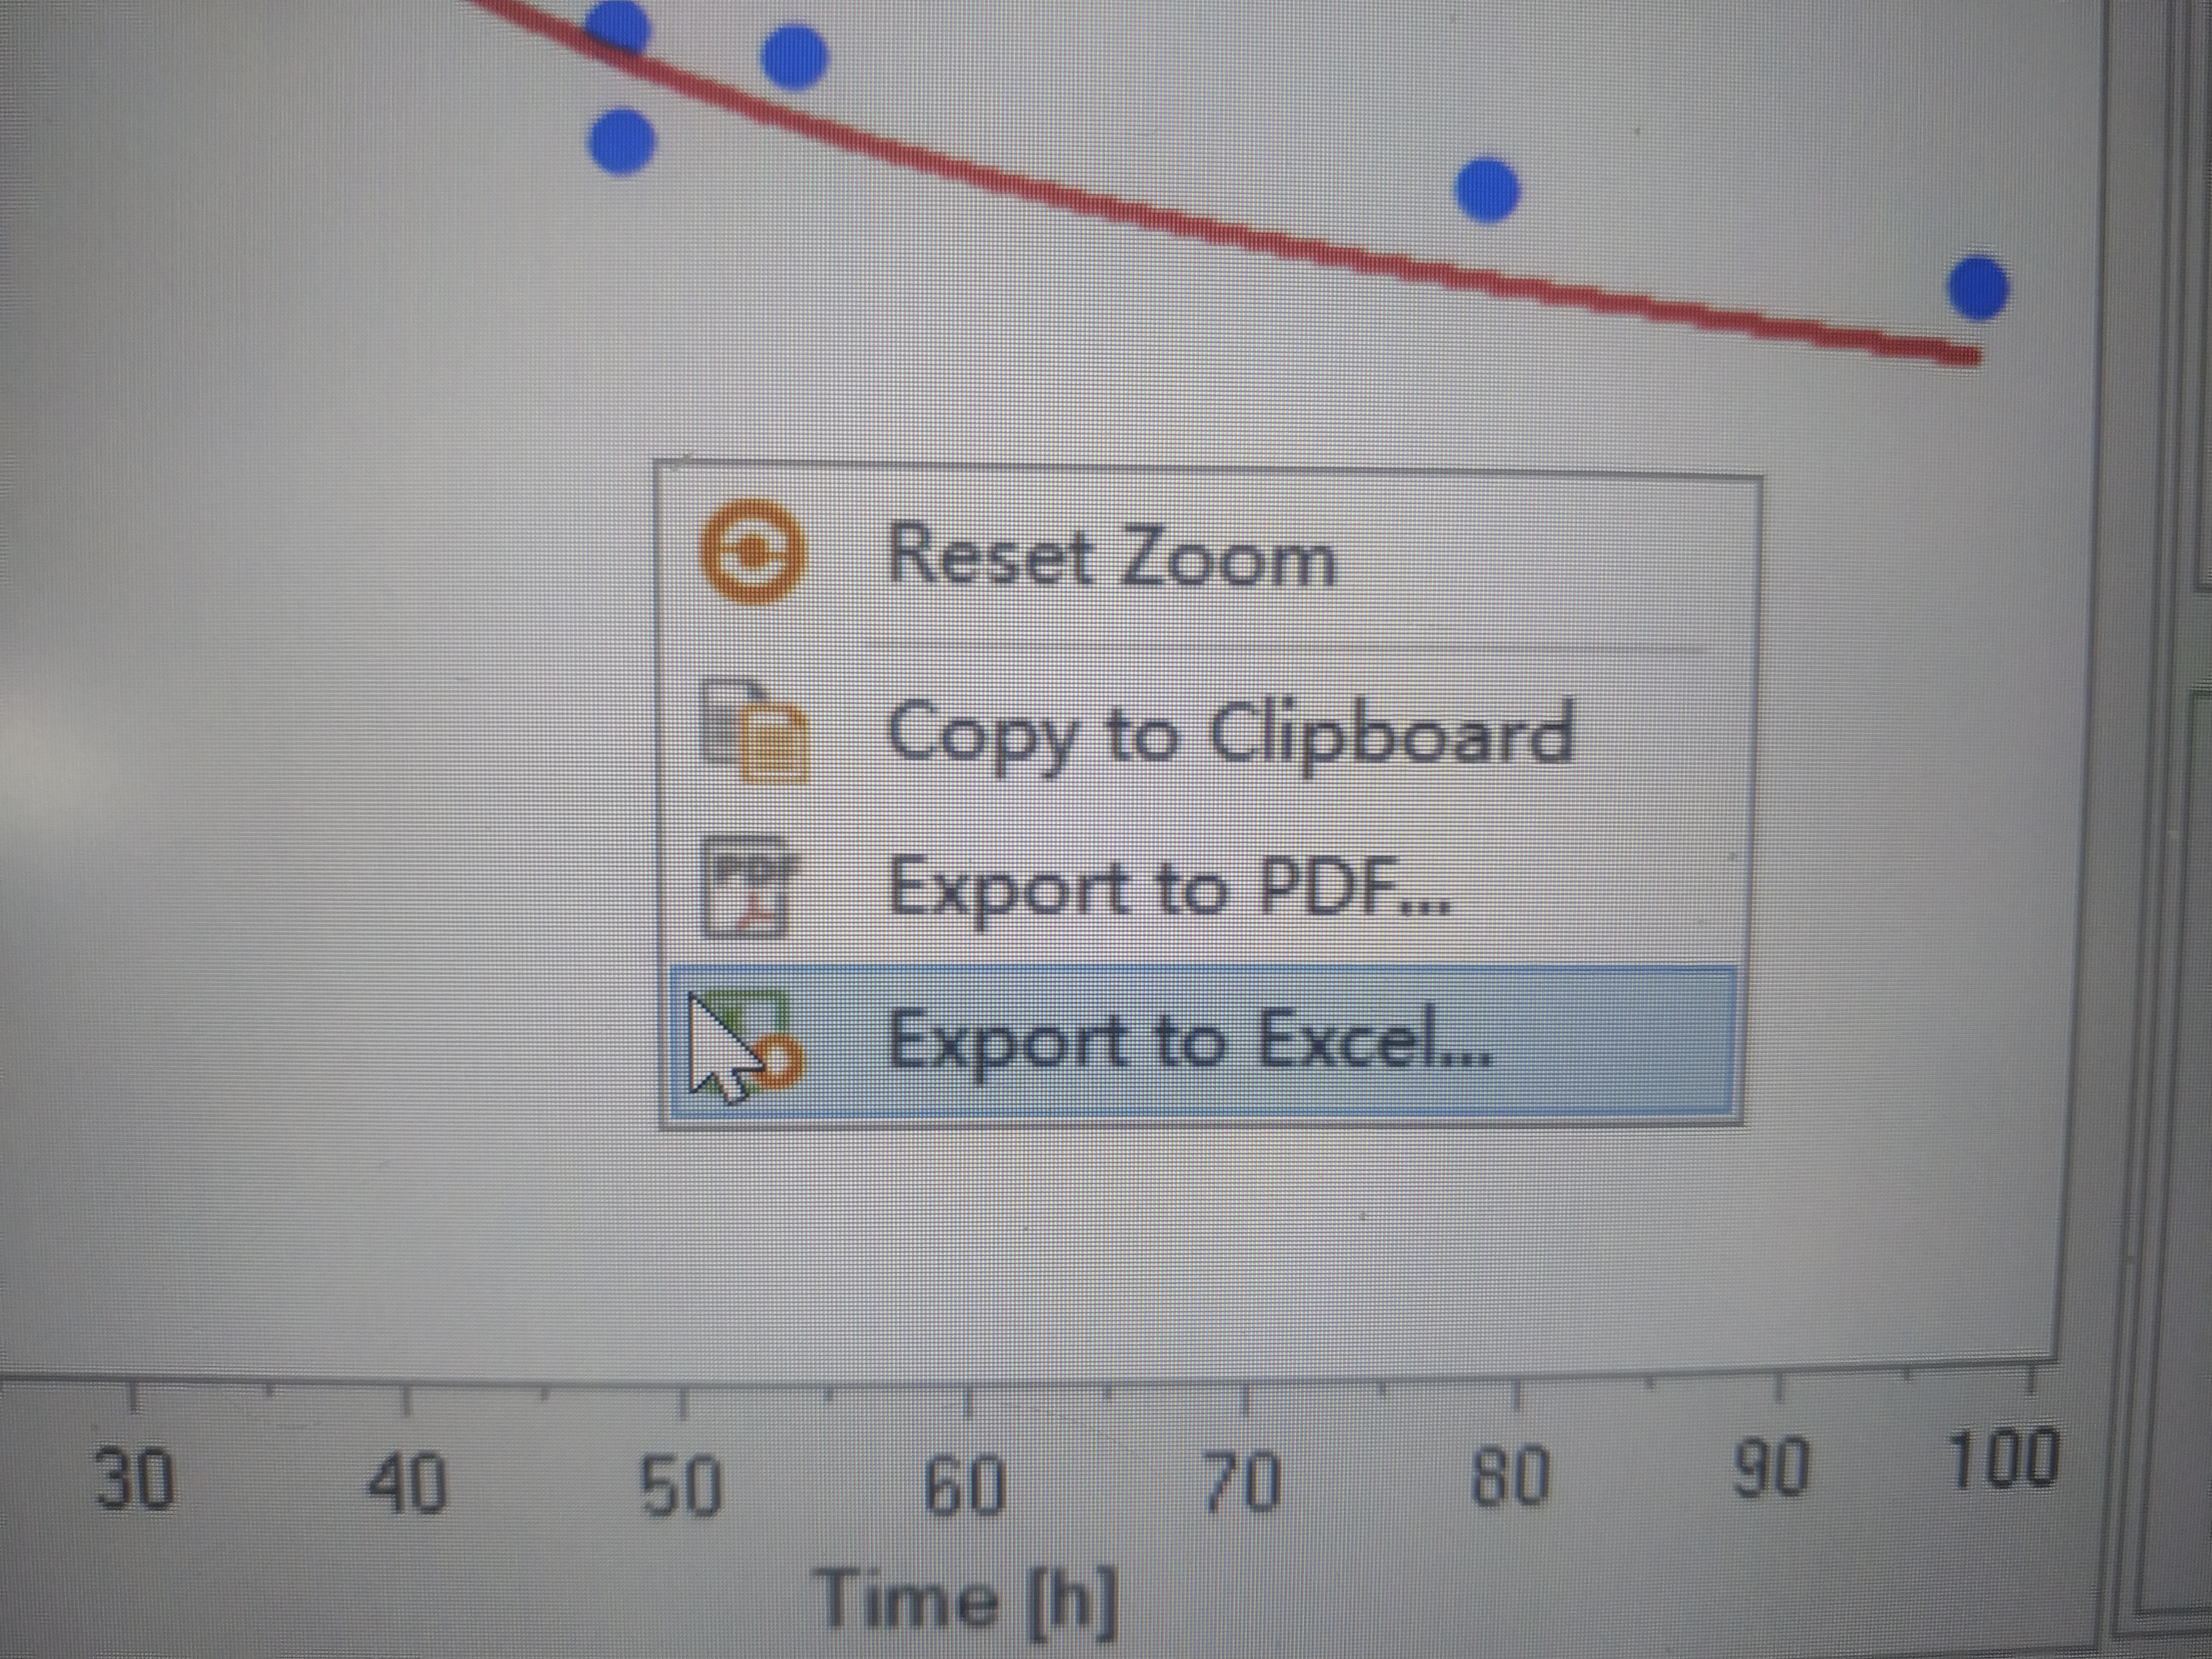
@gfghy As @StephanSchaller suggested: If you want to export the data, use export to excel Once the data is exported to Excel, you can use any plot capabilities from Excel and draw lines, dots etc... But how to do this in Excel is outside of the scope of this Forum. |

|
You have to go into options > remove watermark. Also click on chart options > chart color > white to make it look better. good luck. |
|
Thank you, do I have to use Mobi for this? But the picture exported this way is lack of clarity. And maybe i can know when will the export image function be fixed? Thanks a lot. |

No this works in PKSim as well. And as mentioned above, you can specify the size of the picture to export in the export tab.
Not in the near future. I cannot give you a time frame at the moment |
|
Thanks a lot! But I do hope you can fix it soon, cause it is more efficient. Thank you again, lovely people. |
|
I showed you above, where you can set the resolution for your export figure
|


@gfghy As @StephanSchaller suggested:
If you want to export the graph as is, use Export to clipboard
If you want to export the data, use export to excel
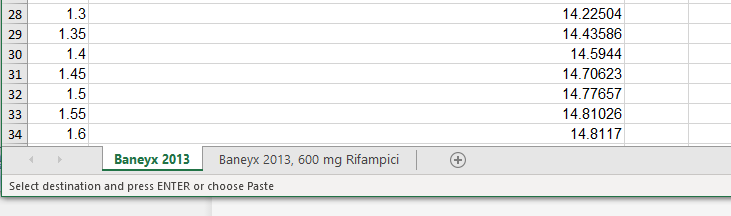
This will export one sheet for the simulated values and one sheet per observed data
Once the data is exported to Excel, you can use any plot capabilities from Excel and draw lines, dots etc... But how to do this in Excel is outside of the scope of this Forum.