Repository navigation
Memory
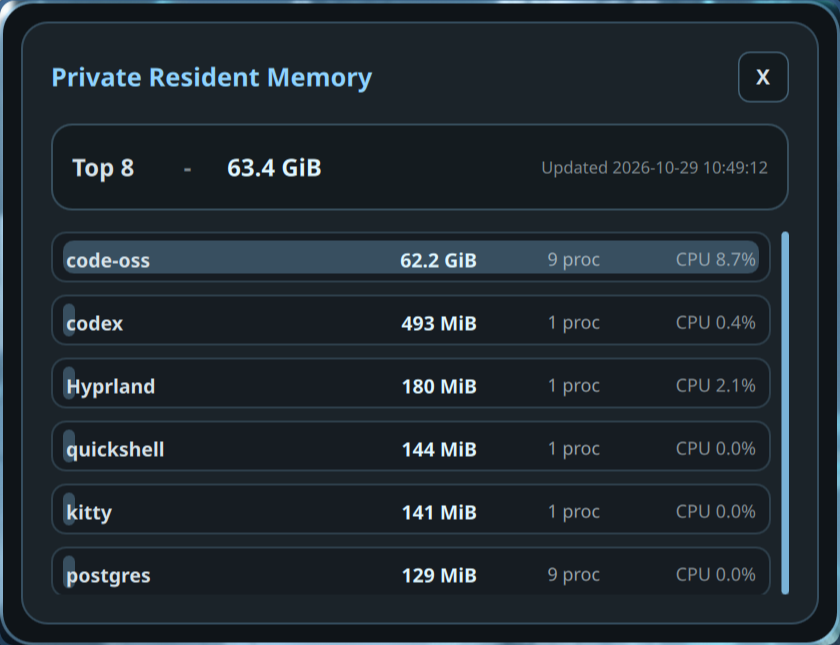
The Memory window answers a narrower question than a conventional process list: which executable groups own the most private resident memory right now?
- Click the memory module on Waybar.
- Or run
sh ~/.config/bsdrunner/scripts/bsdrunner-memory-window.sh.
The top card identifies how many groups are shown, their combined private resident memory, and the snapshot time. The default view is the top eight executable groups.
Each row contains:
- executable name;
- summed private resident memory;
- number of processes in the group;
- summed CPU percentage;
- a proportional bar relative to the largest group in the snapshot.
The list refreshes every 15 seconds. It is read-only: there are no kill, renice, or signal controls.
Ordinary RSS can count shared mappings in every process that uses them. BSDRunner combines ps process metadata with FreeBSD procstat VM mappings and prefers private-resident data, then groups processes by executable. This makes the ranking more useful for answering “what is uniquely consuming memory?” but it is not the same number shown by every system monitor.
Some VM maps require elevated visibility. The backend tries mdo procstat when available and falls back to ordinary procstat. If detailed mappings cannot be read, the app reports the failure instead of presenting fabricated totals.
Back to the BSDRunner Apps overview.