Cytochrome‐C‐Challenge
Play it: testingthetree.com/phyloviz · self-paced, no time limit
This one isn't a game with an ending — it's a real research tool, opened up for anyone to explore. No simulated data, no made-up scenario.
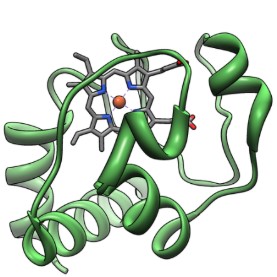
Cytochrome c — a small protein, about 114 amino acids long, found in nearly every plant and animal on Earth. It's essential for cellular respiration and changes very slowly over time, which is exactly why biologists like to compare it across species: slow-changing sequences are what you use to reconstruct deep ancestry.
The tool loads real cytochrome c sequences from 24 real plant species (everything from spinach to hemp to wheat, with ginkgo used as the outgroup), and lets you build and inspect the resulting tree.
- Pan and zoom the tree freely — drag to move, pinch or scroll to zoom.
- Tap or click any node to see how it connects to its ancestors and descendants, highlighted in the tree.
- Tap a species' sequence to open the full amino-acid sequence in a panel.
- Switch between candidate trees. This is the important part — the data actually supports 250 different possible trees, not just one. The selector at the top lets you flip through them and watch which branches move.
- Turn on branch lengths, sequence details, and the color legend from the menu (☰) if you want more detail on screen — or open the intro walkthrough again any time from the ? button.
A single "tree of life" diagram makes evolution look like a settled, singular fact. In reality, building a tree from real data almost always leaves you with several trees that fit the data roughly equally well — and picking one over another comes down to assumptions about how to weigh conflicting evidence, not just reading an answer straight off the sequences.
That's not a flaw in this particular dataset. It's normal. This tool is here so you can see it happen with your own eyes instead of taking it on faith.
Say you have four species — A, B, and C, D — and the same underlying data can be read two ways:

Both trees use identical data. The only thing that changed is one assumption about how to weigh an uncertain grouping — and that was enough to move where B sits. The real tool has this same kind of uncertainty, just spread across 24 species and 250 candidate trees instead of 4 and 2.
⬅ Back to Home · Next up: Xenobiology Classification Lab