Repository navigation
Dashboard Diagnostics
The sap-bridge Web Dashboard includes local diagnostics and a flight recorder to help you monitor the traffic flowing between the AI agent, the bridge, and the SAP backend.
The MCP Logs view allows you to inspect the live JSON-RPC stream between the AI agent and the bridge. This is useful for troubleshooting tool execution and payload issues.
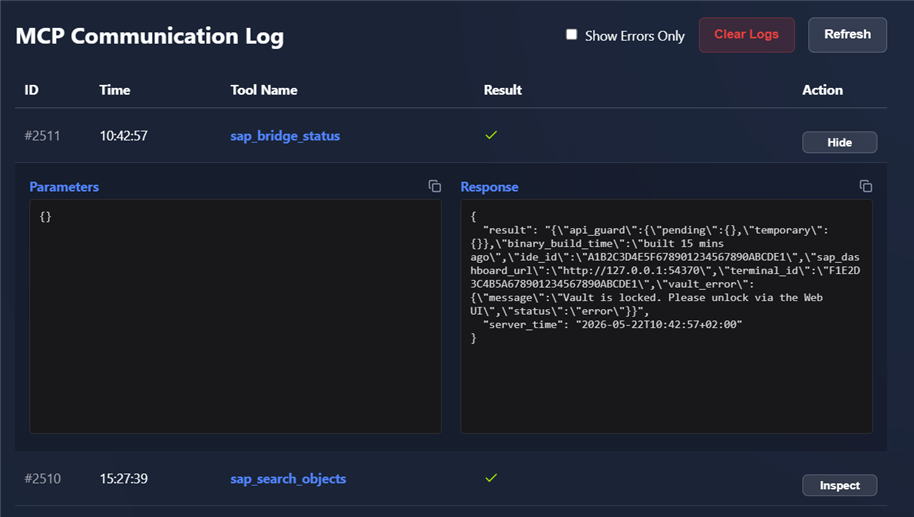
The Flight Recorder tracks and displays the raw XML and HTTP requests sent between the bridge and the SAP backend. You can use this to debug connectivity issues or inspect exactly what the bridge is sending to SAP.
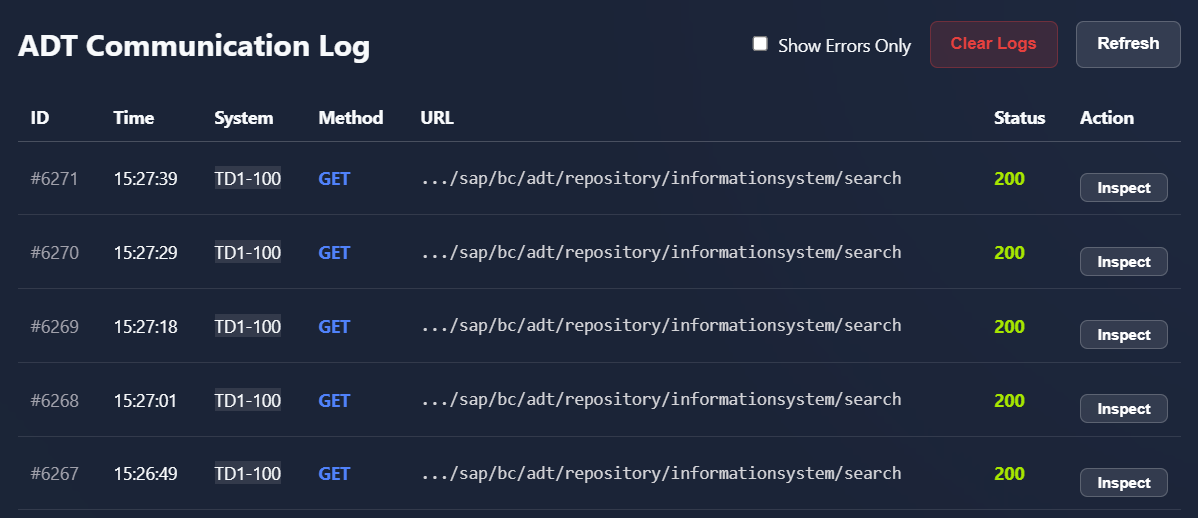
The Dashboard Diagnostics view groups daemon, MCP, and ADT activity for the selected workspace. Use its technical status and error fields to narrow an investigation. sap_bridge_status(view: "diagnostics") provides a compact tool response with guard approvals and telemetry.
For a focused audit, query local logs with sap_execute_local_sqlite. Use sap_export_diagnostics to create a sanitized JSON or Markdown copy for sharing with a developer or attaching to a tooling report. Inspect that exported copy before sharing it.