Alerts and Incidents
Osprey monitors the network and fires alerts when conditions are met. Access via the Alerts menu in the menu bar.
One system alert rule is seeded by default:
- SNMP Target Failure: Auto-disables targets after 10 consecutive poll failures (configurable via Admin > System Settings > SNMP > Polling > Consecutive Failure Limit).
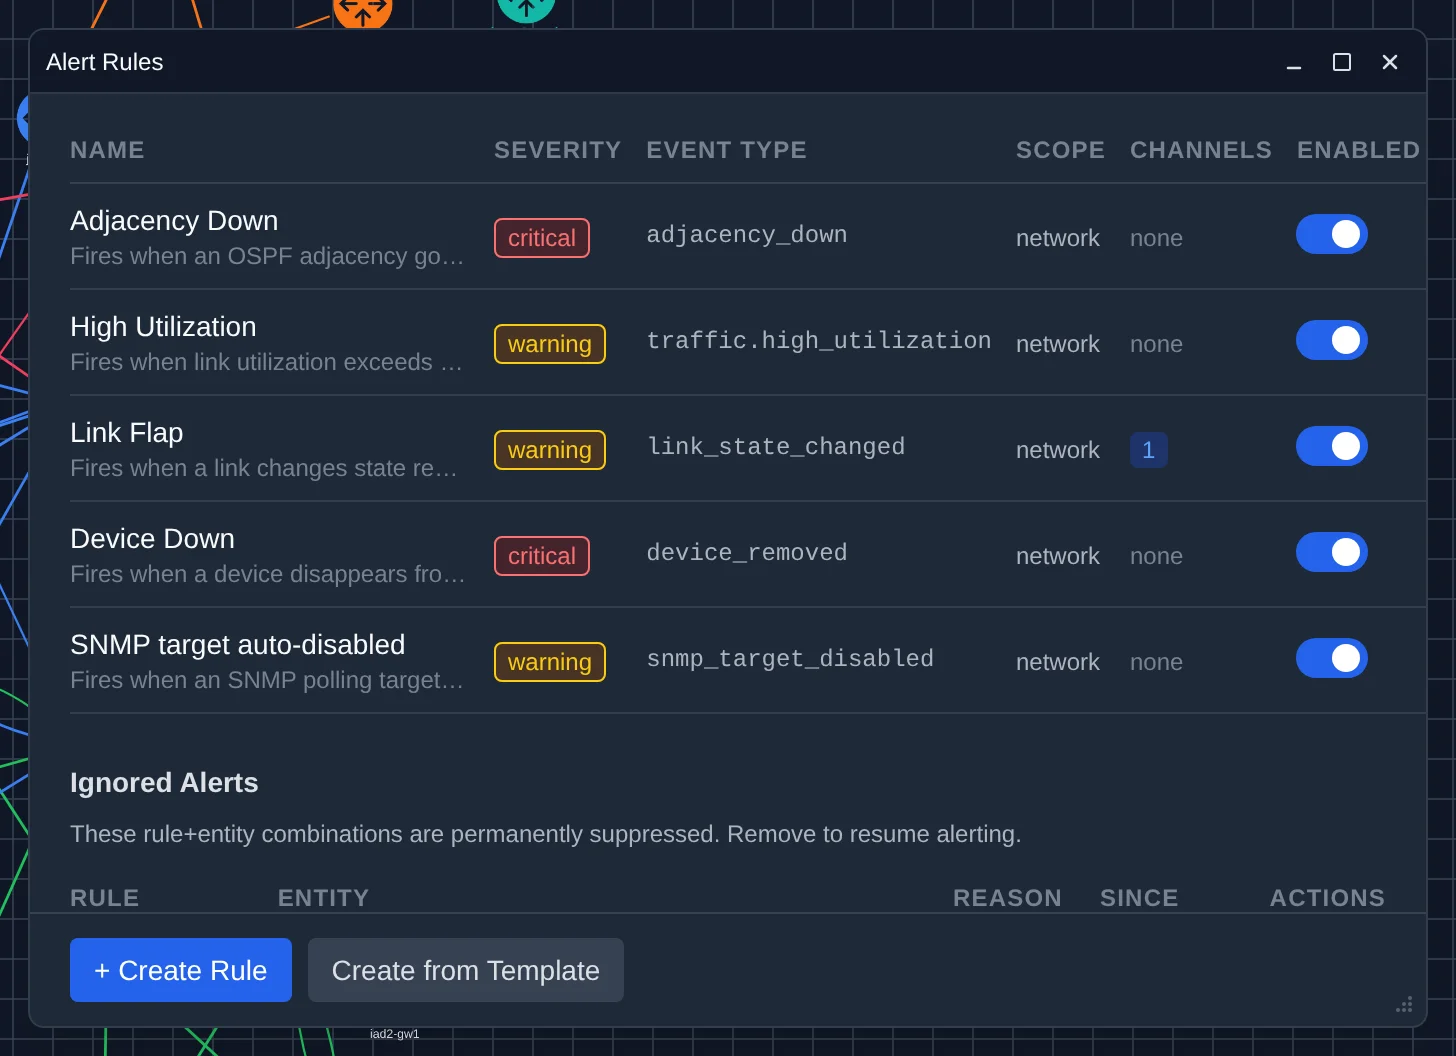
Create additional alert rules under Admin > Monitoring > Alert Rules. The Alert Rule Manager provides templates for common rules (congestion warning/critical thresholds, interface error rate) that you can add with one click. You can also create custom rules from scratch.
The bell icon in the top-right header shows the count of firing alerts (displays "9+" when more than 9 are active). Click the bell to open a dropdown panel showing up to 20 active alerts. Each alert in the dropdown displays:
- A severity-colored indicator dot (red for critical, yellow for warning, blue for info)
- Alert summary text
- Router ID (if applicable) and relative timestamp (e.g., "5m ago")
- An Ack button to acknowledge firing alerts directly from the dropdown
The dropdown closes when you click outside it or press Escape.
Alerts > Active Alerts: Opens the Activity Tray on the Alerts tab, filtered to currently firing alerts (severity badges, acknowledge/resolve actions). If the tray is already open, it switches to this view.
Alerts > Alert History: Opens the Activity Tray on the Alerts tab with the filter set to All, for browsing current and past alerts.
Admin > Monitoring > Notification Channels (admin or engineer): Configure where alerts are sent:
- Webhook: POST JSON to any URL (custom headers supported)
- Email: SMTP delivery (STARTTLS auto-negotiation, implicit TLS on port 465, optional authentication)
- Slack: Incoming webhook with formatted messages (severity emoji, rule name, summary)
- Microsoft Teams: Incoming webhook with MessageCard format (color-coded severity)
- In-App: Delivered via the activity tray (no external configuration needed)
Each channel has a Test button that sends a real test notification to verify delivery. If delivery fails, the specific error is displayed (e.g., SMTP connection refused, HTTP 404).
Osprey's event correlation engine automatically groups related topology events into incidents. For example, if a core router goes down, the subsequent link failures on all its interfaces are grouped into a single incident with the device failure identified as the root cause.
Incidents appear in:
- The Active Incidents card on the dashboard.
- The Activity Tray (bottom-left), mixed with standalone events.
- IncidentCard widgets with severity-colored borders, collapsible child events, and clickable root cause.
Correlation uses a 30-second time window and prioritizes event types: device_down > node_failure > asbr_withdrawal.
OSPF does not signal an area partition (RFC 2328 §3.7): when the links joining two halves of an area fail, each half keeps flooding its own LSDB under the same Area ID, and the backbone quietly routes between the halves as if they were separate areas. Osprey detects this when two or more healthy recorders on one area persistently report device sets with zero overlap, and raises a dedicated incident (area_partition).
The incident names both islands (which recorders see which routers) and classifies what the split means for your network:
| Consequence | Severity | Meaning |
|---|---|---|
| bridged | warning | Every island still has an ABR connected to area 0 — traffic between the halves flows via the backbone. Degraded and suboptimal, but connected. |
| isolated | critical | An island has no ABR with backbone membership — its prefixes are no longer summarized into area 0 and it is cut off from the rest of the AS. The summary names the isolated routers. |
| backbone_partition | critical | Area 0 itself is split: inter-area routing between the halves is broken. Configure virtual links (RFC 2328 §15) or repair the backbone link. |
| unknown | warning | No recorder monitors area 0 for this protocol instance, so isolation cannot be determined. Add an area-0 recorder for full classification. |
Where you see it:
- Sidebar: the area row shows a pulsing SPLIT chip (amber = degraded, red = critical); hover it for the incident summary naming the islands.
- Topology canvas: a warning banner appears at the top when a visible area is partitioned, and every link gets a colored halo per island — each island is tinted by the recorder that still sees it, so the split is visible at a glance. Both islands stay on the map (each recorder's data coexists; a link's reporting recorder is also shown in its detail panel).
- Activity tray: the incident appears with a "partition" badge. Expand it to see the consequence, each island's recorders and routers (click a router to highlight it on the canvas — the island dots match the canvas halo colors), and once healed, why it resolved.
How to act on one: treat the partition itself as the fault — find and repair the failed intra-area link(s) between the islands. The incident resolves automatically once the recorders' views overlap again, clearing the chip, banner, and halos. It is not resolved by silence: recorders that simply stop publishing (or an engine restart) leave the incident standing until there is positive evidence the area healed — or until you disable/delete one of the recorders, which resolves it as "no longer observable".
False-positive guards: detection requires at least two healthy recorders on the area (health = enabled, running, and recent data — a recorder that publishes nothing because its topology is unchanged still counts as healthy), each island stable for 5 minutes with at least 2 devices, and the split confirmed across 3 consecutive evaluations. A freshly added recorder that is still mid-crawl therefore never triggers one. IS-IS levels are not yet evaluated for partitions. Partition badges reflect the live network only — in Time Travel they are hidden (there is no historical reconstruction of partition state).
Admin > Monitoring > Maintenance Windows
Schedule maintenance periods to suppress alerts:
- Click Create Window.
- Set the start and end time.
- Choose the scope: global, specific network, routing domain, protocol instance, area, or device.
- Add a description.
During an active maintenance window, matching alerts are suppressed. The window appears with status indicators: scheduled, active, or expired.