Device and Link Inspection
Hover over a device or a link on the canvas for a compact at-a-glance card (no click needed). After a brief delay the tooltip shows:
- Node: name + health dot + role badge (ABR/ASBR/Collector), the other identifier (router ID / system ID) and vendor/platform, area memberships, link count (with how many are down), and device type.
- Single link: endpoints and interface pair, protocol and area, cost (forward/reverse when asymmetric), link type and speed.
- Multi-protocol (merged) link: one aligned row per protocol with its area, cost, and up/down state.
The tooltip is instant (built from data already on the canvas — no server round-trip) and is a quick complement to the full Node Detail Panel / Link Detail Panel you get by clicking.
Click any device on the canvas to open the Node Detail Panel -- a floating, draggable, resizable panel managed by the Panel Manager. It appears over the canvas and can be repositioned, minimized to the pill bar, or resized via dual-edge handles (see Panel Management below).
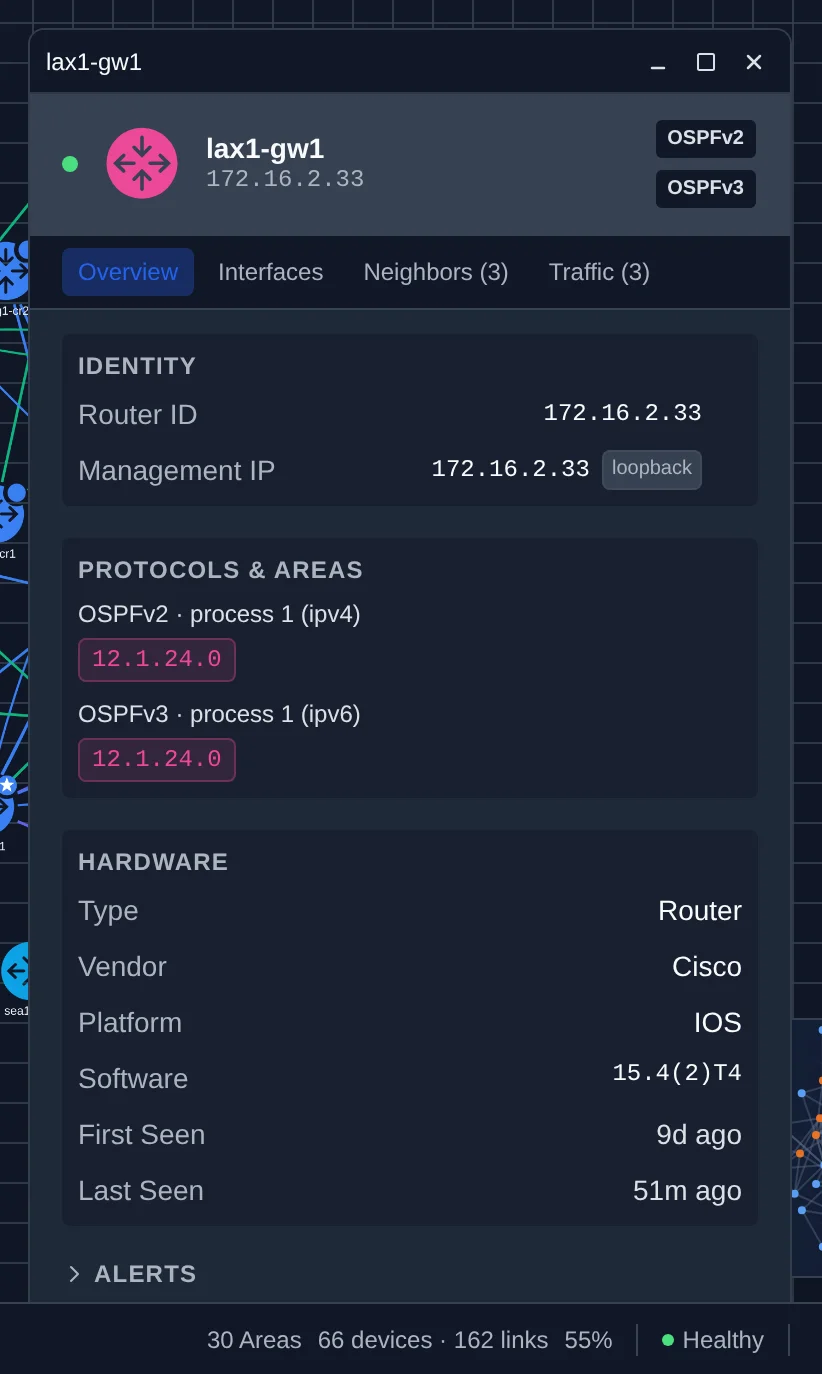
Header (PanelChrome): Shows the device icon (colored to match the device's area color from the canvas) and the resolved display name as the primary label. For OSPF devices, the router ID is the secondary label (if different from the display name). For IS-IS devices, the system ID (XXXX.XXXX.XXXX format) is the secondary label, with the router ID demoted. The DNS name appears as a tertiary label if available and different from both. The title bar provides minimize and close buttons. Close with the X button, press Escape to minimize, or Shift+Escape to close.
Critical state banner: When all links on a device are down (isolated node), a red "CRITICAL -- Device Down" banner appears below the header. This is derived from live topology state, not from alert rules, and also works during time-travel playback.
Device Info section:
- Device Type, Vendor, Model, Platform, Software Version
- Role badges (ABR, ASBR, L1/L2, Collector) displayed as colored tags. IS-IS L1/L2 routers show the same badge style as OSPF ABRs.
- For IS-IS devices: System ID (XXXX.XXXX.XXXX format) shown below the router ID. Overload (OL) bit displayed as an amber "Overload" badge when set.
- Area memberships shown as monospace tags
- First Seen / Last Seen with relative timestamps (hover for full UTC timestamp)
Alerts section (collapsible):
- Shows non-resolved alerts (firing + acknowledged) for this device, up to 25
- Each alert displays a severity-colored dot, summary text, and relative timestamp
- Collapsed by default if there are no active alerts
Neighbors section:
- List of directly connected IGP neighbors (OSPF or IS-IS), sorted by router ID
- Each neighbor row shows: state indicator (green/red dot), router ID, link type (IS-IS shows "Broadcast" instead of "transit"), and cost (single value for symmetric, directional arrows for asymmetric)
- For IS-IS: neighbors visible in both L1 and L2 are merged into a single entry with level badges (L1/L2) instead of appearing twice
- If the neighbor has a hostname different from its router ID, it appears as a secondary line
- Click any neighbor to navigate to its Node Detail Panel
Interfaces section (Interfaces tab):
- Per-interface list of the device's interfaces (loopbacks first), each showing the interface name and its addresses
- Dual-stack interfaces display both the IPv4 and IPv6 address; IS-IS interfaces include their IPv6 address alongside IPv4
- The same tab also lists discovered Layer 2 (LLDP/CDP) neighbors
Traffic section (when SNMP is configured):
- Collapsible via a toggle in the section header
- Aggregate summary line: active/total interfaces, max utilization, total in/out rates
- Per-interface table sorted by highest utilization first, showing: interface name, in rate, out rate, utilization bar with percentage, and error count badge if non-zero
- Hover over the interface name to see the interface speed
- Automatically activates 5-second SNMP boost polling while the panel is open (with a 30-second heartbeat). The panel polls for updated traffic data every 10 seconds.
- Click any interface row to expand an inline utilization history chart (SVG area chart) with a period selector (24h, 7d, 30d). The chart is color-coded from green (low) through yellow and orange to red (high utilization), with an 80% threshold line and average utilization marker.
Recent Events section (collapsible, at the bottom):
- Last 10 topology events for this device, fetched from the API on panel open
- Each event shows a color-coded type badge (green for added/up, red for removed/down, yellow for changed), the entity type, and a relative timestamp
Quick action buttons (pinned at the bottom of the panel):
- SSH: Open an SSH terminal session to this device
- Route Src: Set this device as the SPF path source
- Route Dst: Set this device as the SPF path destination
Note: Additional actions (Show events, Show routing table, Show neighbors) are available via the right-click context menu, not from the panel footer.
Click any link on the canvas to open the Link Detail Panel -- a floating, draggable, resizable panel managed by the Panel Manager (same behavior as the Node Detail Panel).
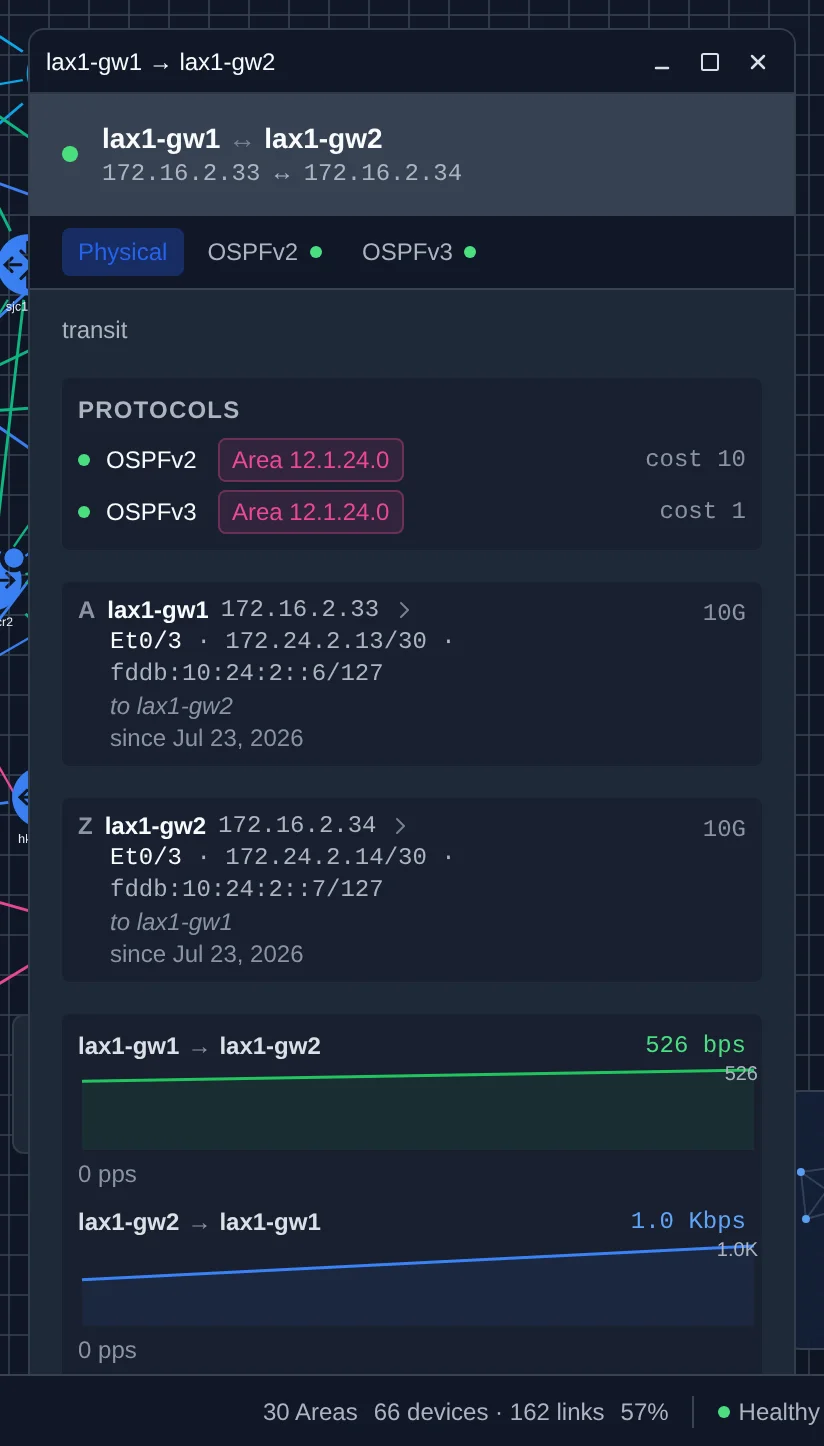
Header (drag handle): Shows the link state (green/red dot), source and target hostnames connected by an arrow, and router IDs beneath if hostnames are available. Drag the header bar to reposition the panel anywhere on screen.
Critical state banner: When the link state is down, a red "CRITICAL -- Link Down" banner appears below the header. This is derived from live topology state, not from alert rules, and also works during time-travel playback.
Link metrics: Link type (P2P, broadcast, etc.) and IGP cost (OSPF cost or IS-IS metric). Asymmetric costs are displayed with both forward and reverse values plus an "asym" warning badge.
Multi-protocol tabs (merged edges only): When a link carries multiple protocols (e.g., OSPFv2 + OSPFv3 + IS-IS on the same wire), a tab bar appears below the header with a Physical tab and one tab per protocol. Each protocol tab shows a state dot (green/red). Single-protocol links display the standard layout without tabs.
- Physical tab (default): Protocol comparison table showing each protocol's area, cost, and state. Endpoint identities (A/Z with hostname and router ID). Shared physical metadata: DNS, MTU, first seen.
- Per-protocol tabs (e.g., "OSPFv2", "IS-IS"): Protocol-specific addressing (dual-stack IPv4/IPv6 for OSPF; IPv4/IPv6 plus the system ID for IS-IS), cost, link type, and auth type. Timer mismatches are shown as inline warnings only when the two sides disagree — no timer section when everything matches. Detail is lazy-loaded per tab.
Endpoints (A/Z) (single-protocol links): Each endpoint is displayed in a compact card showing:
- Endpoint label (A or Z), device hostname (clickable -- navigates to the Node Detail Panel), and router ID
- Interface name, IP address with CIDR mask, and interface alias/description if available
- Interface speed displayed on the right
IGP Timers (single-protocol links): A side-by-side comparison table of timer settings for both endpoints. For OSPF: Hello Interval, Dead Interval, Auth Type, Network Type, Cost, and Speed. For IS-IS: Hello Interval, Hold Time, Metric, Circuit Type, and Speed. Mismatches are highlighted in amber with a warning icon. Requires the SNMP poller to have walked the OSPF-MIB or ISIS-MIB interface table.
Traffic section (when SNMP is configured):
- Bidirectional display: A-to-Z direction (source device's outbound) and Z-to-A direction (target device's outbound)
- Each direction shows: device names with a directional arrow, real-time rate in bps, a sparkline chart with historical data points, and PPS count
- Combined utilization bar showing the maximum utilization of both endpoints
- Traffic data is updated via REST polling and WebSocket push, with automatic 5-second SNMP boost while the panel is open
- Utilization History: A period-selectable chart (24h, 7d, 30d) showing utilization trends for both endpoints. Color-coded area chart with threshold and average markers.
Errors section (shown only when errors or discards are detected):
- Per-endpoint error and discard counters: In Errors, Out Errors (with rate per second), In Discards, Out Discards
- Highlighted with a red background and border for visibility
Alerts section (collapsible, lazy-loaded):
- Shows non-resolved alerts (firing + acknowledged) for the link's endpoint devices, up to 25
- Click to expand; alerts are fetched on first expansion only
Events section (collapsible, lazy-loaded):
- Click to expand. Events are fetched from the API on first expansion only.
- Shows up to 10 recent events for both endpoint devices, deduplicated and sorted by time
Quick action buttons (pinned at the bottom):
- Inspect [source name]: Open the source device's Node Detail Panel
- Inspect [target name]: Open the target device's Node Detail Panel
Resize: Drag any edge or corner handle to resize the panel. Minimum size is 360x360 pixels; default is 504x624 pixels.
Close with the X button or press Shift+Escape. Press Escape to minimize to the pill bar.
Osprey uses a desktop-style Panel Manager in place of a mutually-exclusive drawer/modal pattern. All detail views, reports, tools, and terminals now open as floating managed panels that can coexist on screen simultaneously.
Key behaviors:
- Multiple panels: Up to 4 panels can be open at once. Opening a 5th panel automatically minimizes the least-recently-used panel to make room. Up to 16 total panels (open + minimized) are tracked; exceeding this limit auto-closes the oldest minimized panel.
- PanelChrome: Every managed panel has a consistent title bar (PanelChrome) with the panel title, a minimize button, and a close button. Drag the title bar to reposition the panel.
-
Minimize / Restore: Click the minimize button (or press Escape) to collapse a panel to a compact pill in the pill bar at the bottom of the screen. The panel remains mounted with
display: none-- all internal state (scroll position, column configuration, form input) is preserved. Click the pill to restore the panel to its previous position and size. - Resize: Drag any edge or corner of a panel to resize it (dual-edge handles). Each panel type has its own minimum size constraint.
- Z-ordering: Click any panel to bring it to the front. Panels maintain a stacking order; the most recently interacted panel is always on top.
- Cascade positioning: New panels spawn at the right edge of the viewport and cascade leftward with 24px offsets, avoiding overlap with the sidebar and previously opened panels.
Keyboard shortcuts:
| Shortcut | Action |
|---|---|
Escape |
Minimize the focused panel |
Shift+Escape |
Close the focused panel |
Ctrl+Shift+M |
Minimize all open panels (clear the canvas) |
Ctrl+Shift+R |
Restore all minimized panels |
What is managed: All 26 report/list/tool views (Routers, Links, Interfaces, Prefixes, LSDB Browser, Neighbor Table, BGP Peers, BGP Routes, Health, IP Conflicts, SPF Tree, Congestion Trend, Timer Consistency, MTU Mismatch, Best Practices, etc.), the Node Detail Panel, Link Detail Panel, SSH terminal sessions, Activity panels, Simulation panels, Path Info, Traffic Graphs, and the Icon Library are all managed panels.
Per-interface historical traffic charts provide classic MRTG-style visualization of bandwidth usage over time. Access them from:
- Edge context menu: Right-click a link and select Traffic: <interface-name> -- one menu item appears per endpoint interface.
- Link Detail Panel: Click the Traffic A or Traffic Z buttons in the traffic section.
The chart renders as an inline SVG with the classic MRTG dual-area layout:
- Green area (above baseline): Inbound traffic rate.
- Blue area (mirrored below baseline): Outbound traffic rate.
- Time window selector: Choose from 24h, 7d, or 30d to adjust the visible history.
Below the chart, summary statistics are displayed:
| Metric | Description |
|---|---|
| Max In / Max Out | Peak inbound and outbound rates in the period |
| Avg In / Avg Out | Average inbound and outbound rates |
| Errors | Total in/out error count |
| Utilization | Peak utilization percentage |
Traffic graph data is sourced from the hourly-bucketed utilization_history table, populated by the SNMP poller. Longer time windows (7d, 30d) provide a broader trend view at hourly granularity.
Tip: Traffic graphs require SNMP targets to be configured and the SNMP poller to have collected at least one discovery+counter cycle. If no historical data is available, the chart area displays a "No data" message.
Right-click a device to access a categorized context menu with section headers:
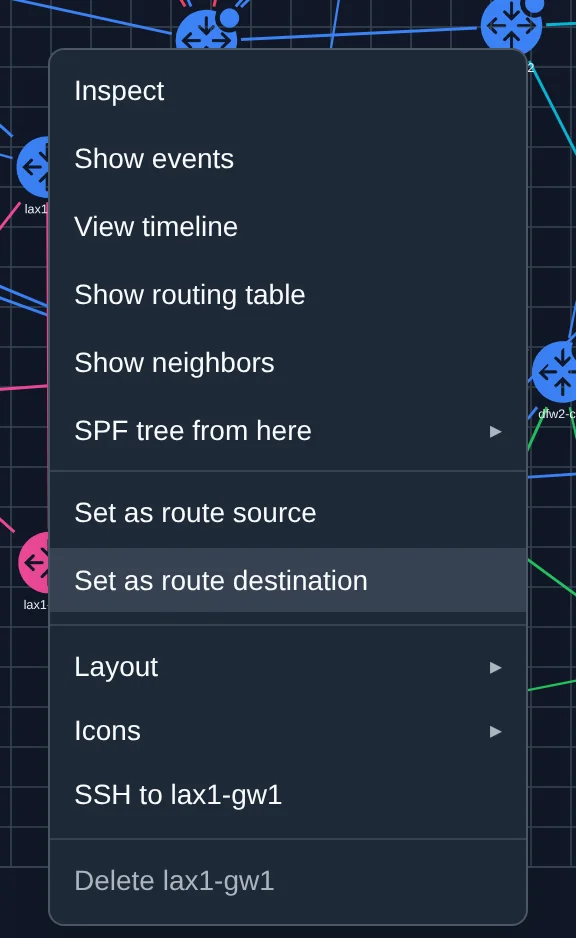
Inspect section:
| Action | Description |
|---|---|
| Inspect | Open the Node Detail Panel |
| Show events | Open Activity Tray filtered to this device |
| Show routing table | Open the IGP routing table viewer for this device (OSPF, IS-IS or EIGRP routes, labelled in each area's own vocabulary) |
| Show neighbors | Open the Neighbor Table panel for this device |
| View timeline | Open chronological event history for this device |
| SPF tree from here | View the Dijkstra shortest-path tree rooted at this device (see SPF Tree) |
Routing section:
| Action | Description |
|---|---|
| Set as route source | Mark as SPF path source (green highlight) |
| Set as route destination | Mark as SPF path destination (red highlight) |
Layout section:
| Action | Description |
|---|---|
| Hide [device name] | Remove from canvas (reversible via Unhide All) |
| Re-layout neighbors | Reapply layout to this device and its direct neighbors using the fCoSE algorithm. If multiple nodes are selected, this becomes "Re-layout N selected" and applies to all selected nodes. |
Icons section:
| Action | Description |
|---|---|
| Change icon... | Override this device's icon from the Icon Library |
| Reset icon | Revert to the default icon for this device type |
Connect section:
| Action | Description |
|---|---|
| SSH to [device name] | Open an SSH terminal session to this device |
Export section (when 1+ nodes selected):
| Action | Description |
|---|---|
| Export N selected > PNG | Export selected nodes and mutual edges as a PNG image |
| Export N selected > SVG | Export selected nodes and mutual edges as a vector SVG |
| Export N selected > Visio | Export selected nodes and mutual edges as a .vsdx file |
Danger zone (below a separator):
| Action | Description |
|---|---|
| Delete [device name] | Permanently remove the device from the topology. Admin only; enabled only when the device is stale or all its connected links are down. Requires confirmation. |
Right-click a link for:
| Action | Description |
|---|---|
| Inspect link | Open the Link Detail Panel |
| Show events | Open Activity Tray filtered to this link |
| View timeline | Open chronological event history for this link |
| Delete link | Permanently remove the link. Admin only; enabled only when the link is down or stale. Requires confirmation. |
To visualize the shortest path between two devices:
- Right-click the source device and select Set as route source (or click the Route Src button in the Node Detail Panel).
- Right-click the destination and select Set as route destination (or click the Route Dst button).
- The path is highlighted on the canvas. A Route Path overlay appears in the top-left corner of the canvas showing:
- Source device (green dot) and destination device (red dot)
- Forward path total cost and hop count (orange)
- Reverse path total cost and hop count (blue)
- An "Asymmetric routing detected" warning if forward and reverse costs differ or actually traverse different routers -- an ECMP tie can split the two directions across equal-cost branches with the same total cost, and the warning catches that case too, not just a cost difference
- A Clear button to remove the path visualization
You can set source and destination independently -- the path is computed automatically once both are set. Both directions are computed separately, so a genuinely asymmetric path shows as one.
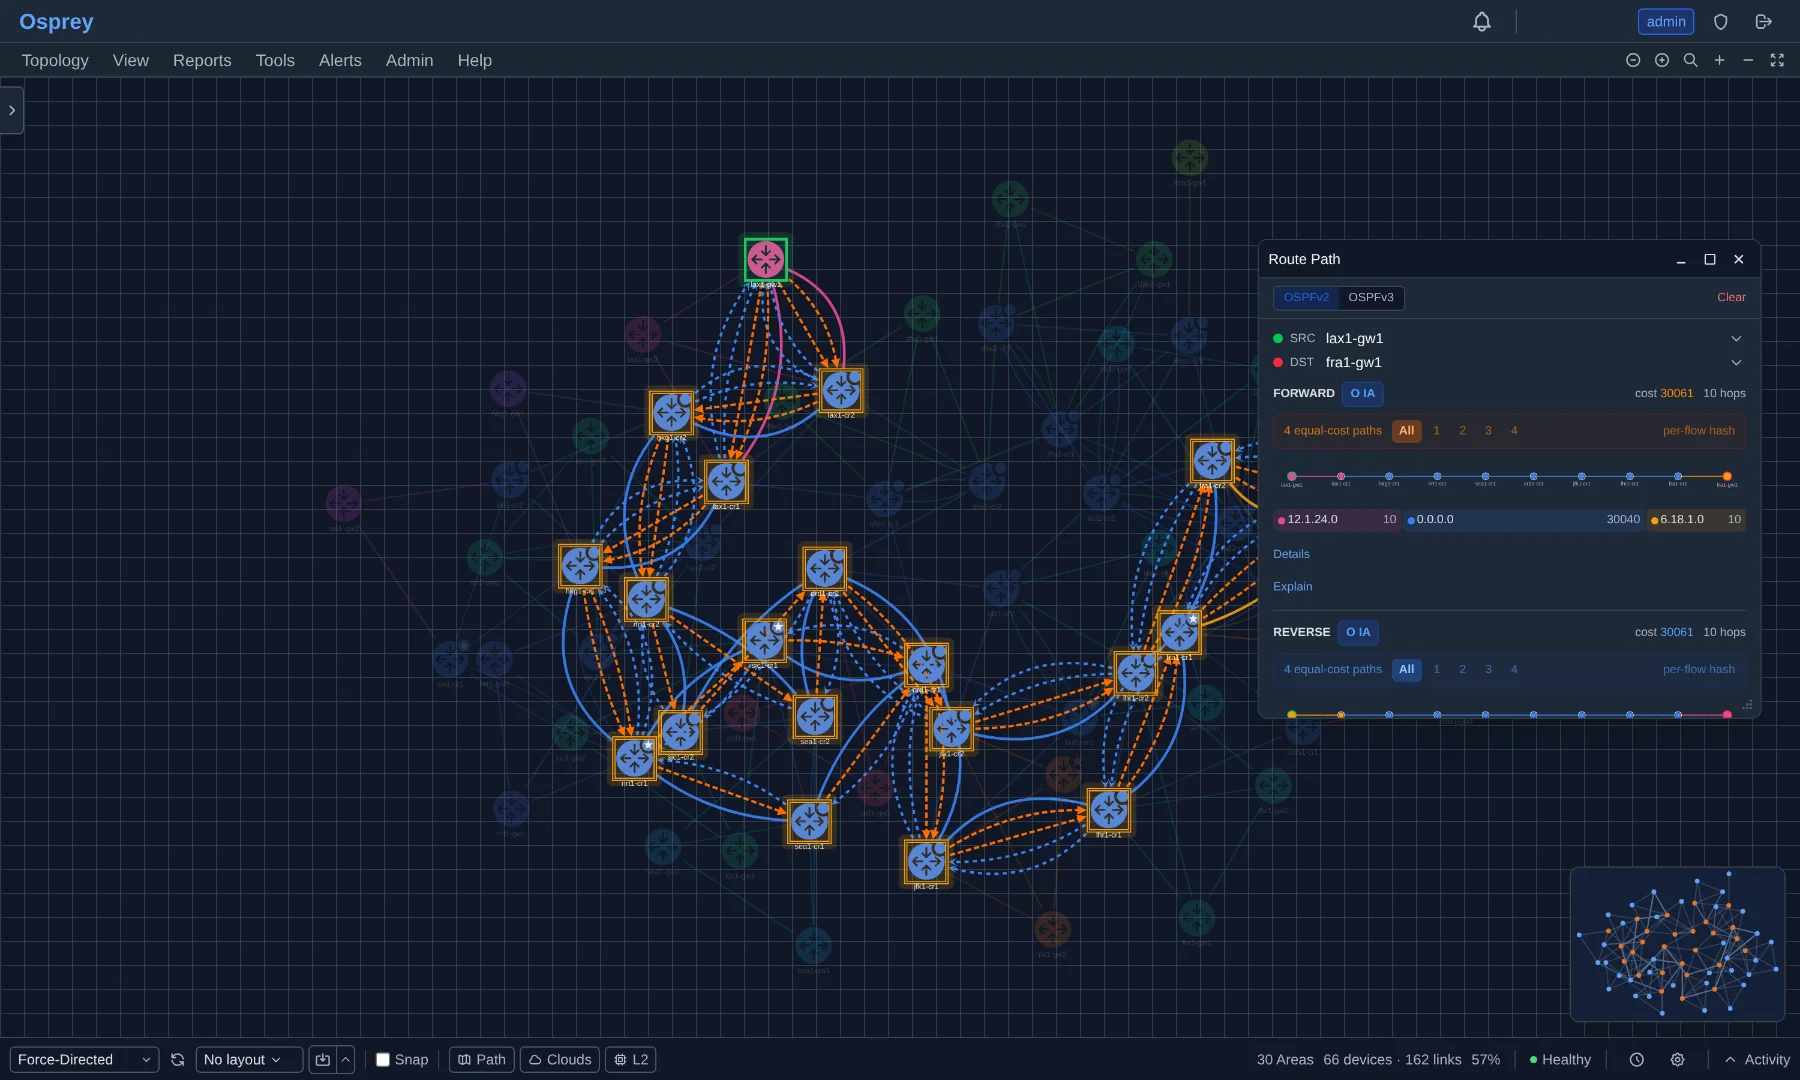
Expanding Details turns the overlay into a hop-by-hop table -- per hop the ingress and egress interface, the route type the router installed, and its own metric -- and Explain adds the reasoning underneath.
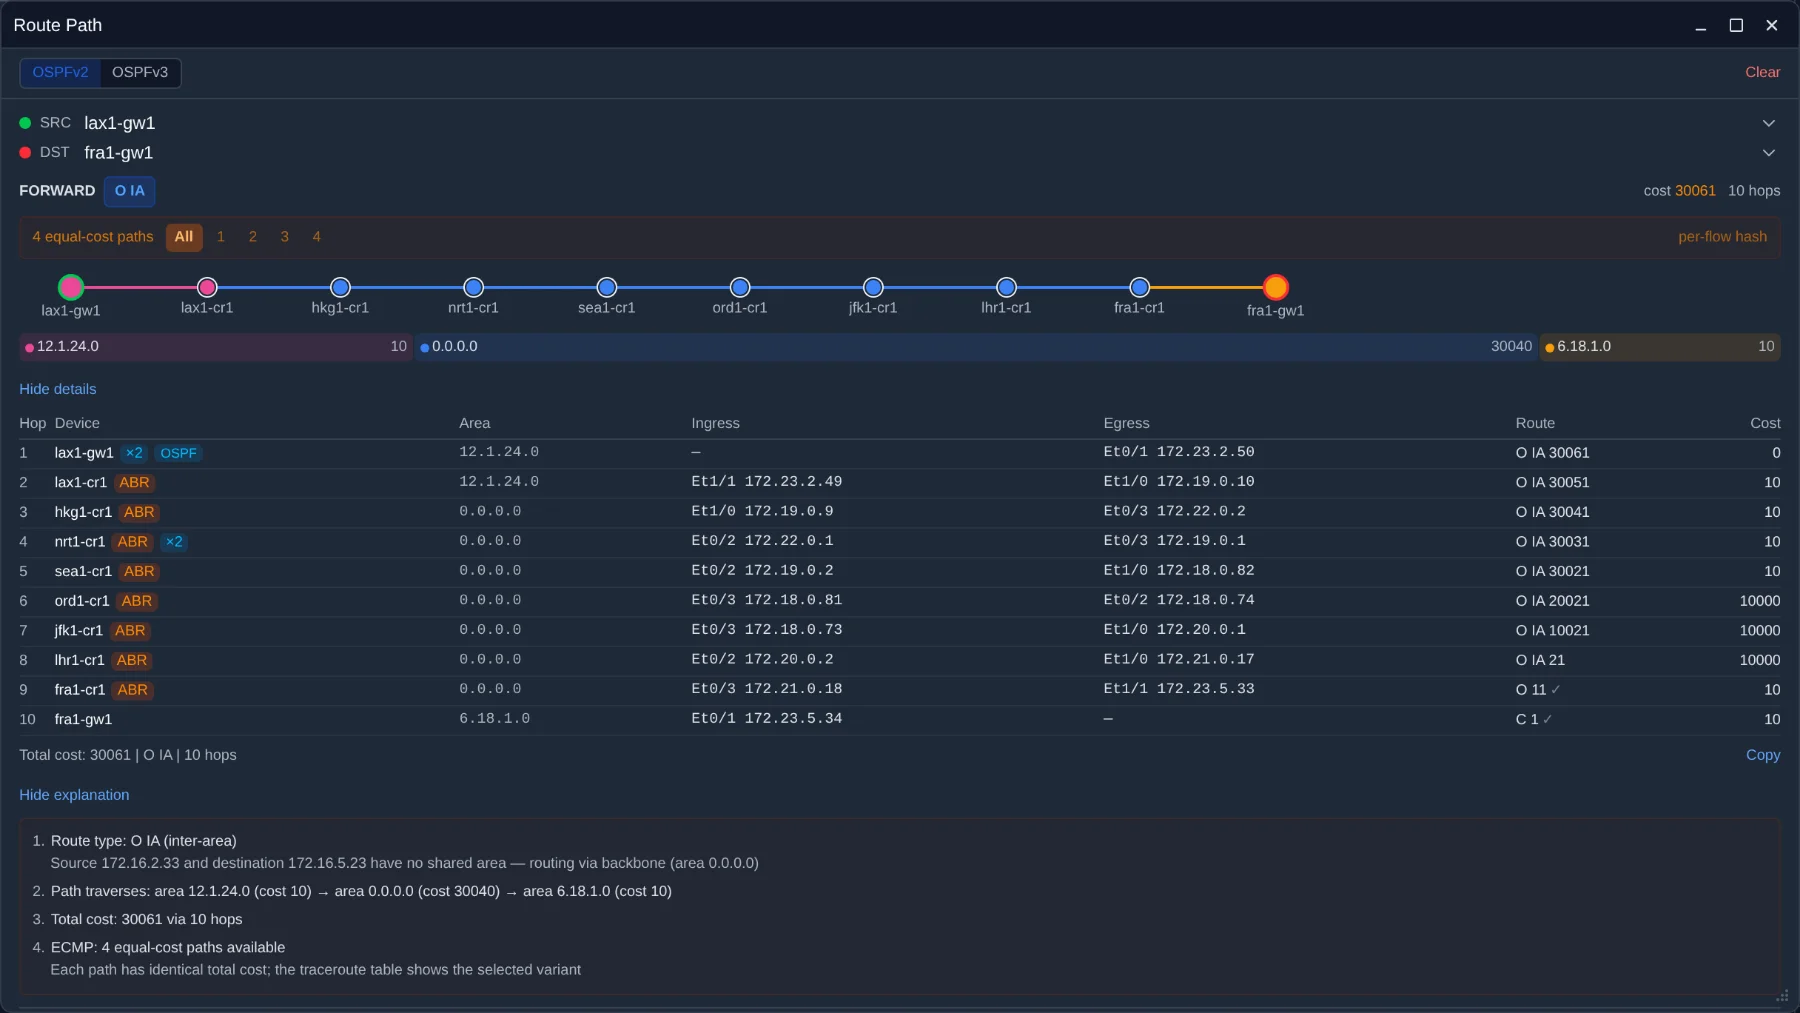
When a direction has more than one equal-cost path, an equal-cost strip appears in the overlay for that direction (orange for forward, blue for reverse): a count ("8 equal-cost paths"), an All button, and one numbered button per path. All — the default — draws every branch at once; clicking a number isolates that single variant on the canvas, and hovering one previews it without committing. The strip is labelled per-flow hash as a reminder of what ECMP means on the wire: which member a real flow rides is decided by each router's per-flow hash, so no single drawn branch is "the" path.
The set is enumerated fully: independent branch points compose (two entry ABRs × two mid-path splits × two far splits = eight distinct paths, not four), duplicates are removed on the device sequence, and for hop-by-hop (OSPFv2 device) paths the branches are the routers' own installed equal-cost next-hop sets rather than SPF ties — the hop table badges such a hop ×N with the size of its installed set. At most 8 variants are shown; when more exist, a caveat states "more than 8 equal-cost paths exist; the first 8 are shown" instead of presenting eight as everything.
For OSPFv2 device-to-device queries, Osprey draws the hop-by-hop forwarding path: at every router along the way it reproduces that router's OWN routing-table decision toward the destination address, exactly as show ip route would report it. This matters because IP forwarding is hop-by-hop, and an intermediate router can legitimately disagree with the source. The classic case is an area border router attached to the backbone: it examines only the backbone's summary-LSAs and prefers its own intra-area route regardless of metric (RFC 2328 §16 step (3) and §16.2 (6)), so a cheap corridor the source priced through a different ABR is one the packet never follows.
Consequences worth knowing when reading the panel:
- The total cost is the source router's own metric -- the number that router reports for the route, including the destination loopback's cost. It is not necessarily the sum of the link costs the packet crosses. When those two differ, the panel shows a caveat naming both numbers: OSPF prices an inter-area route against the advertising border router, which need not be the router the packet reaches, and the gap can be large.
-
Each router's own route is a column. On hop-by-hop paths the hop table (behind Details) carries a Route column: that router's installed route toward the destination — type and metric, the number
show ip routeprints there. A ✓ marks a proven hop (intra-area route in the destination's anchor area — no summary can beat it, RFC 2328 §16.2 (6)); hops without the mark are modelled. - A per-hop metric can go UP. That is not a display error: the Route column flags the rise with ↑ — it is the signature of exactly the inconsistency above, and it is what the routers themselves report.
- An incomplete path is labelled, never dressed up. If the chain cannot be followed to the end (no route at some router, a loop in the modelled data, or a construct Osprey does not model such as a virtual link), the panel says which and why.
- Where the forwarding path cannot be reconstructed, Osprey falls back to the shortest-path view and says so as an explanation step. This applies to OSPFv3 and IS-IS paths, EIGRP (which has its own observed forwarding chain read from the routers' topology tables), and to a canvas selection that holds only part of a protocol instance's areas. The hops shown are then the source's shortest-path tree -- useful, but not a claim about what every router in between would do.
- Simulated paths (Engineering Mode) are always the shortest-path projection, on both the before and the after side, and the response says so. A what-if topology has no routing tables to read: the summaries the surviving border routers would re-advertise cannot be known, and changing only one side of the comparison would make the diff report the model change instead of your mutation.
In networks running both OSPF and IS-IS, the Route Path panel includes a protocol toggle ([OSPF] [IS-IS]). The toggle auto-detects which protocols the source device participates in and disables unavailable options (grayed out with a tooltip explaining why). When you change the source device, the toggle automatically switches to a protocol the device supports. Path computation uses only areas belonging to the selected protocol.
When the selected protocol is IS-IS, the Route Path panel replaces the protocol toggle with an address family selector: [CLNS] [IPv4] [IPv6]. The buttons are dynamic -- each is visible only if the IS-IS instance advertises that protocol capability (TLV 129), and enabled only if actual route data exists in the database for that AF.
- CLNS (default for IS-IS): Displays System IDs and full NET addresses per hop instead of Router IDs and interface IPs. The TracerouteTable uses a CLNS-specific layout: Hop, System ID, Level, Circuit, Cost. The prefix input is hidden (CLNS routing is purely topology-based). When all hops share the same level, the Level column is hidden and a summary line shows the level instead.
- IPv4: Standard traceroute with IPv4 interface addresses, same as OSPF.
- IPv6: Traceroute with IPv6 interface addresses from TLV 236 prefixes.
L1/L2 transition annotations appear at boundary hops when the path crosses between IS-IS levels.
The endpoint selector adapts to the selected AF: in CLNS mode, the interface IP picker is hidden (devices are identified by System ID only). In IPv4/IPv6 mode, the picker shows the relevant address family's interfaces.
When viewing an IS-IS IPv4 or IPv6 path to a specific prefix, and the network has SR-MPLS data (Prefix SID, SRGB from TLV 242), the TracerouteTable shows an additional Label column. Each hop displays the computed MPLS label for that segment:
- Index mode: label = SRGB base + SID index (most common deployment)
- Absolute label: used directly when the V-flag is set on the Prefix SID
The Label column auto-hides when no SR-MPLS data is available for the path. SR-MPLS data is extracted from IS-IS TLV 242 (Router Capability), sub-TLV 3 (Prefix SID on TLV 135/236), and sub-TLV 31 (Adjacency SID on TLV 22).
When no path can be found between two devices, the Route Path panel displays a step-by-step explanation of why the path failed instead of just "No path found". The diagnosis covers:
- Shared area analysis — whether source and destination share any areas
- Backbone reachability — whether both devices can reach the backbone (area 0.0.0.0 or Level 2)
- Entry/exit ABR analysis — which ABRs connect each device's areas to the backbone
- Area membership mismatches — when devices exist in completely separate areas with no inter-area path
When the selected scope spans multiple protocol instances (e.g. two tenants' OSPF processes, or OSPFv2 and OSPFv3 side by side), the diagnosis counts each instance's backbone separately and tags ABRs with their instance — several healthy, unrelated backbones are never summed into one "disconnected" count.
Forward path failures are shown in orange; reverse path failures in blue.
When source and destination live in different routing domains — a different autonomous system, tenant network, or VRF — no IGP path can exist by design, and the panel says so explicitly instead of walking the ABR checklist. A banner shows both endpoints with their AS and tenant badges, and when Osprey's BGP data (BMP) knows a chain between the two ASes, the banner shows it: 65100 → 65000 → 65200 — see the AS-Flow view.
Two devices that share a routing domain but no protocol instance (for example an OSPFv2-only and an OSPFv3-only device) can still be joined through a device that participates in both instances. Such a path is shown with a caveat: it crosses protocol instances via a shared device, which implies redistribution that the LSDBs cannot verify — treat it as a hypothesis, not a routed fact.
When BGP monitoring (BMP) provides enough evidence, a cross-domain query goes one step further: Osprey stitches the actual dataplane path — the IGP segments inside each domain, joined by the eBGP hops between them — and shows it with a MULTI-DOMAIN badge. Each domain renders as a segment with its own IGP cost (costs are never summed across domains: different metric spaces) and a confidence chip:
- resolved — a BGP RIB entry confirms the border router and its next-hop into the next domain.
- inferred — only an established eBGP session points toward the next AS; the exact RIB decision is not visible.
- opaque — no usable evidence inside that domain: it renders as a cloud with a note (e.g. "exit toward AS 65200 unknown — no session data") instead of guessed hops.
A segment whose routers head-end an active MPLS-TE tunnel is additionally annotated "IGP shortest path; TE steering may differ" — the real dataplane may follow the tunnel instead (this TE annotation is live-only; tunnel state is not historized). Stitched paths also work in time travel: at a selected time the chain is rebuilt from recorded eBGP session and RIB history, with the same MULTI-DOMAIN badge and confidence chips. Evidence that is not historized is named in the explanation rather than guessed — router-id-resolved entries, live L2/port annotation, SNMP-discovered sessions, and periods with no recorded session at that time.
The eBGP transition between two domains also carries its physical detail when LLDP/CDP proves it: the explanation step names the ports on both borders (e.g. "wn-edge Et1/0 → nn-edge Et1/0 (snmp-peer+l2)"). Where the evidence is not conclusive, Osprey states the ambiguity rather than guessing — parallel cables list every pair ("3 parallel L2 links: … (session link undetermined)"), a shared switch between both borders is reported as fabric presence with its attachment ports ("shared L2 fabric: ix-sw (…)"), and a border pair with both a direct cable and a shared switch says "L2 ambiguous" and picks neither. When the devices' own IP-MIB binds both session addresses to ports, the claim becomes exact ("…; ip-bound", or "ip-bound, transits ix-sw"); a proven fabric transit is drawn as a real hop over the switch on the canvas, while merely-possible bridges are marked but never path-styled. If a route server holds the deciding route, the step reads "… via route server ix-rs (bmp-rib-rs; dataplane may transit the RS)". L2 evidence older than 6 hours is disclosed inline ("[L2 data 8h old]") and suppressed entirely past 13 hours.
A stitched path often continues into devices that are not on your current canvas — the far tenant's interior, when your scope is one network. Those hops are not cut off at the scope boundary: they draw as ghost placeholders, translucent dashed nodes stepping outward from the last on-scope hop, labelled like real nodes and following the active display mode (hostname → router ID). The overlay arrows continue across them, including the destination marker when the destination itself is off-scope. Ghosts are pure overlay: they disappear when the path is cleared, are replaced by the real node the moment it enters your render scope, and are never saved into layouts.
When forward and reverse costs are equal, the panel shows whether the routes are congruent (same links in both directions) or different (same cost but traversing different links, highlighted in yellow).
Each endpoint (source and destination) in the Route Path panel has a chevron button. Click it to expand an interface address picker showing the device's interfaces grouped into Loopback and Transit / P2P sections. Select a specific interface IP to compute the path to/from that address, or choose Any (device) to use the device itself. When a source address is IPv4, the destination picker filters out IPv6 addresses (and vice versa).
Each direction (forward and reverse) in the Route Path panel includes an Explain button. Clicking it expands a numbered explanation of the routing decision:
- OSPF Intra-area (O): Identifies the shared area and SPF cost.
- OSPF Inter-area (O IA): Shows the backbone transit path and ABR transitions with per-segment costs.
- OSPF External (E1/E2): Explains the LSA type, ASBR, external metric, and forwarding address if applicable.
- IS-IS L1 (I L1): Intra-level route within Level 1. Uses I L1 badge and IS-IS hostnames in explanation.
- IS-IS L2 (I L2): Intra-level route within Level 2. Uses I L2 badge. Explanation references "level-2 backbone".
- IS-IS inter-level (I L2 across two levels): A path that leaves a level-1 area and crosses the level-2 backbone is still labelled I L2 — the level, not the crossing, names the route. The explanation shows the L1/L2 transition and the per-level costs.
-
IS-IS leaked (I IA): A prefix leaked down into a level-1 area with the up/down bit set (Cisco prints
i ia). It gets its own wording — a leaked prefix is not reachable by SPF inside that level, so the explanation names the leak instead of calling it an intra-level route. - ECMP note: When multiple equal-cost paths exist, the explanation notes the count.
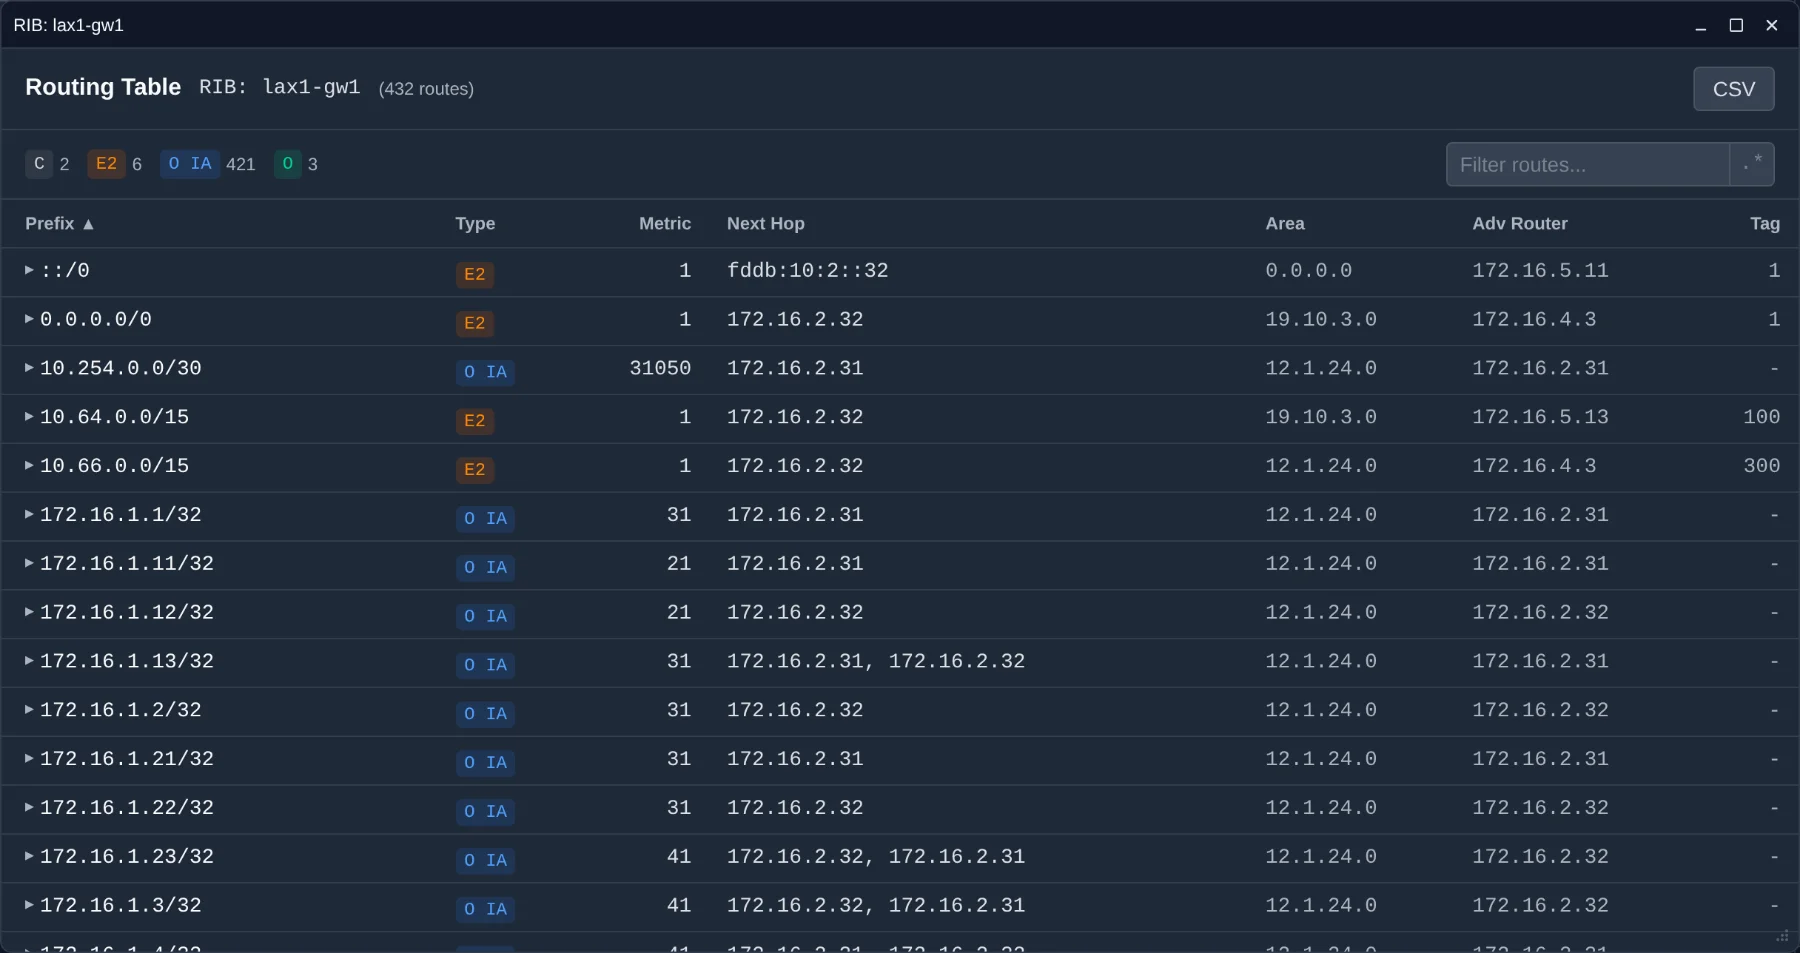
The routing table (right-click > Show routing table) also supports explanations: click any route row with a triangle indicator to expand inline derivation steps showing how the route's metric was computed. A row that this router advertises itself but is not attached to — an IS-IS Level-1/Level-2 router re-advertises its whole level-1 area in its level-2 LSP — shows no next hop and says so: the real next hop lies in an area outside the selected scope, so the row is the advertisement, not an installed forwarding entry.
Right-click any device and select SPF tree from here to view the Dijkstra shortest-path tree rooted at that device within its OSPF area.
- Single-area devices: Clicking the menu item opens the tree directly.
- ABR / multi-area / L1L2 devices: A submenu appears listing each area or level the device belongs to. Select which area's SPF tree to view. In mixed OSPFv2+v3 deployments where the same dotted-quad area exists in both protocols, a suffix disambiguates: "Area 0.0.0.0 (v2)" vs "Area 0.0.0.0 (v3)". For IS-IS L1/L2 routers, the submenu shows "Level 1" and "Level 2".
- When viewing a single area in the sidebar: Always opens directly (the area is already determined).
The SPF Tree panel shows:
| Element | Description |
|---|---|
| Header | "SPF Tree" with area label badge, root device name, node count, and max cost |
| Expand/Collapse | "Expand all" and "Collapse all" controls |
| Tree rows | Indented tree with CSS connector lines. Each row shows: device name (hostname or router ID), ABR badge (blue), ASBR badge (amber), and collapsed child count hint |
| Cost columns | Link cost (+N for each hop), total cumulative cost, and a proportional cost bar |
Click any device in the tree to highlight it on the canvas. The tree is time-travel aware -- when viewing historical topology, the SPF tree is computed from the historical snapshot.