Topology Canvas
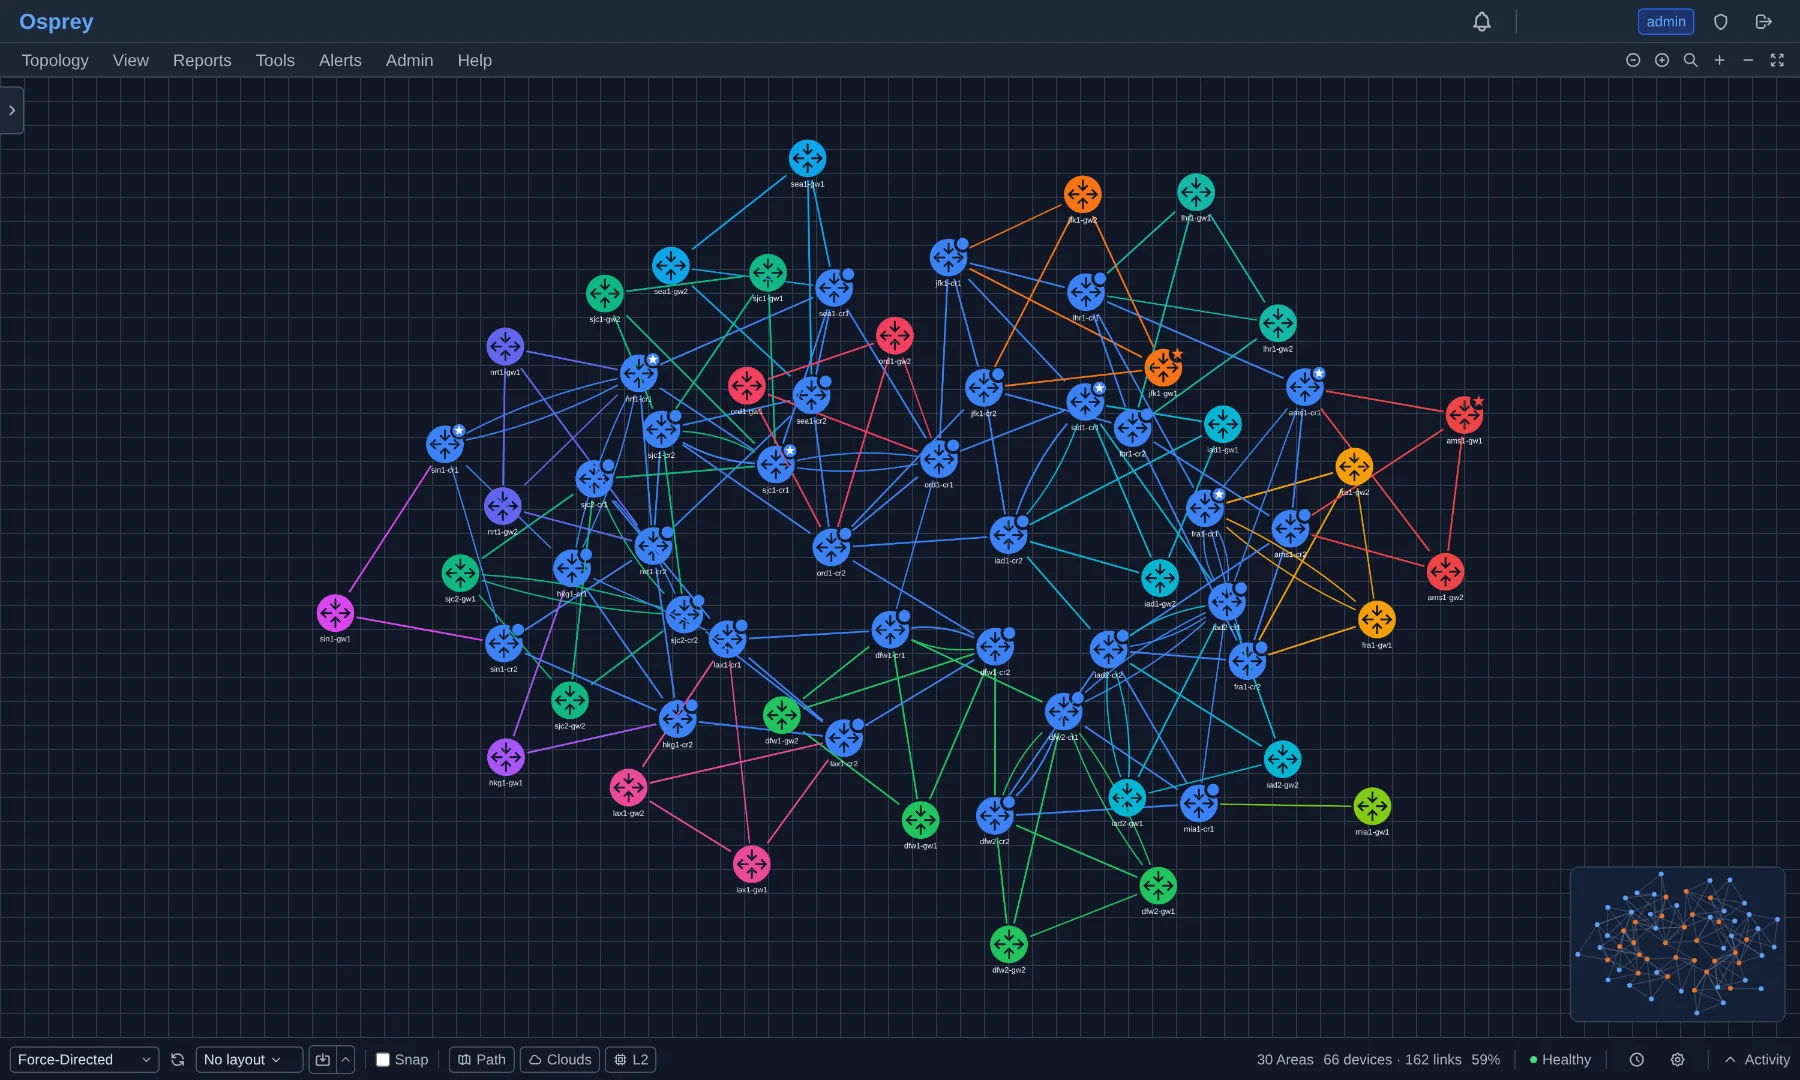
The canvas is the heart of Osprey. It shows routers as nodes and IGP adjacencies (OSPF or IS-IS) as links, arranged in an interactive graph. Changes are pushed via WebSocket in real time -- when a device or link changes state, affected elements briefly flash with a highlight animation and a toast notification appears summarizing the update (e.g., "Topology updated: 2 devices, 3 links changed").
| Action | How |
|---|---|
| Pan | Click and drag on empty canvas |
| Zoom | Mouse wheel (scroll up = zoom in) |
| Zoom in/out | Click the +/- icons in the menu bar (top-right) |
| Node/label size | Click the circled ⊖/⊕ icons in the menu bar (top-right, left of search). Shrinks or enlarges all node icons and labels in place — positions and zoom stay put, so shrinking frees up room on the links for cost, interface and IP labels. Also available as View > Size Down/Up; View > Size Reset restores 100%. |
| Fit to screen | Click the fit-to-screen icon in the menu bar (top-right) |
| Select device | Left-click a node (opens Node Detail Panel) |
| Select link | Left-click an edge (opens Link Detail Panel) |
| Context menu | Right-click a node or link |
| Search | Ctrl+K / Cmd+K (or Tools > Search) |
| Deselect | Left-click empty canvas (deselects; panels remain open) |
| Return to dashboard | Topology > Dashboard |
| Refresh topology | Topology > Refresh |
| Export | Topology > Export as PNG or Topology > Export as SVG. Exports use the current theme background color. If the grid is enabled (View > Grid), it is included in the export. |
Use the sidebar (left panel) to navigate the hierarchy. Click an area (OSPF area or IS-IS level) to load its topology on the canvas. You can check/uncheck multiple areas within the same protocol instance to view them together. IS-IS levels appear in the sidebar as "Level 1" and "Level 2" instead of dotted-decimal area IDs.
The sidebar is resizable -- drag its right edge. Toggle it via View > Sidebar.
Osprey uses force-directed layout by default. The bottom bar contains the layout toolbar on the left side and status indicators on the right side.
Layout algorithm dropdown (four options):
- Force-Directed (default): fCoSE physics-based layout. Best general-purpose choice.
- Geometric: Manhattan-style grid placement using BFS ordering from a reference fCoSE layout. Produces clean right-angle layouts.
- Octilinear: Like Geometric but allows 45-degree diagonal edges. Minimizes edge crossings with iterative refinement across multiple root candidates.
- Circle: Arranges all nodes in a circle.
Layout actions in the bottom bar:
- Re-layout button: Re-run the current algorithm on the entire canvas.
- Layout picker dropdown: Switch between named saved layouts. Active layout is highlighted. Layouts marked "(default)" are the routing-domain default (shared across every protocol instance in the domain).
- Save split-button: The save icon overwrites the active layout with the current arrangement (a warning dot appears when it has been modified — "dirty" state). When no layout is active, it opens the Save-as popover instead. The adjacent chevron opens a menu with Save as new layout... (name popover, Enter to confirm) and Revert to saved positions (enabled when the layout is dirty and an active layout exists). A layout stores node positions, the viewport (zoom/pan), hidden nodes, and the node/label size — so a "spacious" arrangement made to show link IP labels comes back exactly as saved, shrunken nodes included. Changing the node size while a layout is active marks it dirty, just like dragging a node.
- Delete layout: Admins can delete saved layouts via the X button in the picker dropdown.
Snap-to-grid: Enable the "Snap" checkbox in the bottom bar to lock dragged nodes to a grid. Choose grid spacing (10px, 20px, or 40px) from the adjacent dropdown.
Drag nodes to adjust their position. Layout positions are scoped to the protocol instance level, so positions saved in one area view are shared when switching to another area under the same OSPF process or IS-IS instance.
A minimap overlay appears in the bottom-right corner of the canvas when enabled. It shows a bird's-eye view of the entire graph with:
- Colored dots for nodes (blue for normal, orange for ABRs, red for down devices)
- Gray lines for edges
- A blue rectangle indicating the currently visible viewport area
Click or drag on the minimap to pan the main canvas to that location.
Nodes display:
- Icon: Based on device role (router, ABR/L1L2, ASBR, ABR+ASBR, collector) in the selected icon pack. Both builtin packs provide dedicated icons for each role. IS-IS L1/L2 routers use the same icon as OSPF ABRs. In "By Area" color mode, icons are recolored to match the area's assigned color.
- Label: Depends on the View > Node Labels setting (hostname, DNS, router ID, etc.).
- Border color: Depends on the View > Color setting (area color, metric cost, utilization).
- Size: Adjustable via View > Size (up, down, reset) or the circled ⊖/⊕ buttons in the menu bar (top-right, left of search). Edge label font sizes scale proportionally with node size, and node positions never move — shrinking is the quickest way to make dense layouts readable when link IP/interface labels are enabled. The size survives topology updates and view toggles, and is saved as part of a topology layout: activating (or reverting to) a saved layout restores the size it was saved with. Without an active layout it resets to 100% on reload.
- Status overlays: Stale devices appear visually degraded. Changed elements briefly flash with a highlight animation for 3 seconds after a topology update.
Links display:
- Line style: Solid for up, dashed red for down. A merged multi-protocol link with only some of its protocols down (e.g., OSPFv2 down while OSPFv3 is still up) is degraded: it renders dashed in its normal area color the moment the first protocol fails, while the cost label keeps showing the cost of the surviving protocol(s). Links in a stale area (no recent collector data) appear dashed and dimmed; staleness is tracked per protocol instance, so a healthy OSPFv2 link is not dimmed when only the OSPFv3 instance of the same area is stale.
- Color: Depends on color mode (area, cost gradient, utilization heatmap).
- Labels: Toggled independently -- cost, interface names, IP addresses (View > Link Labels). Asymmetric costs are flagged with a visual indicator. IS-IS wide metrics (up to 16M) are abbreviated on cost labels: 10K, 1.2M, 16.7M.
-
Multi-protocol merging: When multiple protocols (OSPFv2, OSPFv3, IS-IS) share the same physical interface between two devices, their links merge into a single edge on the canvas. Merged edges are slightly thicker (2.5px for 2 protocols, 3px for 3+) and show a
[2P]or[3P]suffix after the cost label. Hover a merged edge to see a compact tooltip with each protocol's area, cost, and state. A merged edge counts as down only when every member protocol is down; with a partial failure it shows the degraded (dashed, area-colored) style. Merging requires SNMP enrichment to identify the shared physical interface (ifIndex). Without SNMP, each protocol's links appear as separate edges.
You can hide devices from the canvas:
- Right-click > Hide: Hides a single device.
- View > Filters > Hide Leaf Nodes: Hides devices with one or fewer links.
- View > Filters > Hide Failed Nodes: Hides isolated/unreachable devices.
- View > Filters > Hide Unconnected: Hides devices with zero connected edges.
- View > Filters > Vendor: Filter to show only a specific vendor. A submenu lists all discovered vendors; select one, or choose "All Vendors" to reset.
- View > Filters > Role: Filter to show only ABRs or ASBRs. Select "All Roles" to reset.
- View > Filters > Unhide All: Resets all filters at once (also available in the bottom bar).
Hidden nodes are indicated by an "Unhide (N)" badge in the bottom bar. Click it to restore all hidden nodes.
Collector (recorder) nodes are hidden by default — a recorder is a passive monitor, not a router. Uncheck View → Filters → Hide Recorders to show them: they then appear as muted, dashed-border nodes near the devices they monitor, with their tunnel link always rendered up (a recorder advertises max-metric to stay out of routing, so the link is never a failure). Recorders are also excluded from diagnostic reports (asymmetric cost, timer consistency, best-practices passive-interface, isolated/down devices) and are not counted against your license node limit — they are probes Osprey injects, not managed network devices.
Toggle View > Area Boundaries to draw colored translucent hull overlays around each OSPF area's or IS-IS level's devices, visualizing area containment. The hulls automatically redraw as you pan, zoom, or move nodes. This setting persists across sessions via user settings.
Toggle View > Grid to show a dot-grid background on the canvas. This is a visual aid for manual node placement and works independently of the snap-to-grid feature in the bottom bar.
When viewing large multi-area topologies, Osprey can display an aggregated "cloud view" that shows each area as a stylized cumulus cloud instead of rendering every individual device. This provides a high-level overview of inter-area connectivity without overwhelming the canvas with hundreds of nodes.
Activating cloud view:
- Automatic: When 10 or more areas are checked in the sidebar, cloud view activates automatically. The threshold is configurable via Admin > System Settings > Display > Area cloud auto-threshold.
- Manual: Toggle View > Area Cloud Overview or click the cloud icon in the toolbar to switch between cloud view and full topology.
- Per-user preference: Your explicit toggle overrides the auto-threshold until you reset it.
Cloud appearance:
- Each area appears as a colored cumulus cloud shape, sized proportionally to its device count (200-440px based on log scale).
- The cloud label shows the area ID, device count, and alert count (if any).
- Cloud border style indicates area type: solid for normal areas, dashed for stub, dot-dash for NSSA, long-dash for totally stubby.
- Health status is indicated by border color: green (healthy), yellow (warning), red (critical).
Inter-area edges:
- Bundled edges connect clouds that share ABRs. Edge thickness scales with the number of ABRs.
- Hover an edge to see the connected areas and ABR count.
- Virtual link edges are labeled "VL" with a distinctive style.
ABR nodes:
- ABRs appear as smaller nodes between the clouds they connect.
- ABR labels show hostname (or router ID if no hostname).
- ABR role badges indicate: ABR, ASBR, L1/L2, or combined roles.
Interacting with clouds:
| Action | Result |
|---|---|
| Single-click | Opens the Area Detail Panel showing device/link counts, health, alerts, and connected ABRs |
| Double-click | Expands the cloud in place, revealing all devices inside with animated transition |
| Right-click | Context menu: Expand/Collapse, Open Detail Panel, Hide Area, Open LSDB |
| Hover | After a short, deliberate pause, shows a popup with area stats: devices, intra-area links, inter-area edges, ABRs, alerts (hidden while a context menu is open) |
Expanded clouds:
- When you double-click a cloud, it expands to show the area's devices rendered inside a dashed hull boundary.
- The cloud background fades out and child nodes fade in over 250ms (two-phase animation).
- Double-click again to collapse back to the cloud view.
- Use the context menu's "Collapse area" or press Escape to collapse all expanded areas.
- Expansion state is preserved while in cloud view but resets when switching to full topology.
Performance:
- Cloud shapes are procedurally generated SVGs cached in an LRU cache (200 entries).
- Animations are skipped when more than 3 areas are expanded simultaneously.
- The
prefers-reduced-motionmedia query disables all animations for users who prefer reduced motion.
Accessibility:
- Full keyboard navigation: Tab through clouds, Enter to expand/collapse, Space to open panel, Escape to collapse all, Arrow keys to navigate between clouds.
- Screen reader accessible with ARIA labels: "Area {label}, {count} devices, health {status}, {n} alerts".
- Focus indicators appear as visible borders around the focused cloud.
In time travel: the overview reconstructs at the selected time — device and link counts, ABR detection and virtual-link edges come from each area's topology snapshot at that moment, and alert/incident counts follow their validity windows (an alert resolved since then counts again; one raised later does not). An area with no snapshot at the selected time reads as empty: it did not exist yet.