Repository navigation
GUI Walkthrough
The golgi GUI is a browser-based application (Trame + Vuetify) that runs the entire image-to-recruitment pipeline by point-and-click — no programming required. This page tours every screen and panel in workflow order.
New to golgi? The illustrated, step-by-step Tutorial walks through a complete study with screenshots — from creating an account to a whole-population activation report. This page is the terser panel-by-panel reference.
Launch it with:
golgi # then open the printed local URL (default http://localhost:8080)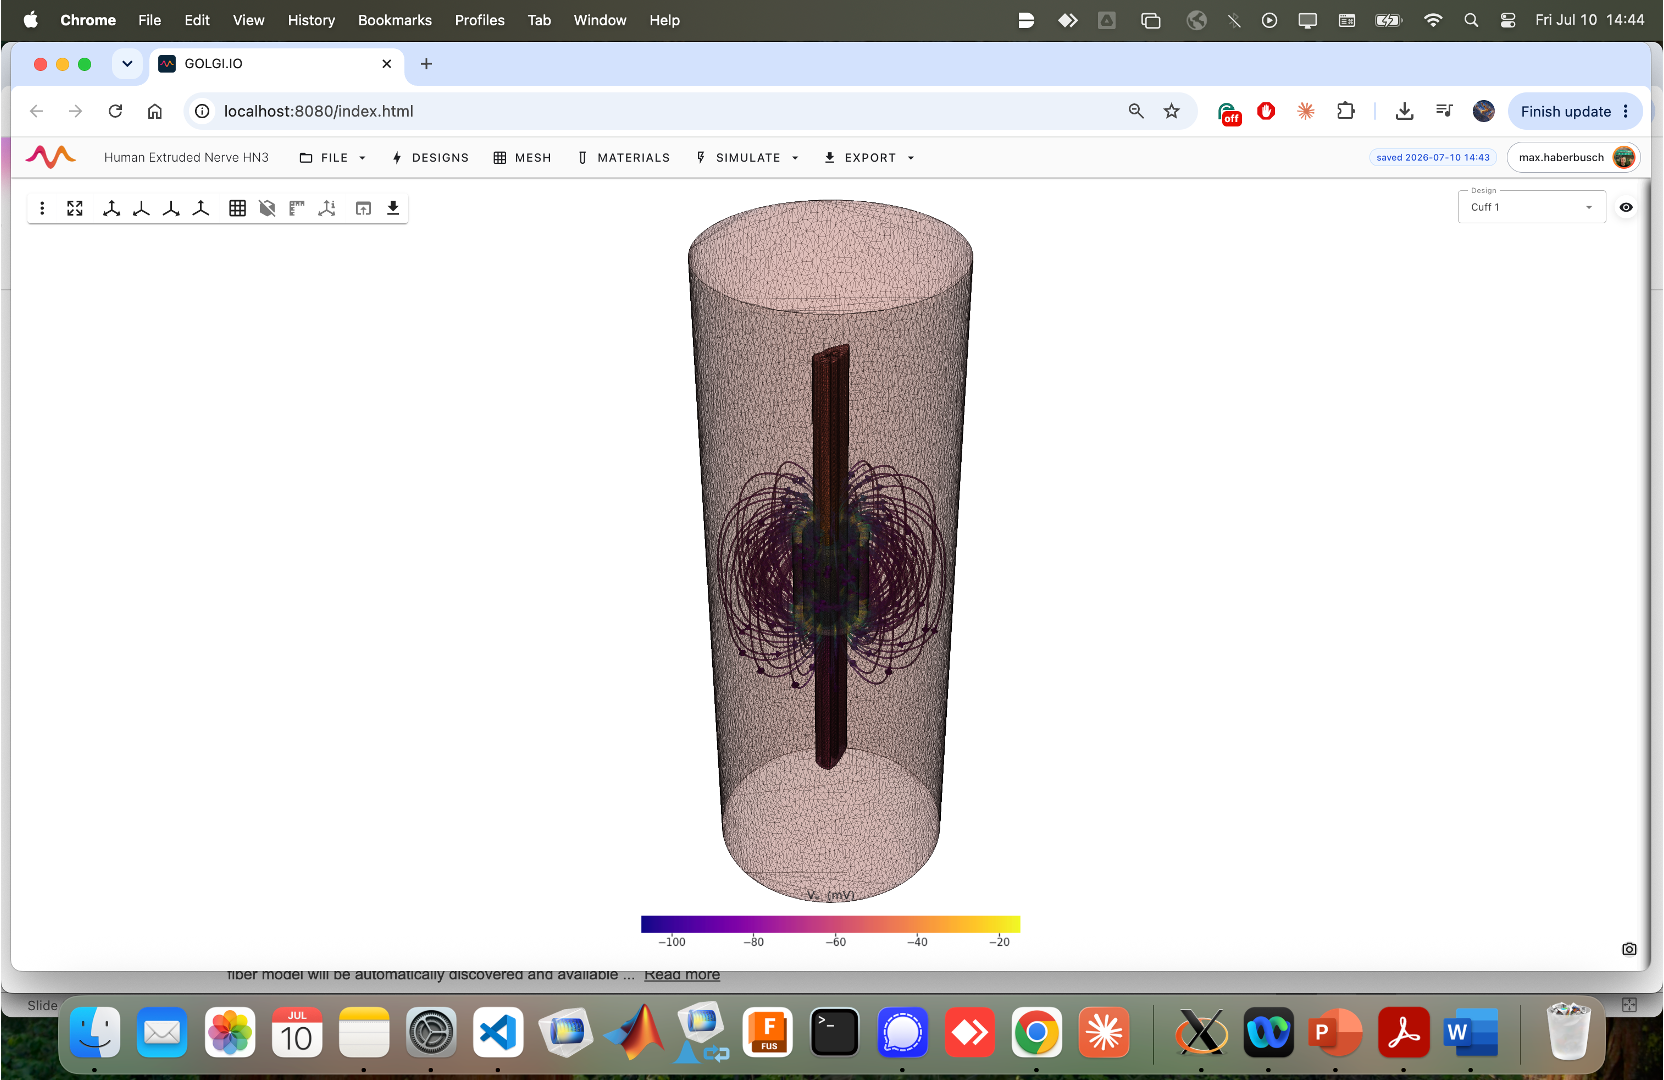
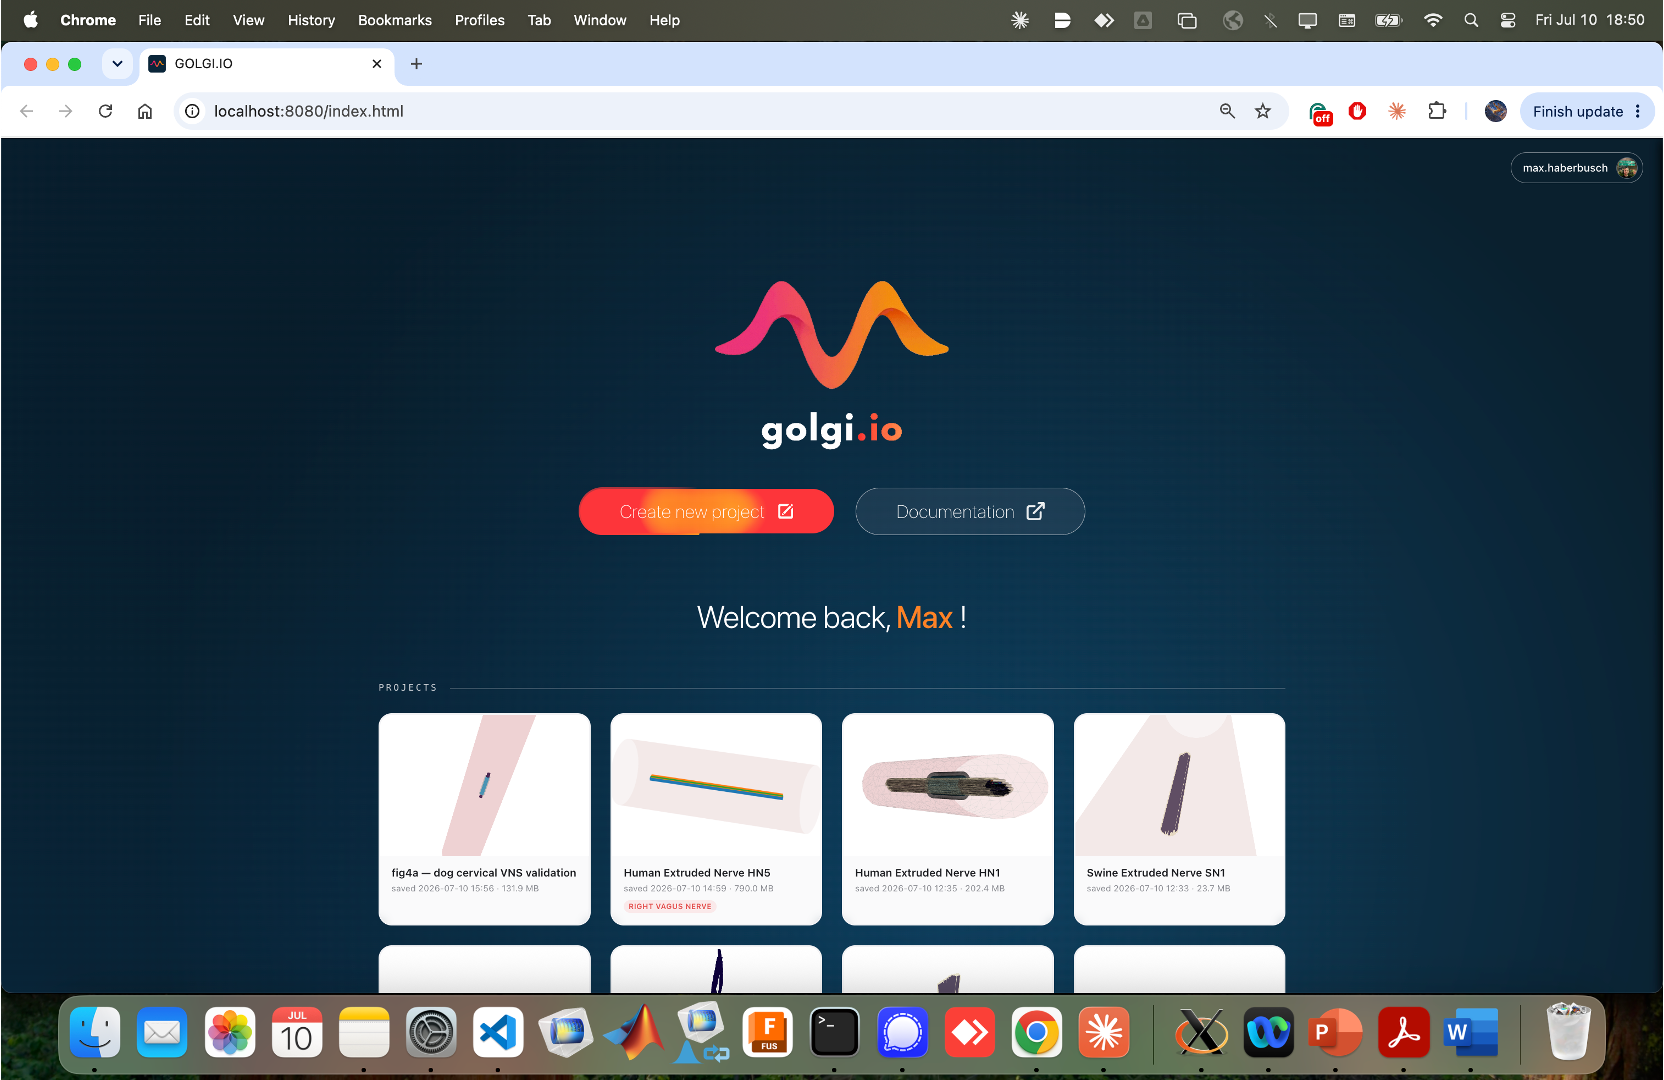
- Welcome view — shown when no project is open: the golgi wordmark, a Create new project / Sign in call to action, a documentation link, and a grid of project tiles (thumbnail, name, modified date, size, status badges). Top-right: a user-avatar menu (Profile Settings · Sign out).
-
Workspace view — shown with a project open:
- a top navbar: logo · project name · File menu · Designs · Mesh · Materials · Simulate menu · Export menu · a "saved" status chip · the user avatar;
- the central 3-D viewport (the nerve, cuff, mesh, fibers, and fields render here);
- right-side drawers (one at a time) for each pipeline stage;
- a busy lightbox during long operations (animated loader, live log tail, Cancel button);
- modal dialogs (auth, project details, cuff designer, report generator, sweeps, …).
The navbar tabs are gated by progress: Mesh enables once a design exists, Materials once a mesh exists, Simulate once materials are committed, Export once a fiber simulation exists.
- Sign in from the welcome screen (email/password). Projects are per-user, with optional sharing.
- Create new project → name it → the empty workspace opens.
- Click a project tile (or the project-name pill in the navbar) to open the Project Details dialog — two columns (thumbnail + metadata) with Overview / Status / Activity tabs. Overview shows creator/modifier, rename, labels, and Shared with; Status shows completion badges and file sizes; Activity is the project's audit log. Buttons: Open, Delete, Export study.
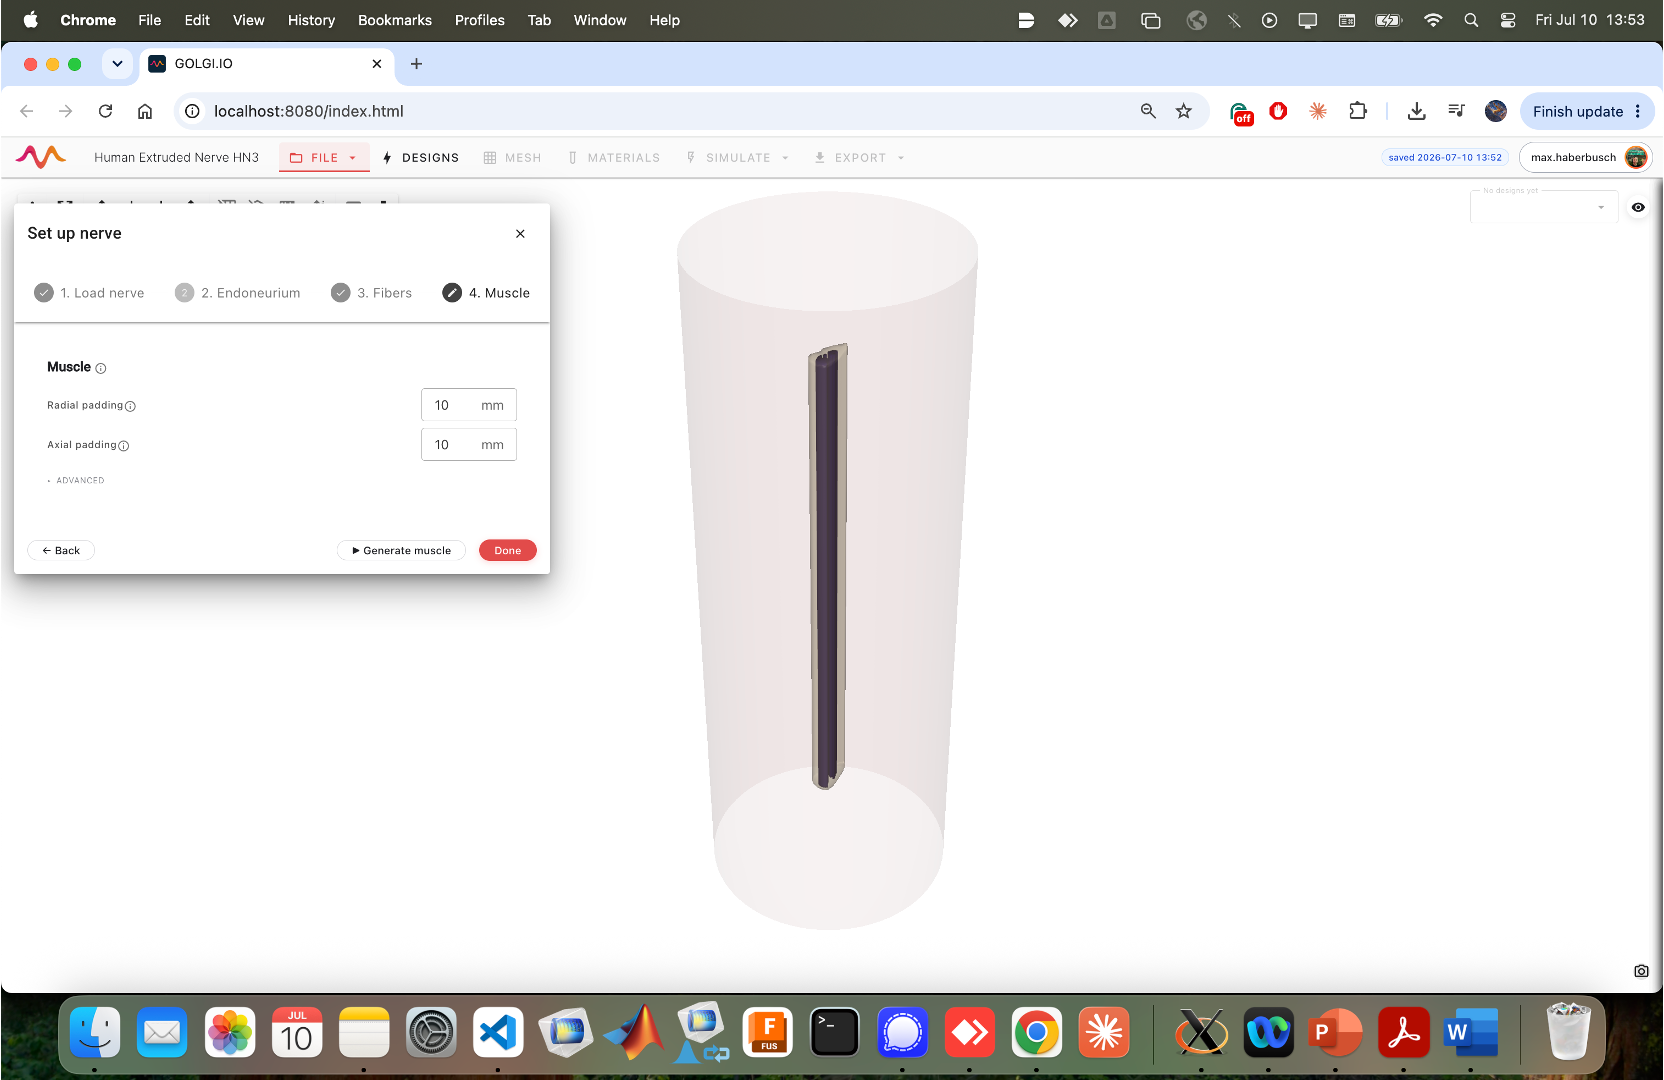
The Import wizard walks you through building the nerve geometry:
- Load nerve — choose a source: an STL surface, a golgi µCT bundle (segmentation output with epineurium + per-fascicle endoneurium), or a histology bundle. For STL you pick the file, a unit-scaling preset (mm→m, µm→m, …), an optional separate epineurium surface, and a decimation target, then Load geometry. A geometry summary and a triangle-quality histogram appear; you can colour the nerve by triangle quality.
- Endoneurium — optionally generate an inward-offset epineurium shell of a chosen thickness (STL flow), or review the fascicle counts (bundle flow).
- Fibers — set seeding/streamline and cap-detection parameters and Generate trajectories; a branch summary table appears (branches can be renamed). See Fiber Populations & Trajectories.
- Muscle — place the surrounding-tissue (muscle) bounding box (radial/axial padding, offsets), then Done.
File ▸ Segment µCT slice… opens the interactive segmentation dialog for histology/µCT images, producing a bundle you can load in step 1.
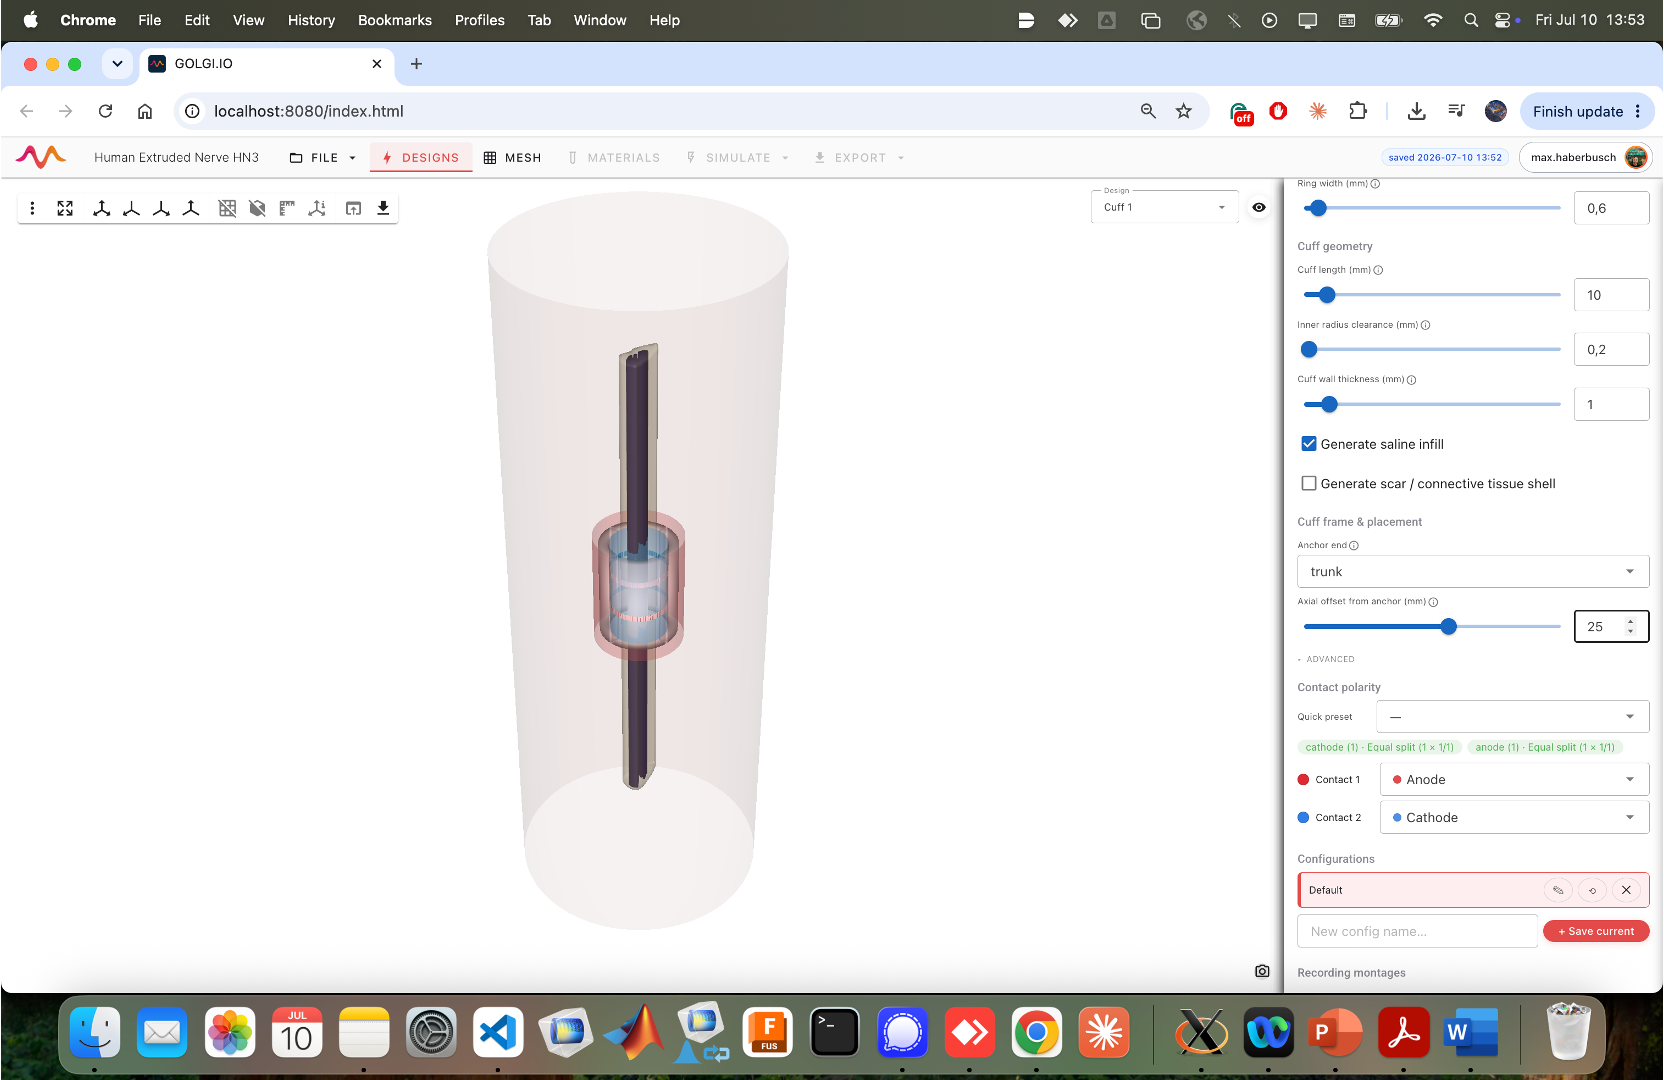
The Designs drawer manages one or more electrode designs on the nerve:
- + Add a design, or + Sweep to batch-clone a design across positions (Z translation), twists (rotation), a grid, or scar thickness.
- Pick a Contact configuration: bipolar ring-pair · tripolar · ring-array (N×M) · helical (LivaNova-style) · LIFE · TIME · DUKE (ASCENT preset). Type-specific sliders appear (separations, widths, rows/cols, pitch, wire diameter, …).
- Set per-contact polarities (anode / cathode / off / ground) and current fractions — the basis for current steering.
- Refit snaps the cuff to the nerve at its current position.
- DUKE opens the Cuff Designer dialog: an ASCENT preset picker with a live 3-D preview and per-preset sliders. See Electrodes & Cuff Designer.
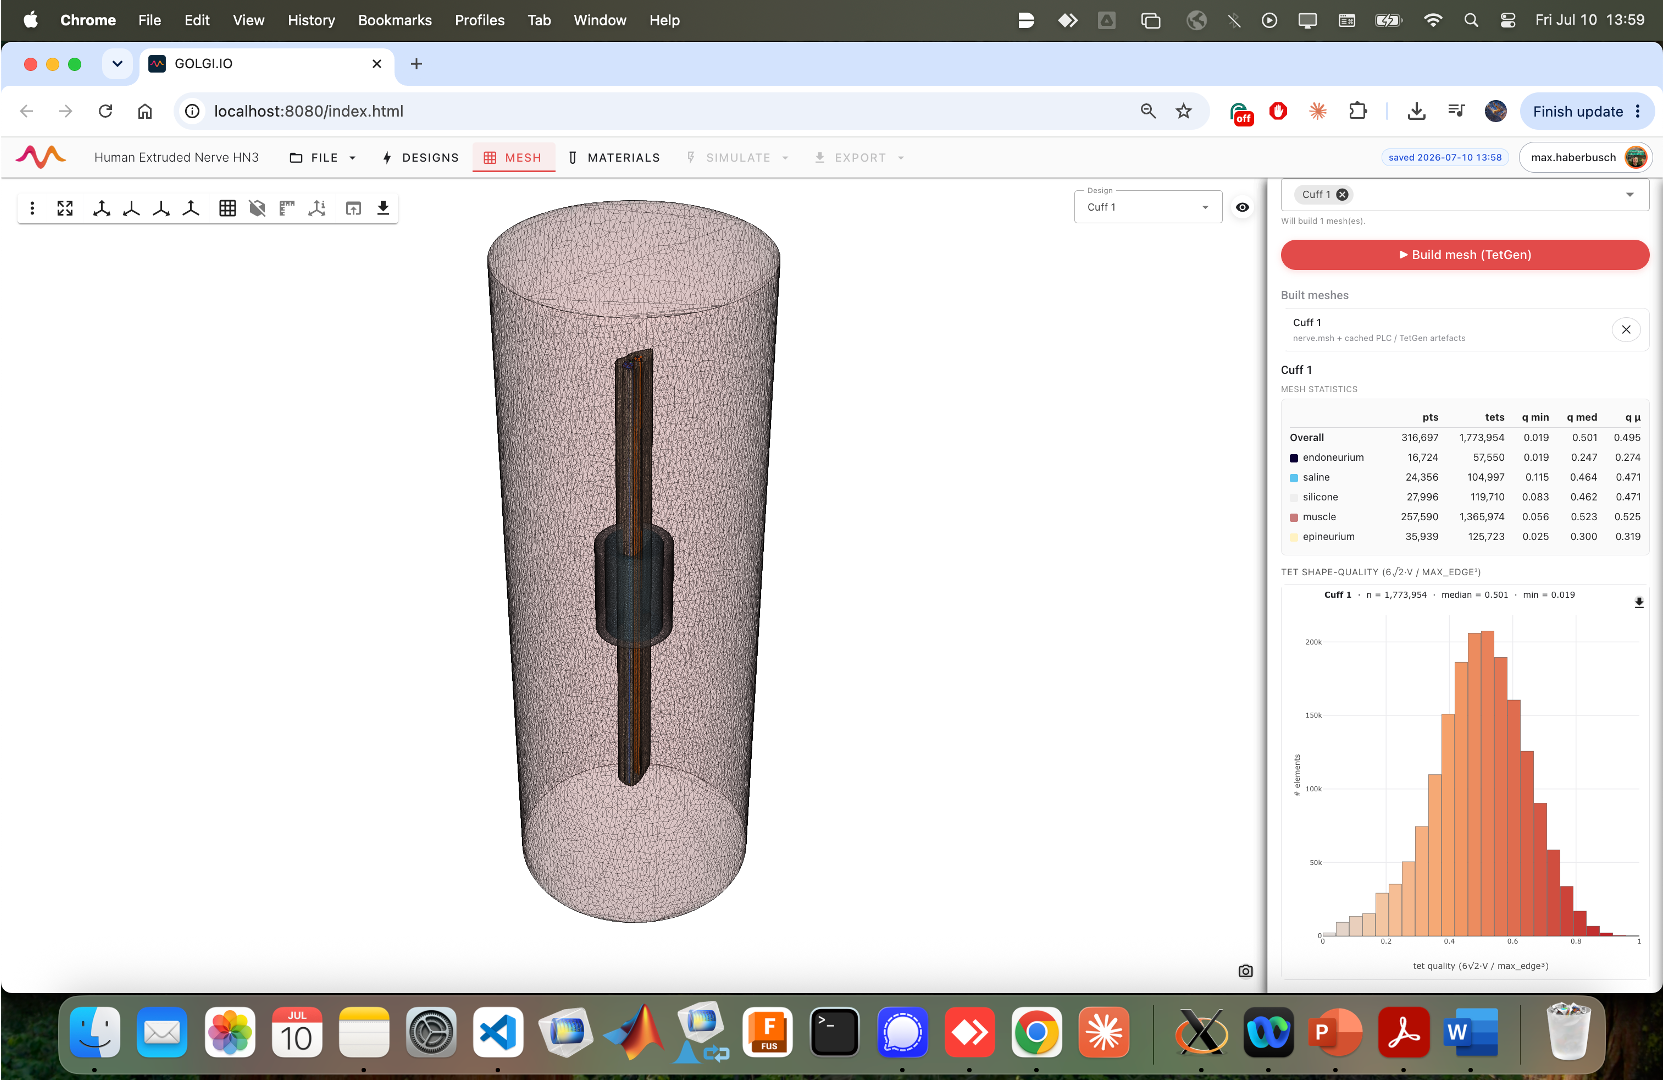
The Mesh drawer sets per-region element sizes (endoneurium, epineurium, muscle, scar; saline, silicone, contacts), lets you choose which designs to mesh, and Build mesh (TetGen). Built meshes list per-design stats with mesh-quality histograms. See Meshing.
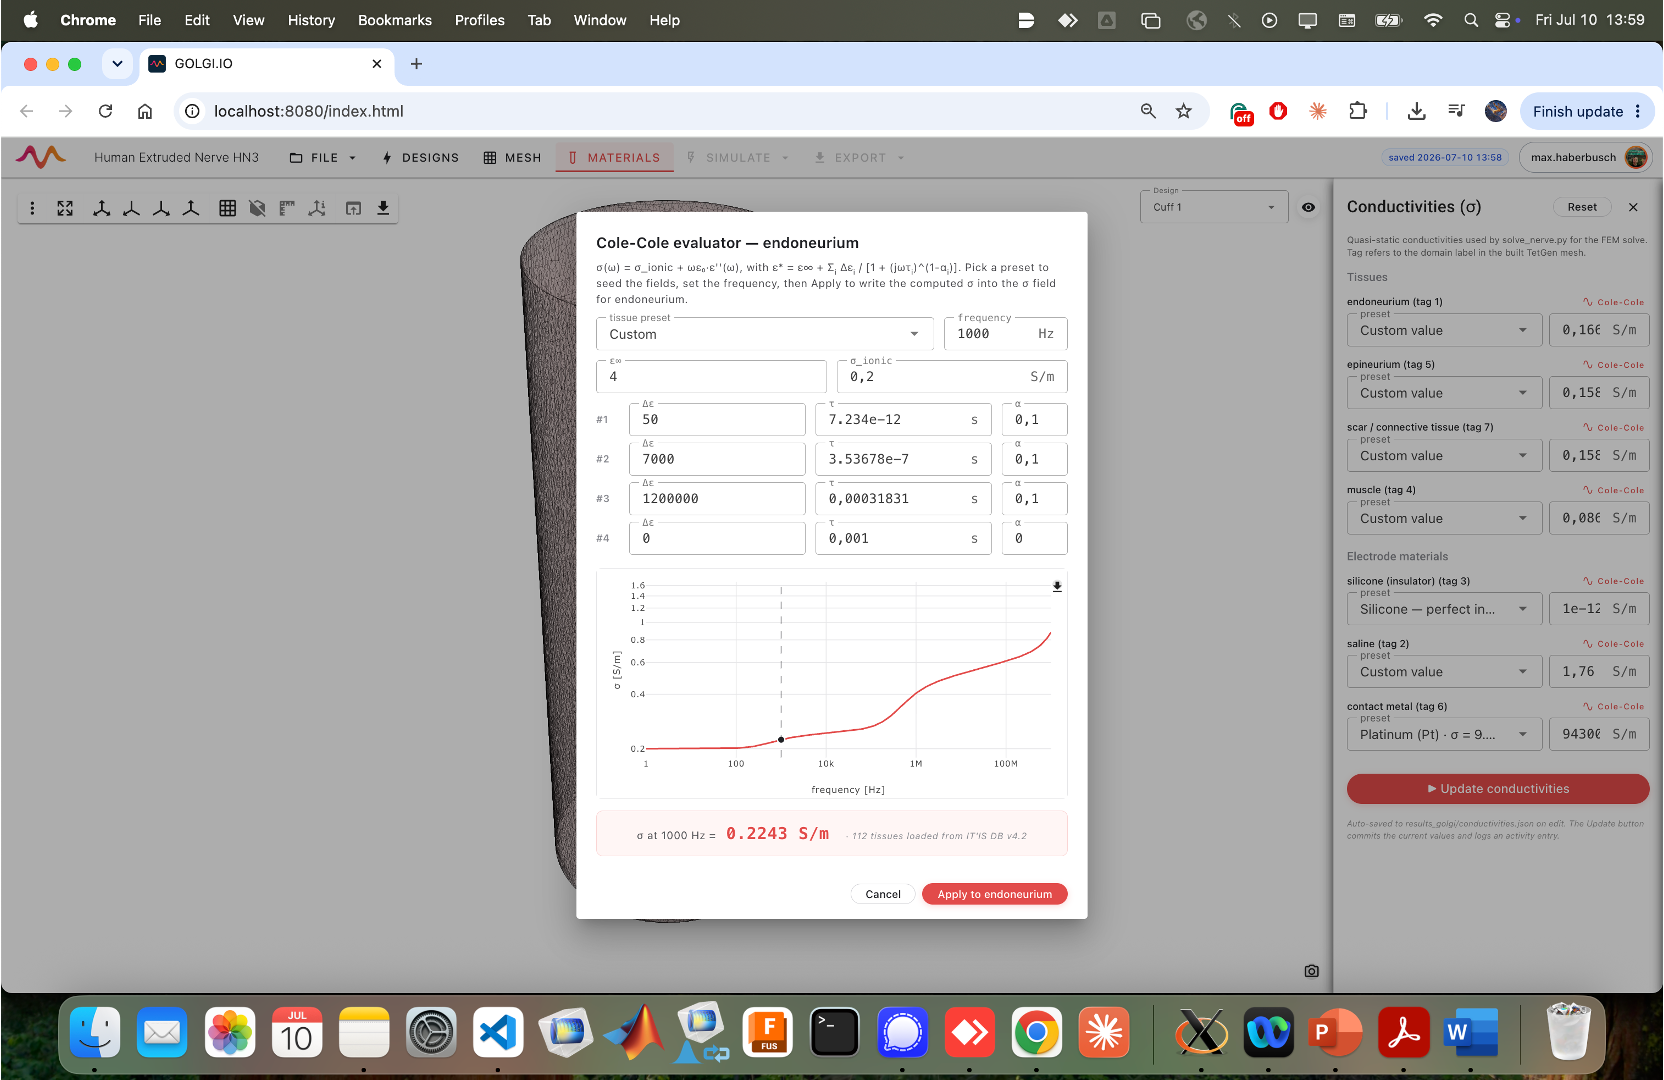
The Conductivities (σ) drawer sets each tissue/material conductivity (endo, epi, scar, muscle; silicone, saline, contacts) — by preset, by direct value, or via the Cole–Cole dialog for a frequency-domain model — then Update conductivities. See Conductivity & Tissue Properties.
The Simulate menu runs the compute stages:
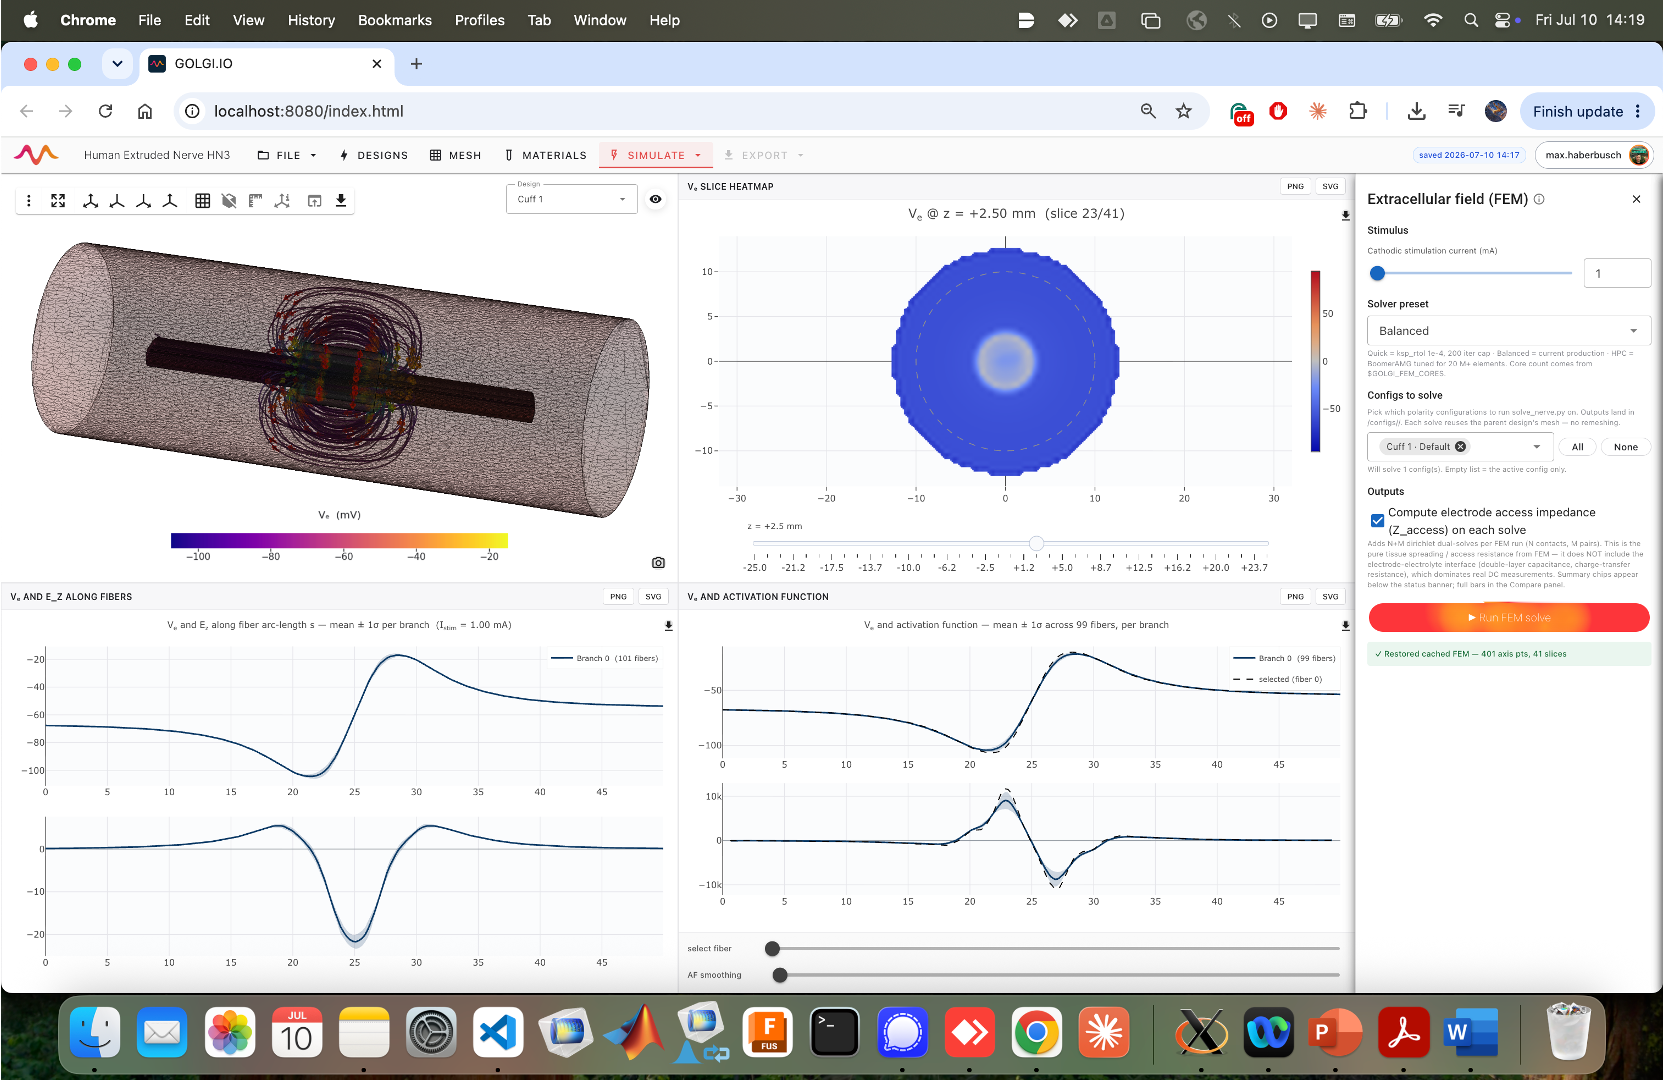
- Extracellular field (FEM) — set the stimulus current, pick a solver preset (Quick / Balanced / HPC), choose which configs to solve, optionally compute access impedance, then Run FEM solve. Access-impedance chips appear per contact and per pair. See Finite-Element Solver.
- Single fiber / Fiber population — pick fibers/population and a stimulus, then run; results show membrane-potential traces, thresholds, recruitment, and cross-section heatmaps.
- Sweep (recruitment / threshold) — manual or random parameter sweeps producing recruitment curves and threshold heatmaps. See Recruitment Sweeps & Selectivity.
- Compare configurations — side-by-side fields + selectivity bar chart + threshold-ratio table (enabled once ≥2 configs are solved).
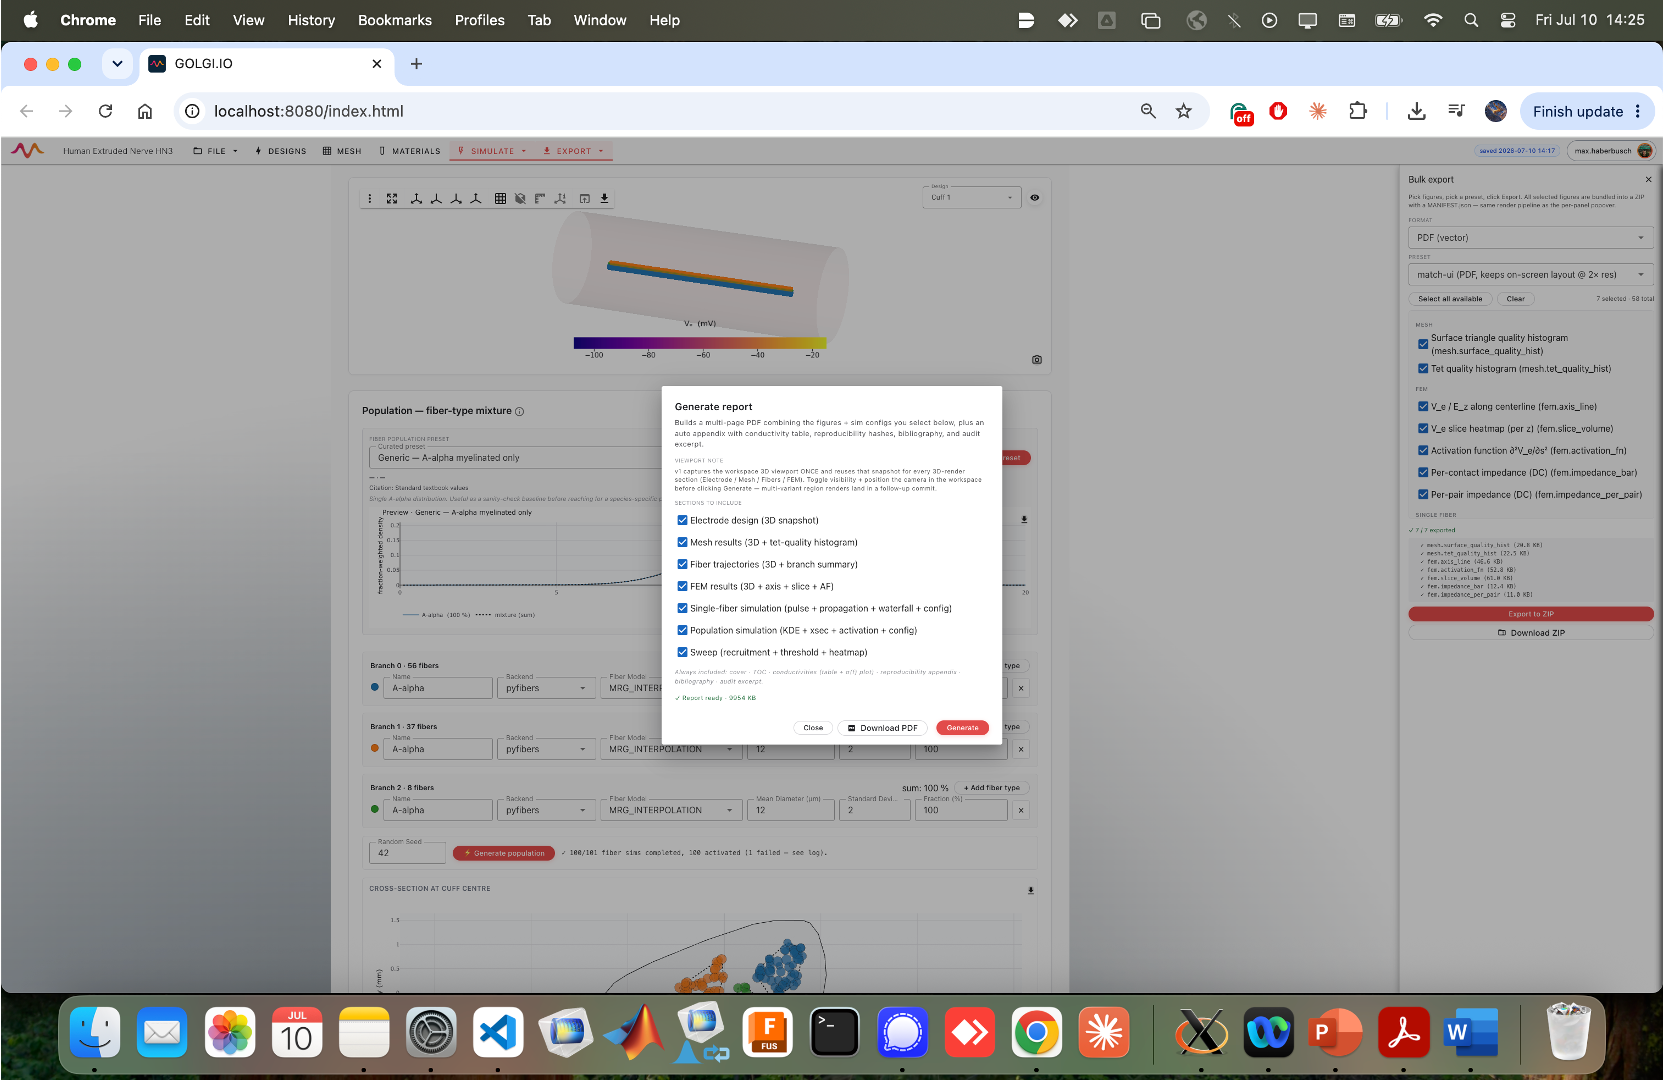
- Export figures — the Bulk Exports drawer: pick a format (PNG/PDF/SVG/…) and preset, tick figures by category, and Export to ZIP.
- Export report — the Generate Report dialog: tick sections (electrode, mesh, fibers, FEM, single-fiber, population, sweep) and Generate a multi-page PDF (cover, ToC, conductivity table, reproducibility appendix, bibliography, and audit excerpt are auto-included). Position the 3-D viewport camera first — the report captures it once. See Figures & Reports.
- File ▸ Export study / Import study — package or restore an entire project as a study bundle.
Per-panel figure export buttons sit beside individual plots, and a floating camera button exports a screenshot of the 3-D viewport.
- The busy lightbox streams the live compute log and can Cancel any long-running job.
- The GUI and Python API share the same on-disk state — build a project in the browser, then continue it from a script (or the reverse).
- Most parameter changes update the 3-D viewport reactively.
Getting Started · Pipeline Overview · Electrodes & Cuff Designer · Figures & Reports · Authentication & Audit

Get started
Tutorial
Build a model
Simulate & analyze
- Finite-Element Solver
- Fiber Populations & Trajectories
- Fiber Models & Activation
- Recruitment Sweeps & Selectivity
- Recording & CNAP
Share & reproduce
Scripting & scale
Reference
Research & project